Recently, I’ve been optimizing the performance of DDE, so I’ve been catching up on the use of various analysis tools under linux.
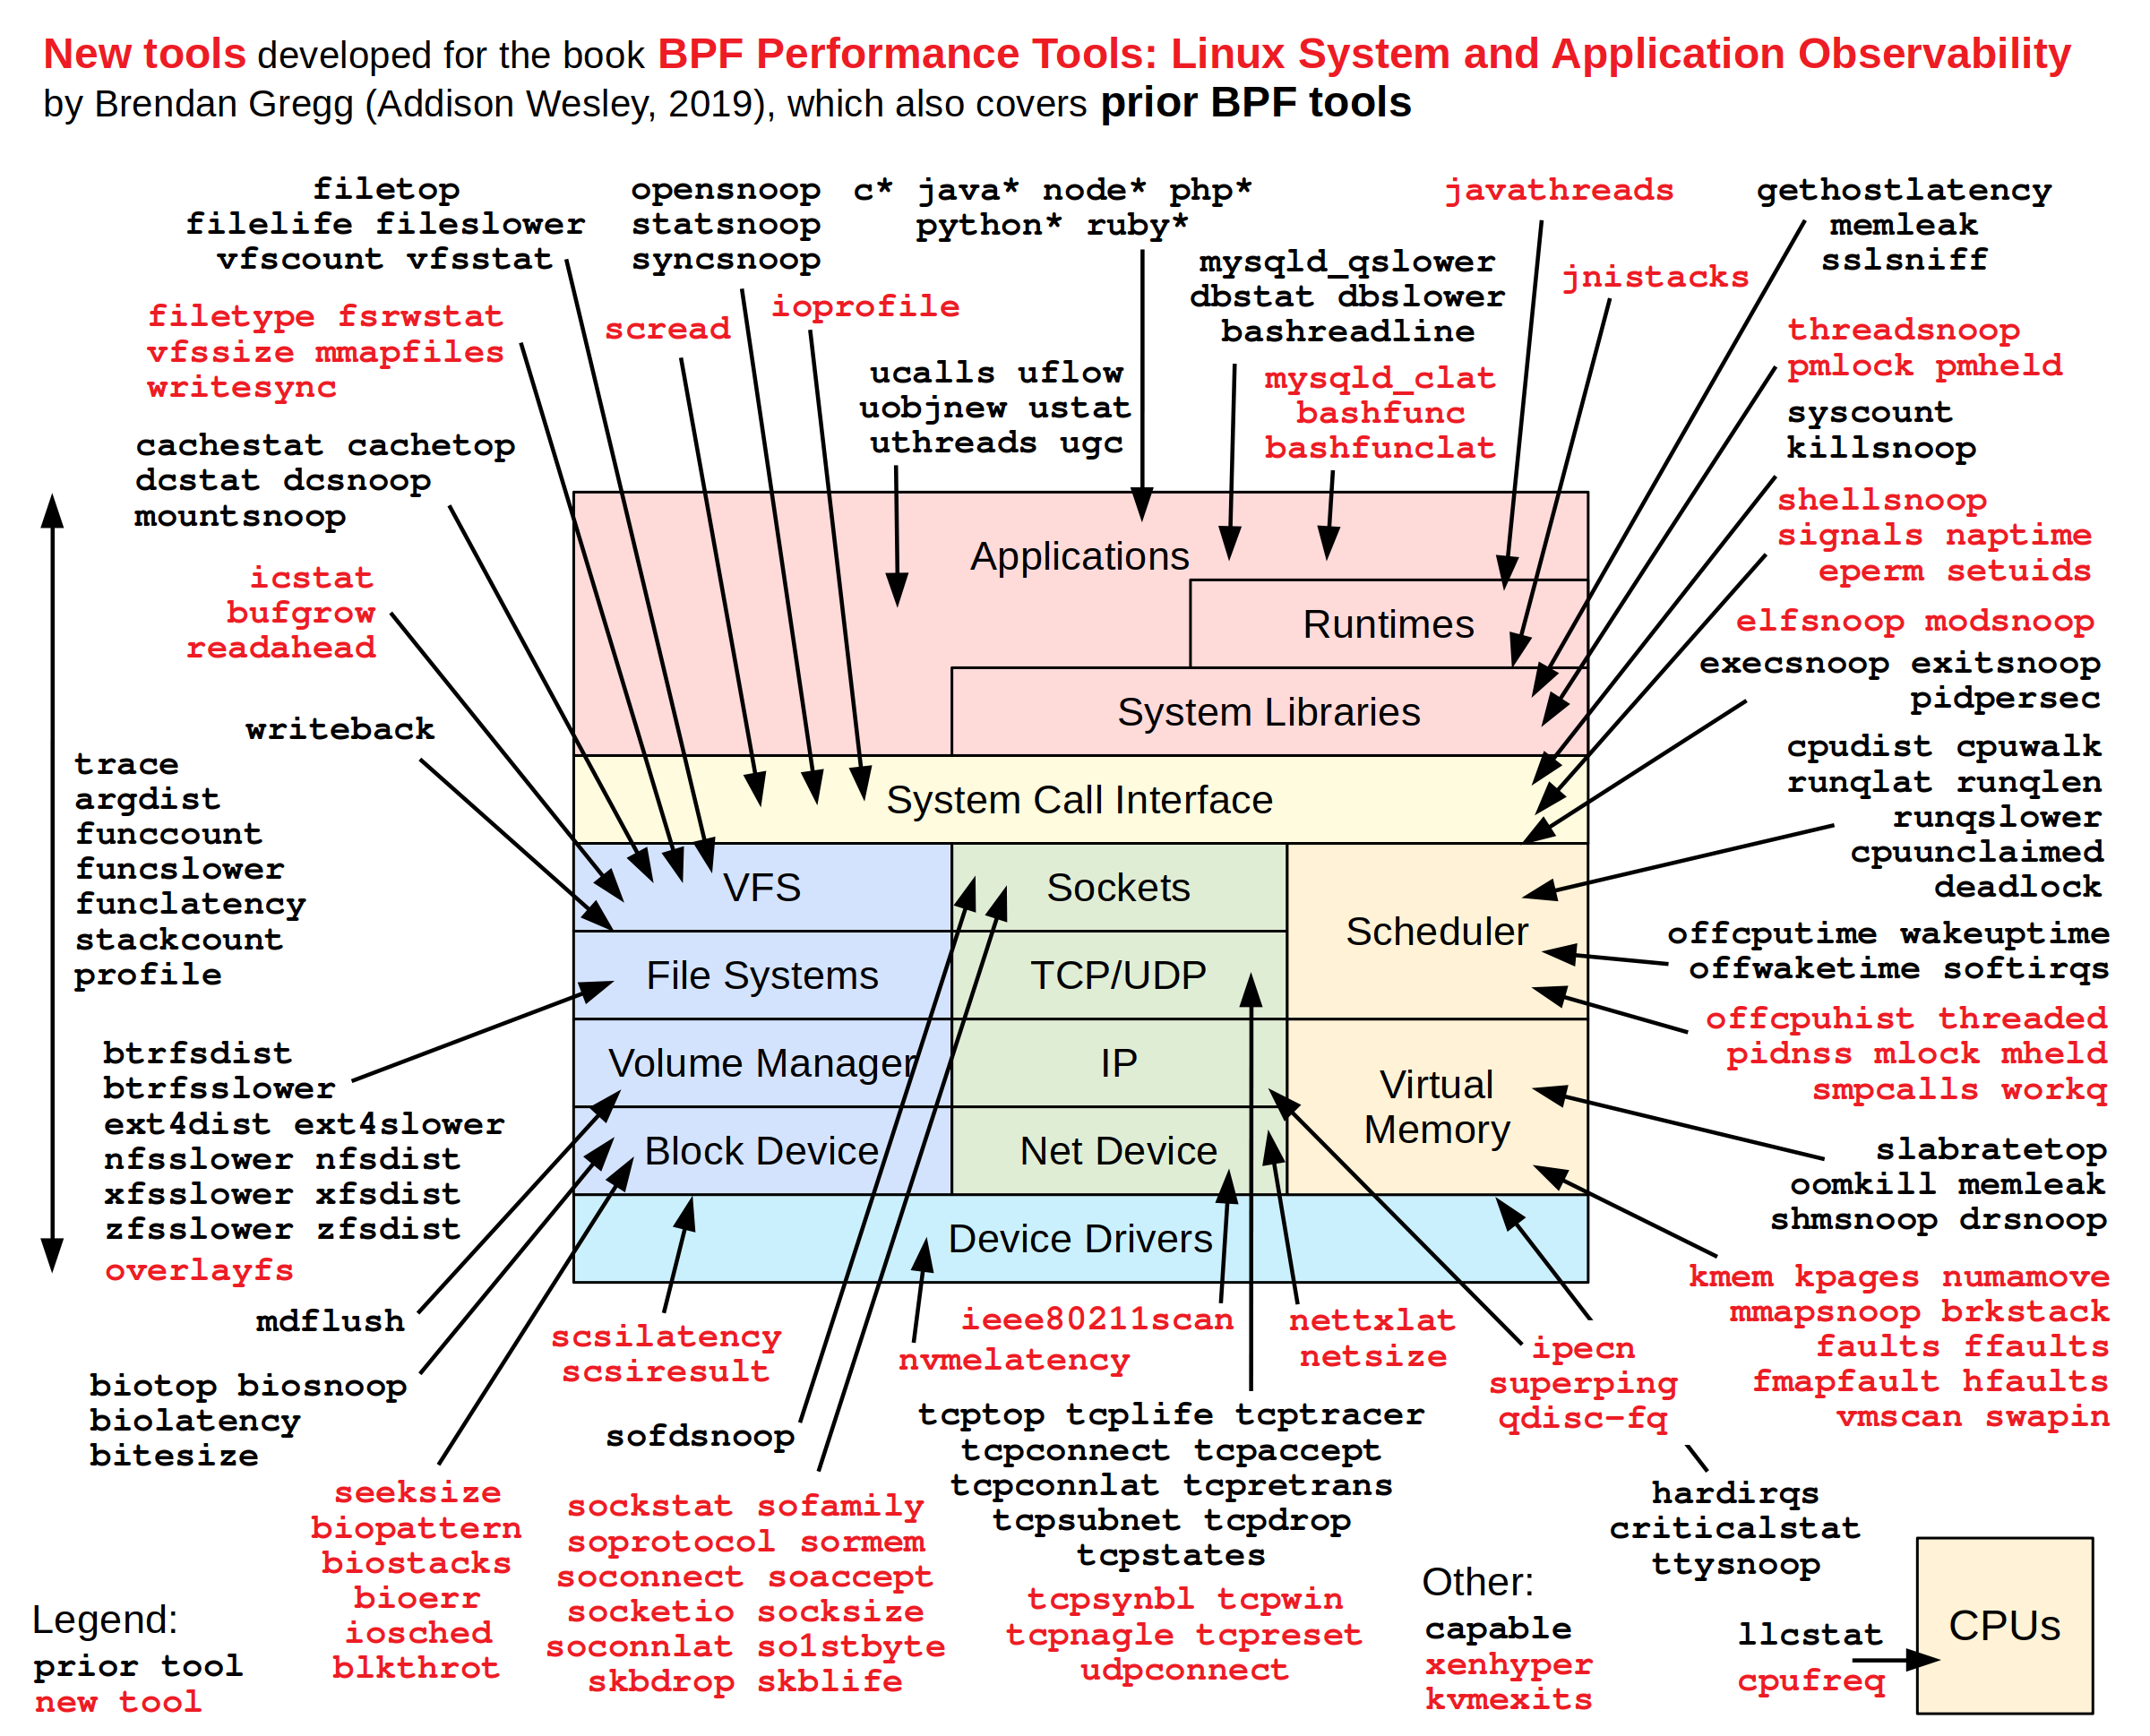
This diagram is an application scenario of linux analysis tools from Brendan Gregg, and you can see that it includes almost every part of the system that should be analyzed with the tools.
Linux Perf Tool
Allows the system to perform analysis
In order to be able to analyze it properly, we first need to turn on the debugging features of the system, allowing us to access other processes.
SysCtl
Newer Linux kernels have the sysfs adjustable parameter /proc/sys/kernel/perf_event_paranoid, which allows the user to adjust the functions available to non-root users of perf_events by a larger amount to be more secure (and accordingly provide fewer functions).
The default value is to not allow access to any information, so we need to change it to 1 or 0 to allow us to access CPU event information.
Temporary Modification
Execute the command to write values directly to the kernel interface.
|
|
Permanent modification
Use sysctl to configure its value, create /etc/sysctl.d/50_perf_event_paranoid.conf file and write kernel.perf_event_paranoid=1 and execute sysctl -p to refresh the system configuration.
perf Sampling
There are three types of tools related to performance optimization, one is the sampling type, that is, sampling, this kind of tool is constantly “asking” the program what it is doing, perf in this mode we use is sampling mode, if it is tracking some event, it works in trace mode, actually is the second type of tool, this kind of tool mainly relies on the event or hook, the program in the process of running constantly active to tell the tool what it is doing, such as strace; the third is the instrument type, this kind of tool mainly relies on the compiler to tell the compiler what it is doing. In fact, this is the second type of tool, which relies mainly on events or hooks, where the program keeps telling the tool what it is doing during the run, such as strace; the third type is instrumentation, which relies mainly on the compiler for staking and knowing exactly what is being executed at the line of code level (see gcc instrumentation).
by hualet on deepin 15.7
Command Description.
perf can either start a program directly for analysis or use the -p parameter to specify a pid for sampling.
View sampling results for perf
When we finish sampling by perf record, the perf.data file will be generated in the execution directory, and then we can use the perf report command to analyze the data file.
|
|
perf report will automatically open the perf.data file in the current directory, or you can specify the path to the perf.data file at the end.
perf report generates different graphs according to the -call-graph argument. With the dwarf argument, the graphs are displayed in the order of the function call stack, which makes it easy to see which function is taking longer to execute, since each sample falls on that function, which means that the function is taking a very long time to execute, and then the The depth of the call stack can be used to analyze what is being done during the execution of the function.
hotspot flame chart
It is not particularly convenient to view function calls at the command line, so there are graphical tools used to easily view the generated results of the perf tool, which is more friendly to use is the hotspot tool developed by kde, the tool can directly open the perf.data file and generate the corresponding flame diagram, the flame diagram is another form of expression of function calls, the higher the flame, it also The higher the flame means the deeper the call stack is, and the wider the flame means the function takes a long time to execute.