Kubevious is an open source Kubernetes Dashboard, but it’s not quite the same as our mainstream Dashboard, it’s very unique, it has all the configuration related to the application in one place, which saves the operator’s time. The main thing is that it has a Time Machine feature that allows us to go back in time to see the application error messages.
Features
Most of the Kubernetes Dashboard features are pretty much the same, so what features does Kubevious have?
An application-centric visualization
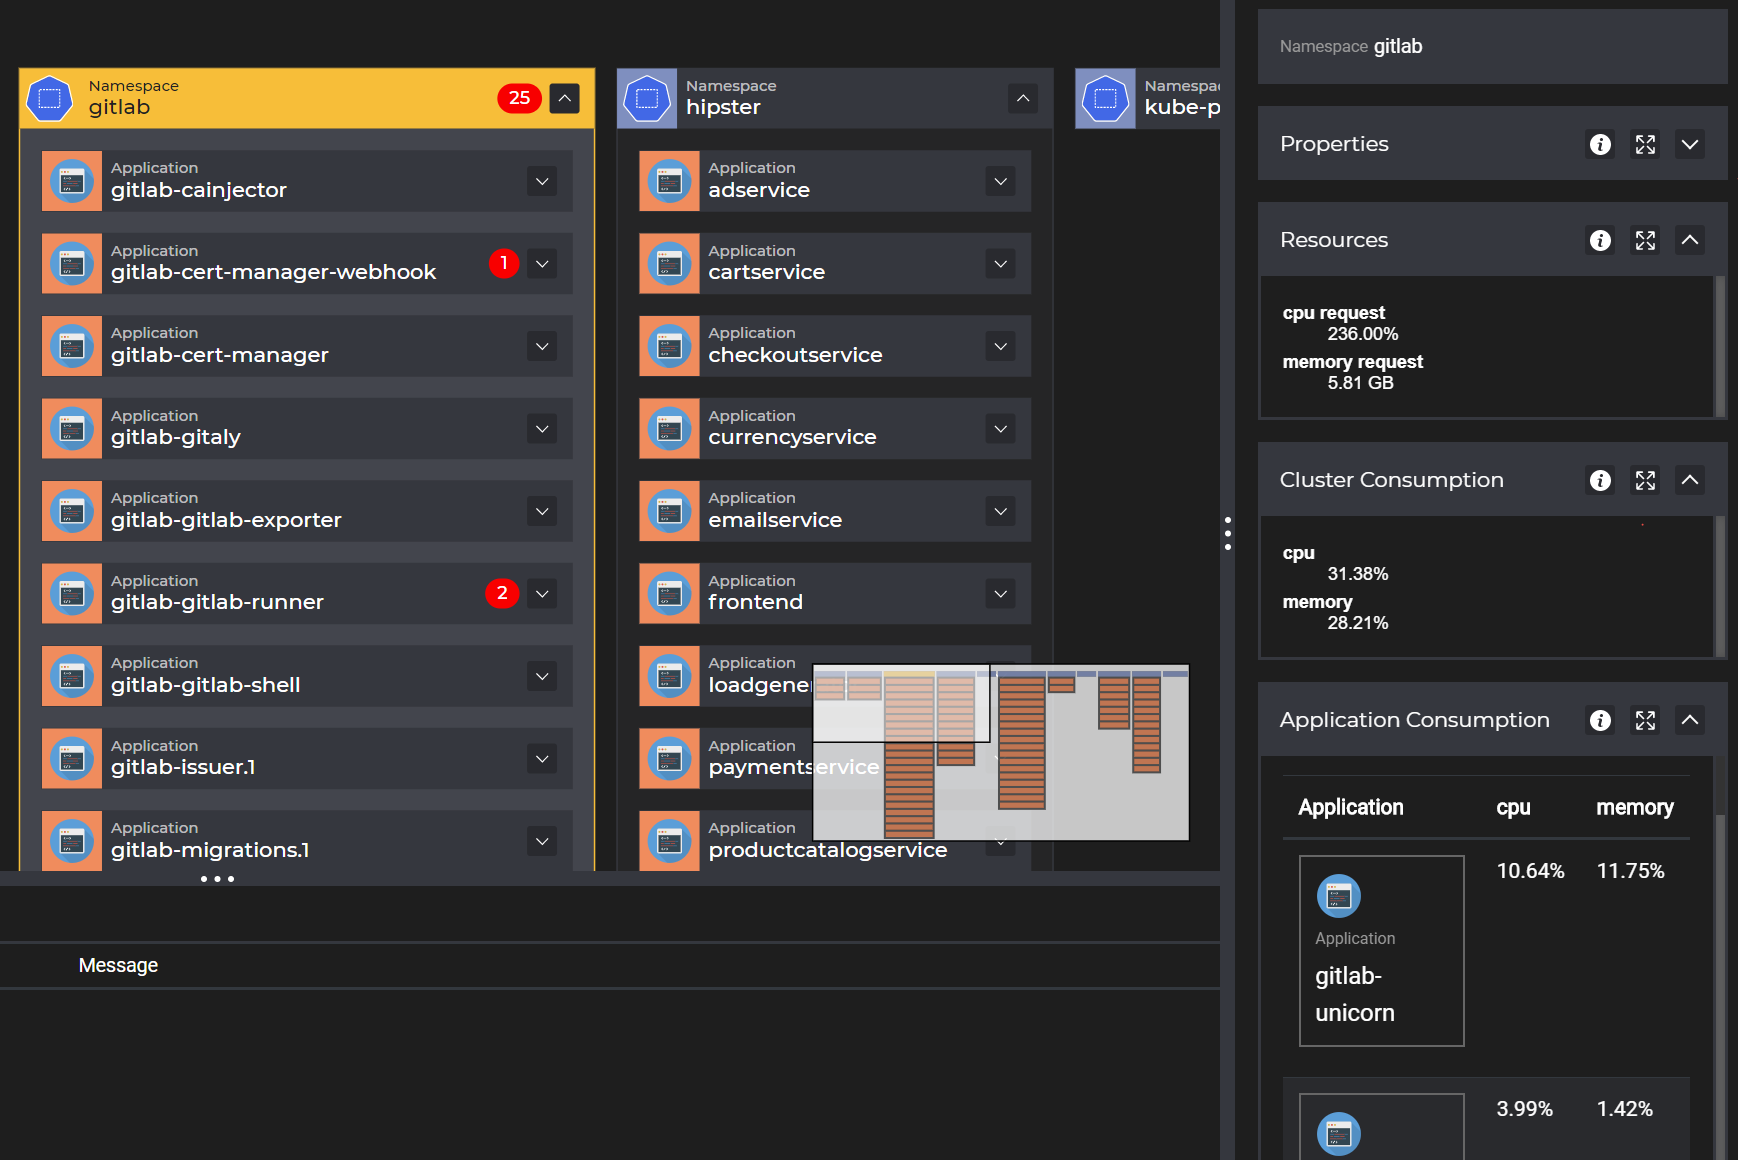
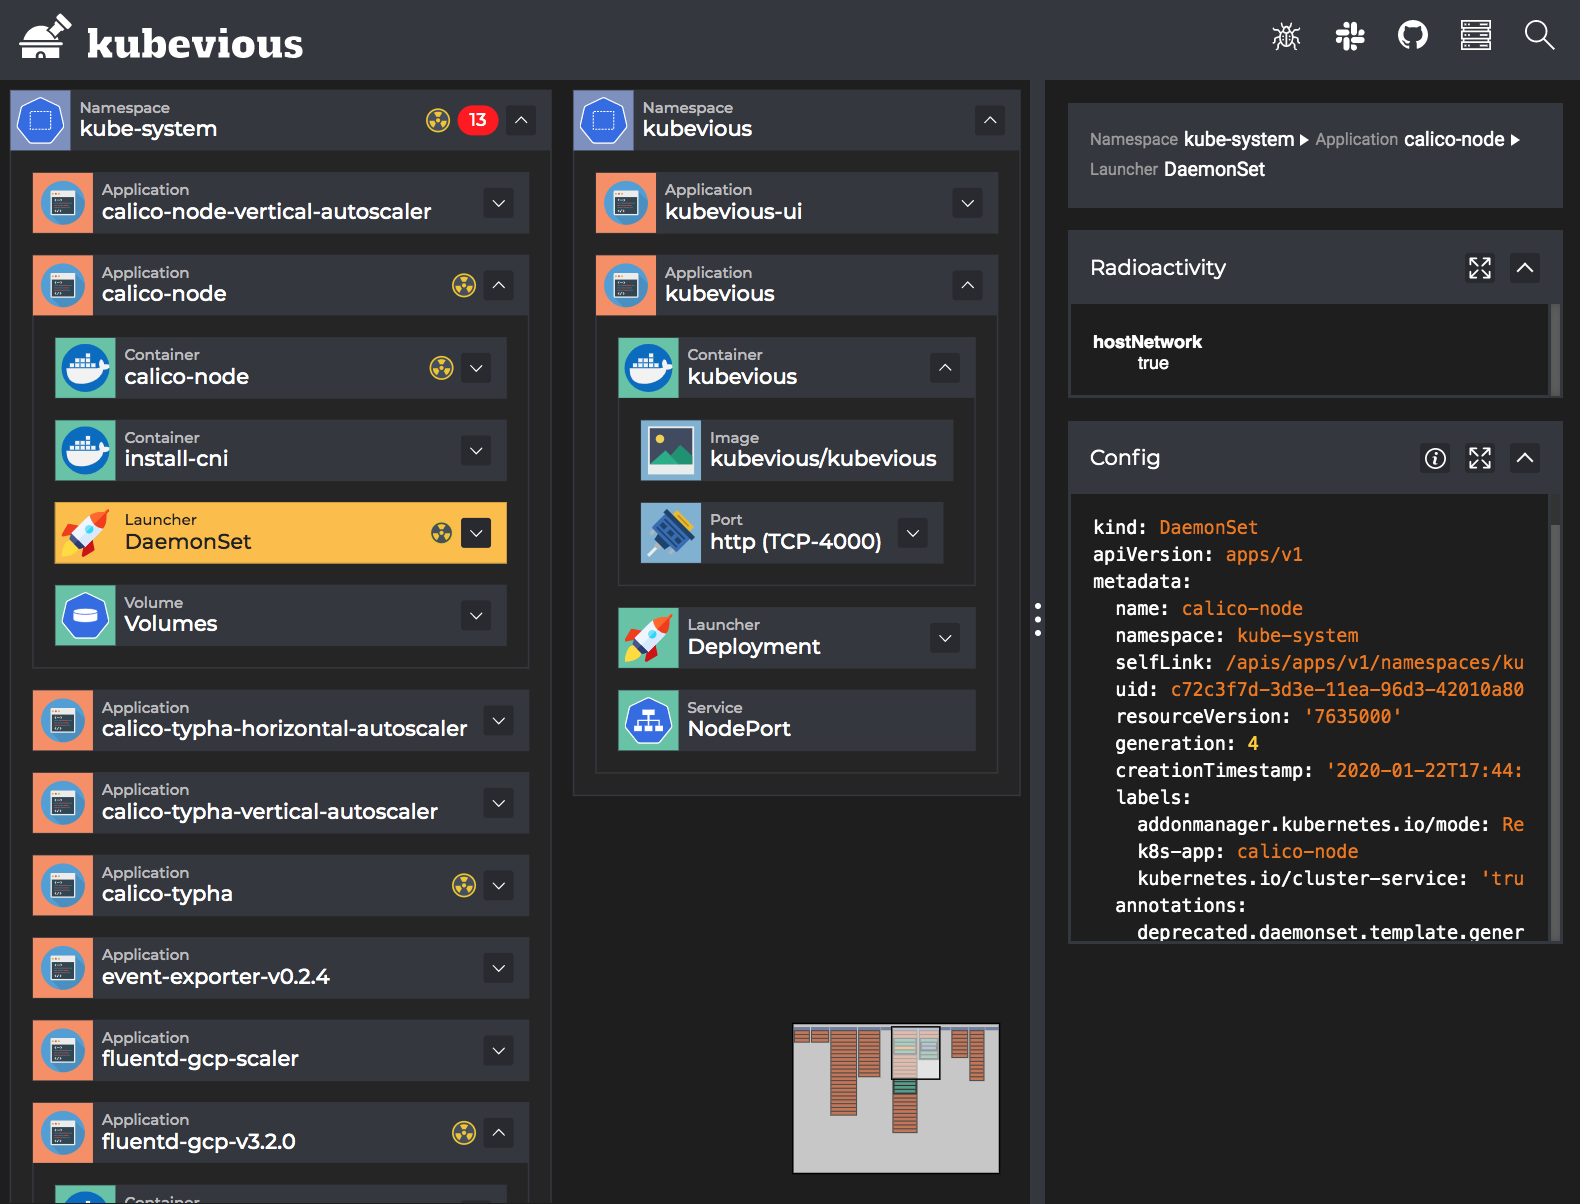
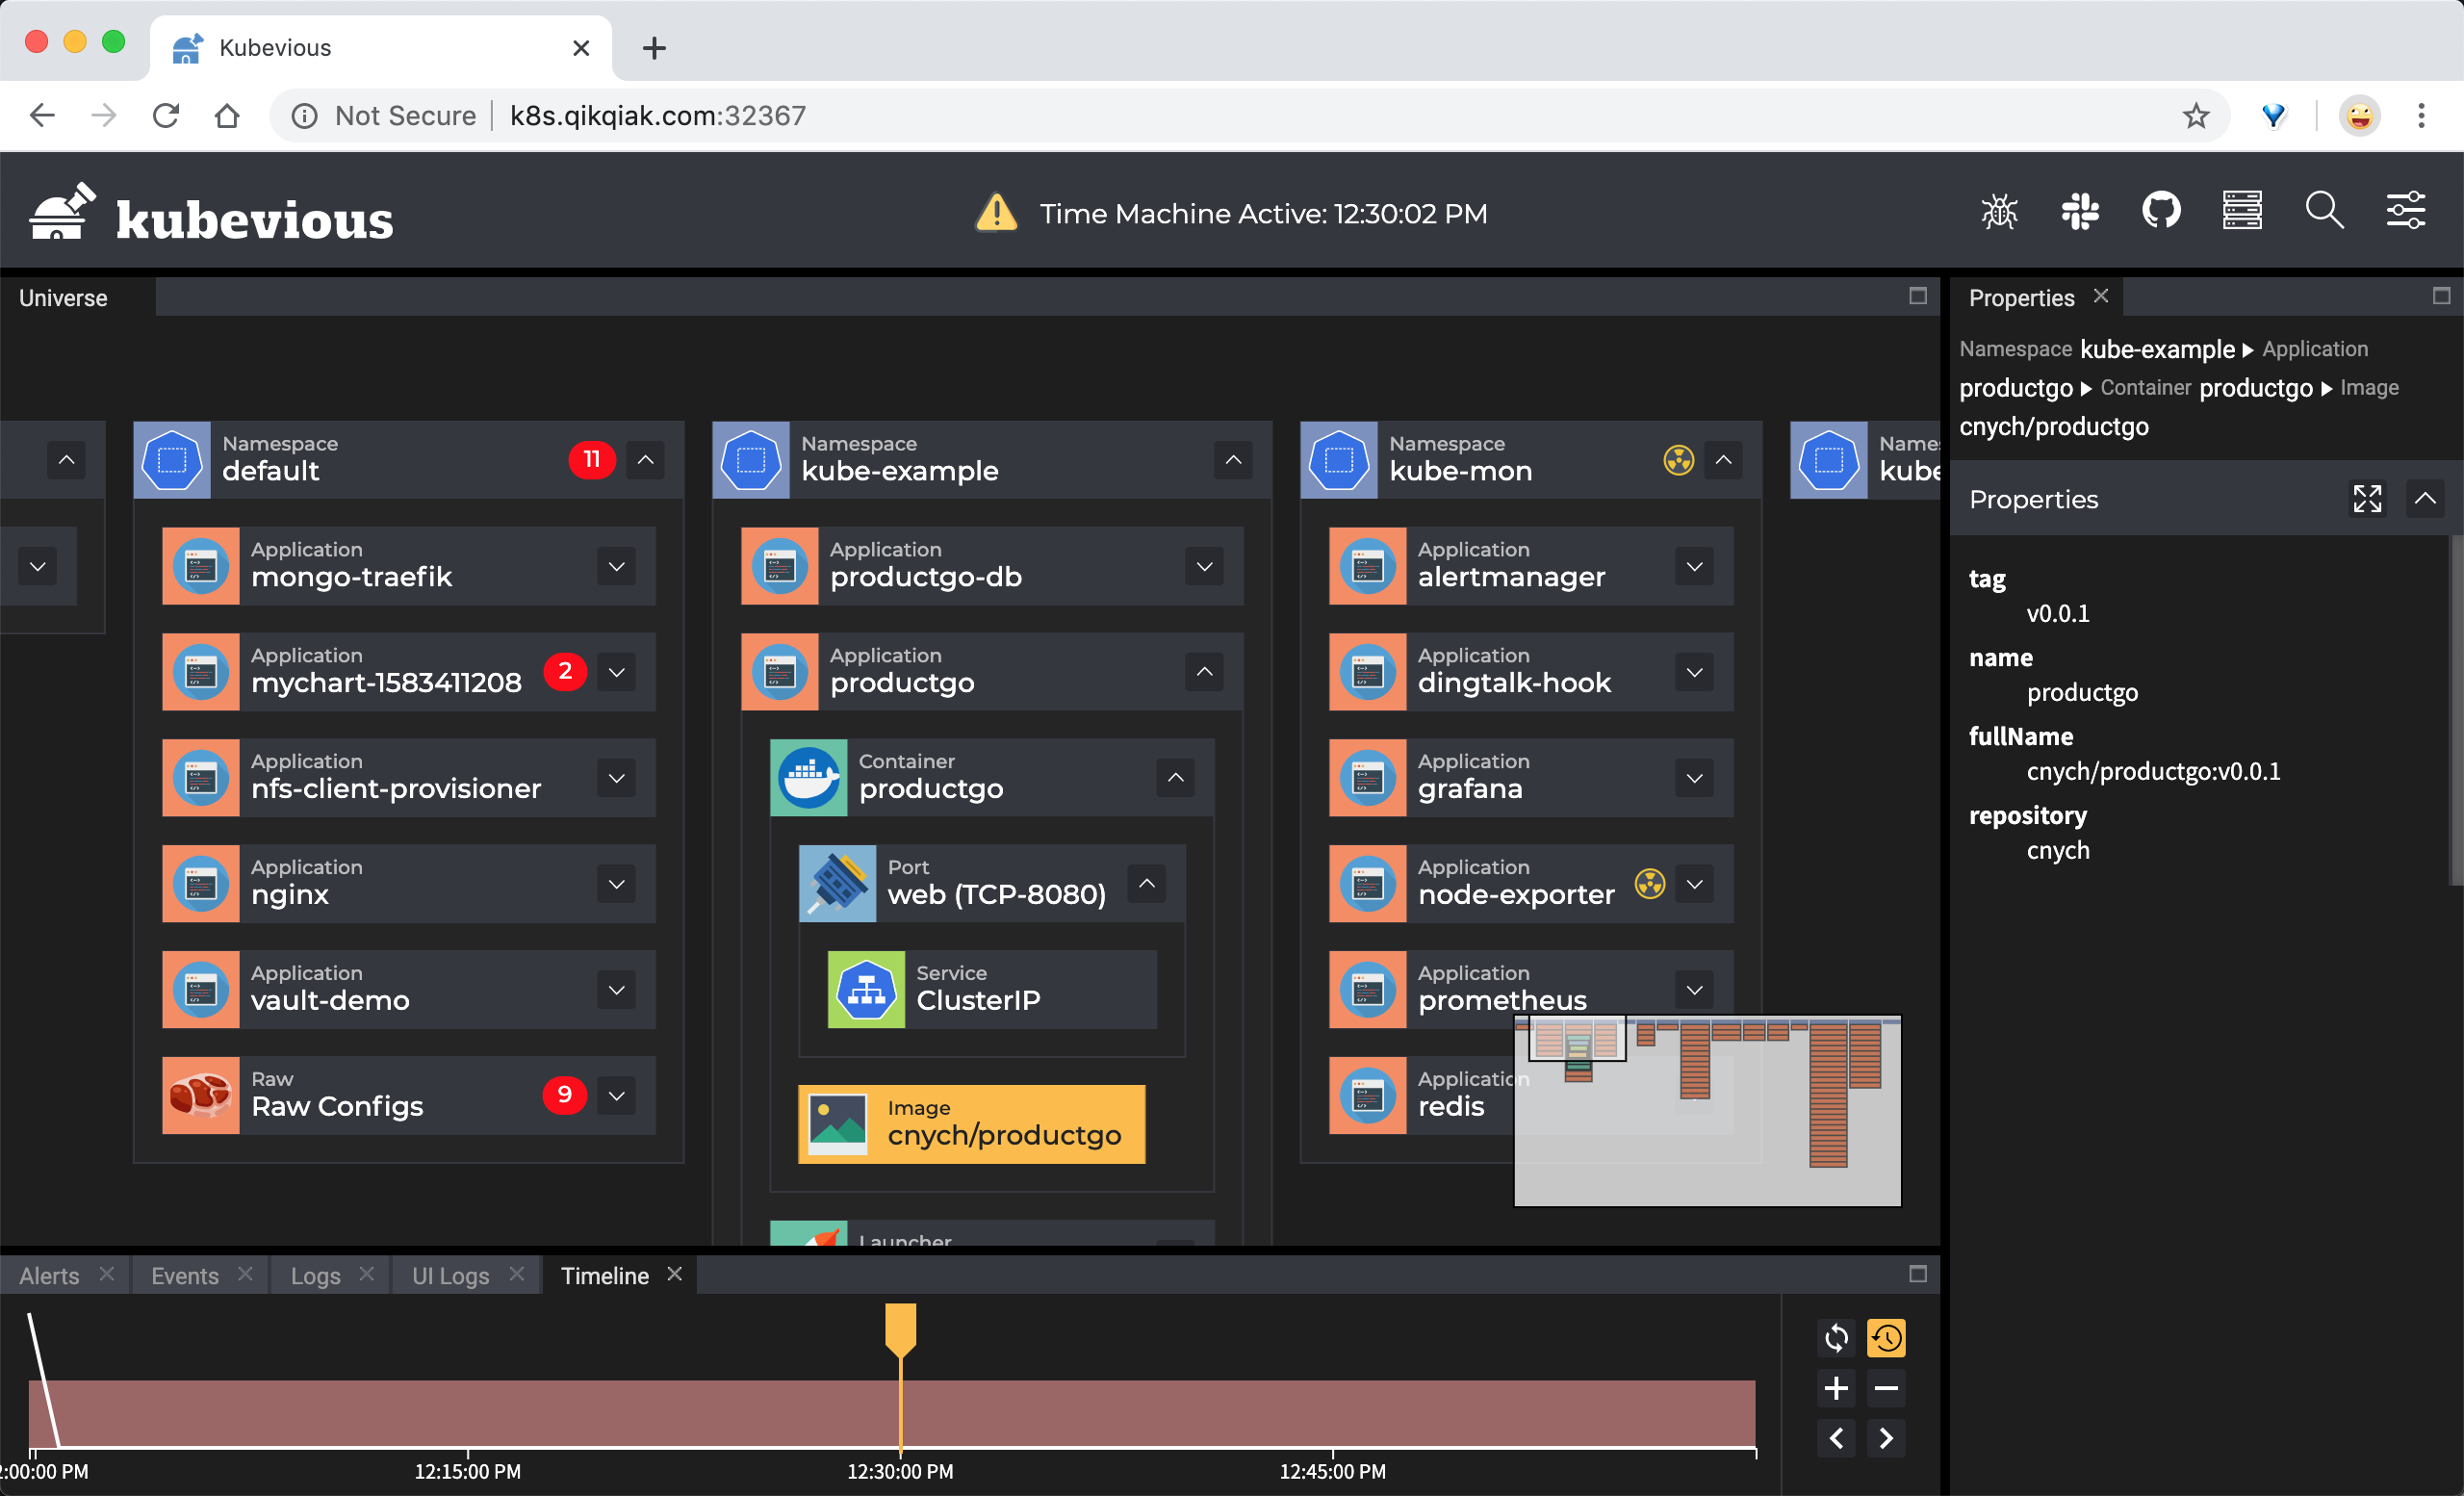
We know that even a simple Hello World application in Kubernetes will generate many resource objects, and it is relatively troublesome to get the configuration related to the application. Deployments, ReplicaSets, Pods, Services, Ingresses, Volumes, ConfigMaps, and other resource objects are identified and displayed together with a Box for the application.
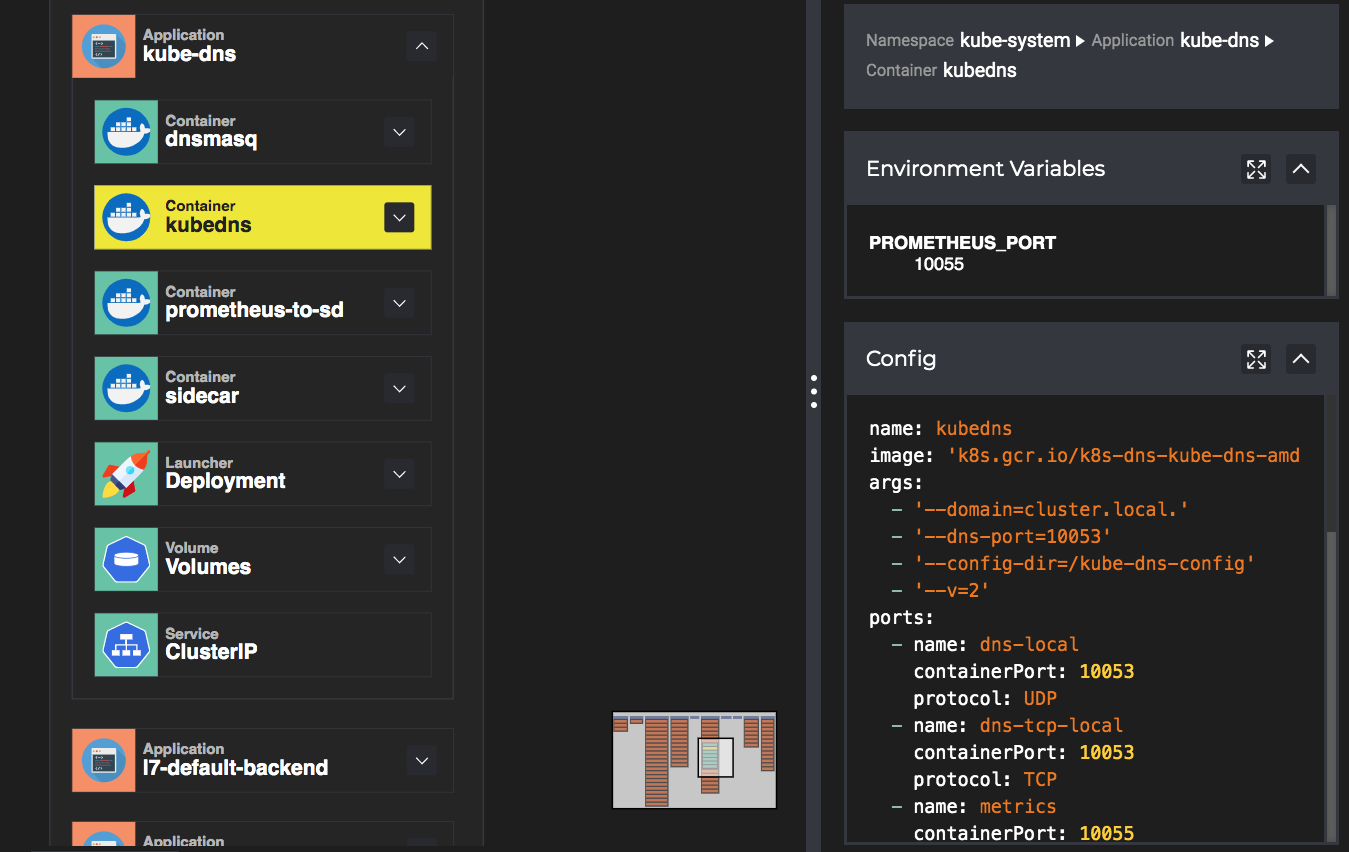
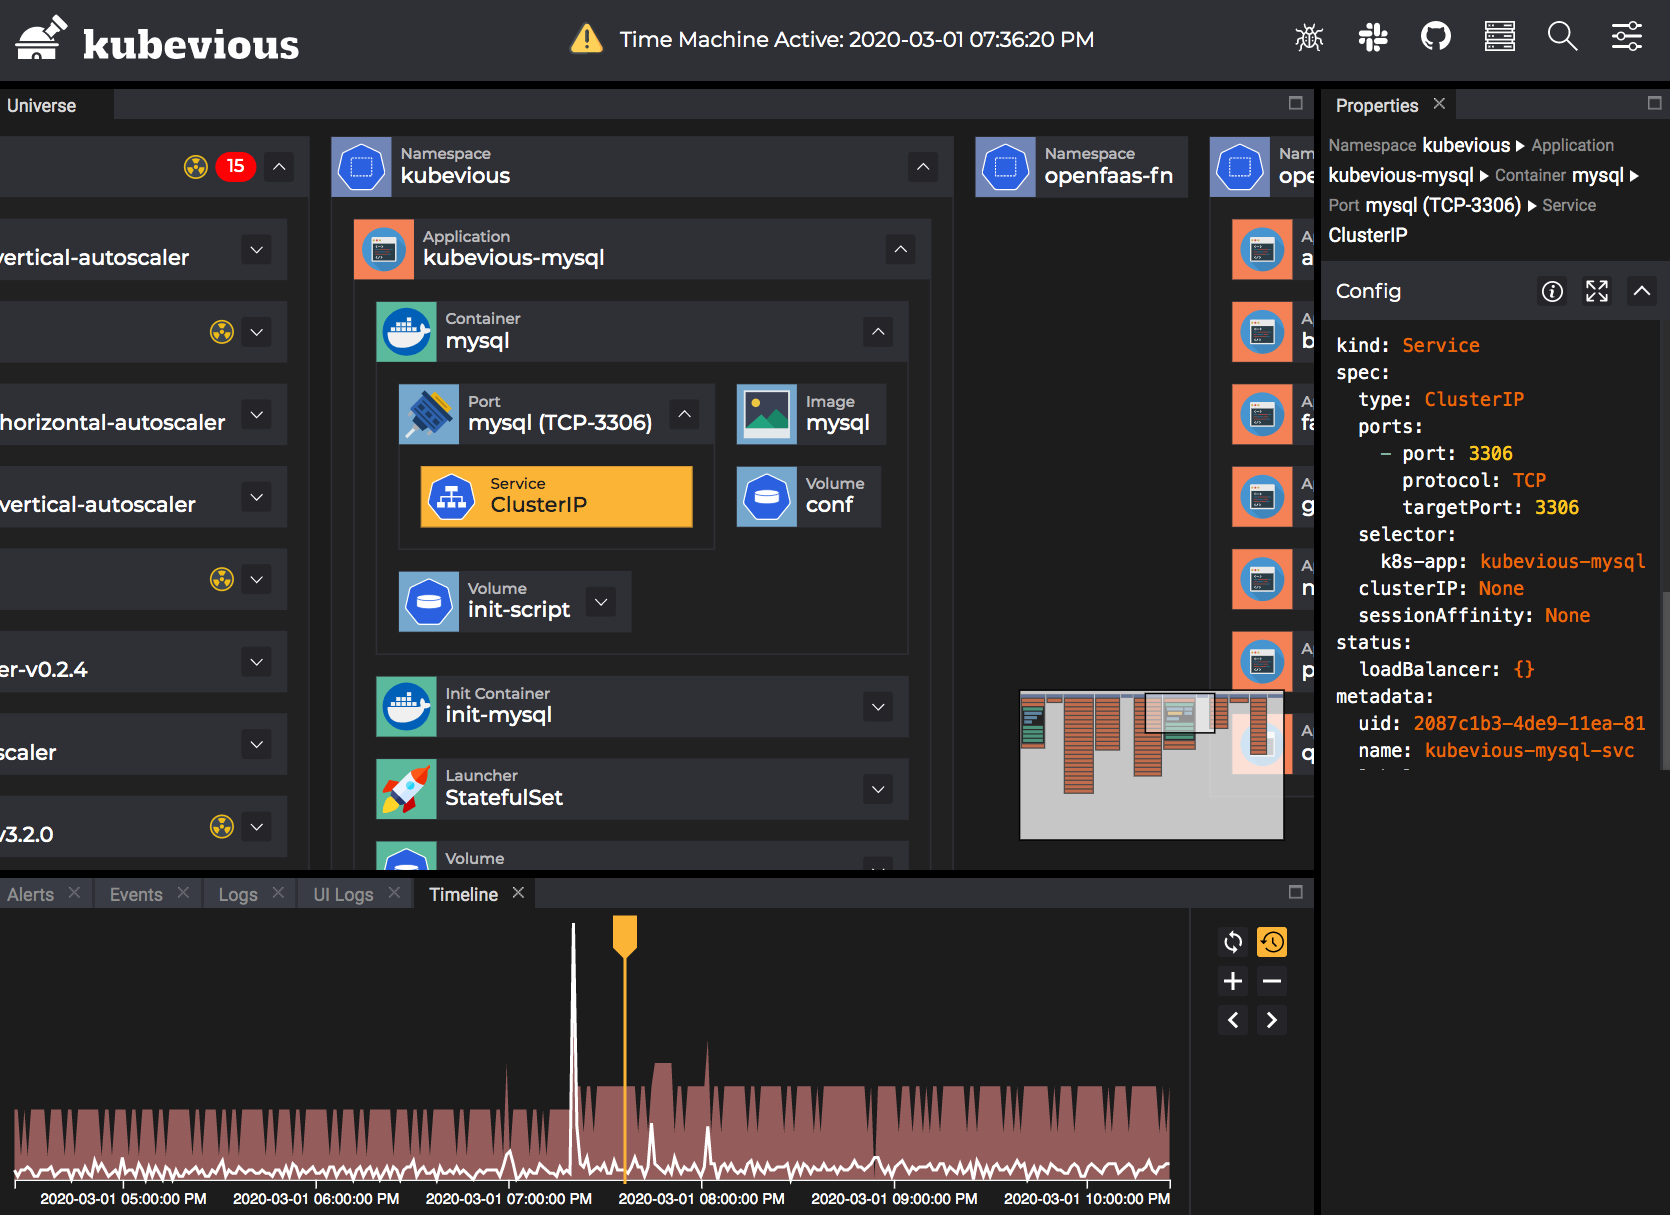
The main screen is rendered using a number of Boxes, each of which can be selected or expanded by double-clicking on it, and the properties and configurations associated with each Box are displayed in the right-hand panel.
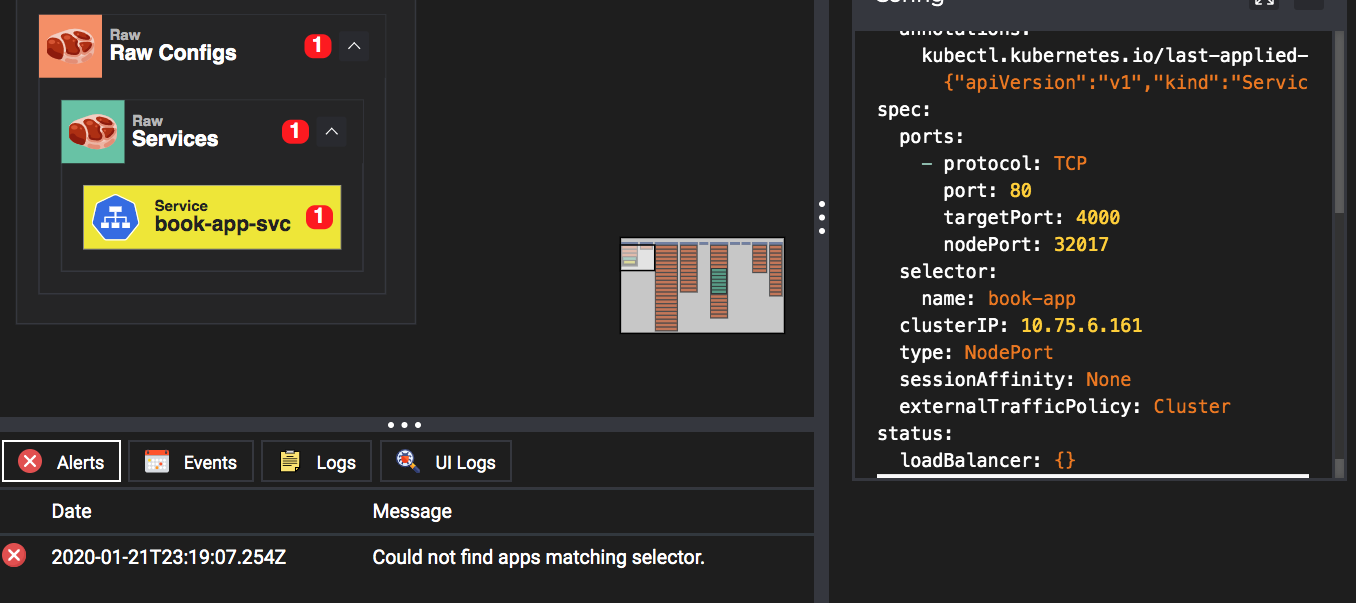
Misconfiguration detection
Kubernetes components and resource objects are configured independently, so there is a high probability that something like a spelling error will occur when using the component. kubevious identifies many errors, such as label errors, missing ports, etc. The red circles contain the number of errors within the child nodes.
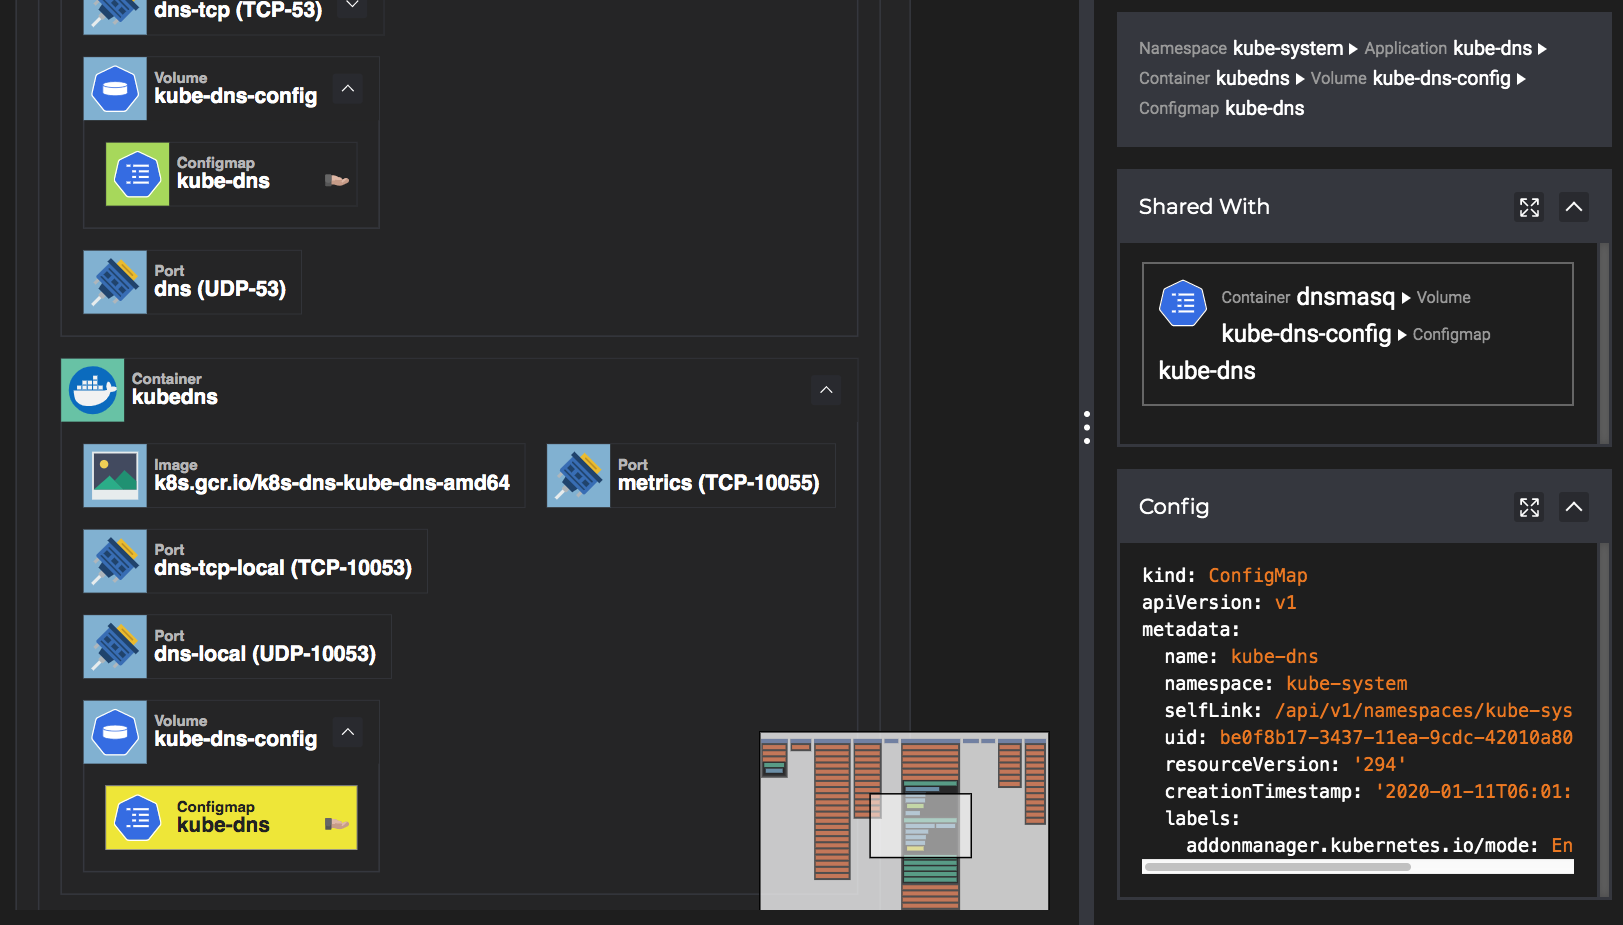
Identifying Cascading Configurations
Configuration in Kubernetes is highly reusable, and small changes can have unintended consequences. kubevious can identify shared configuration and display other slave objects so that it can be seen at a glance, ensuring the cascading effect of changes.
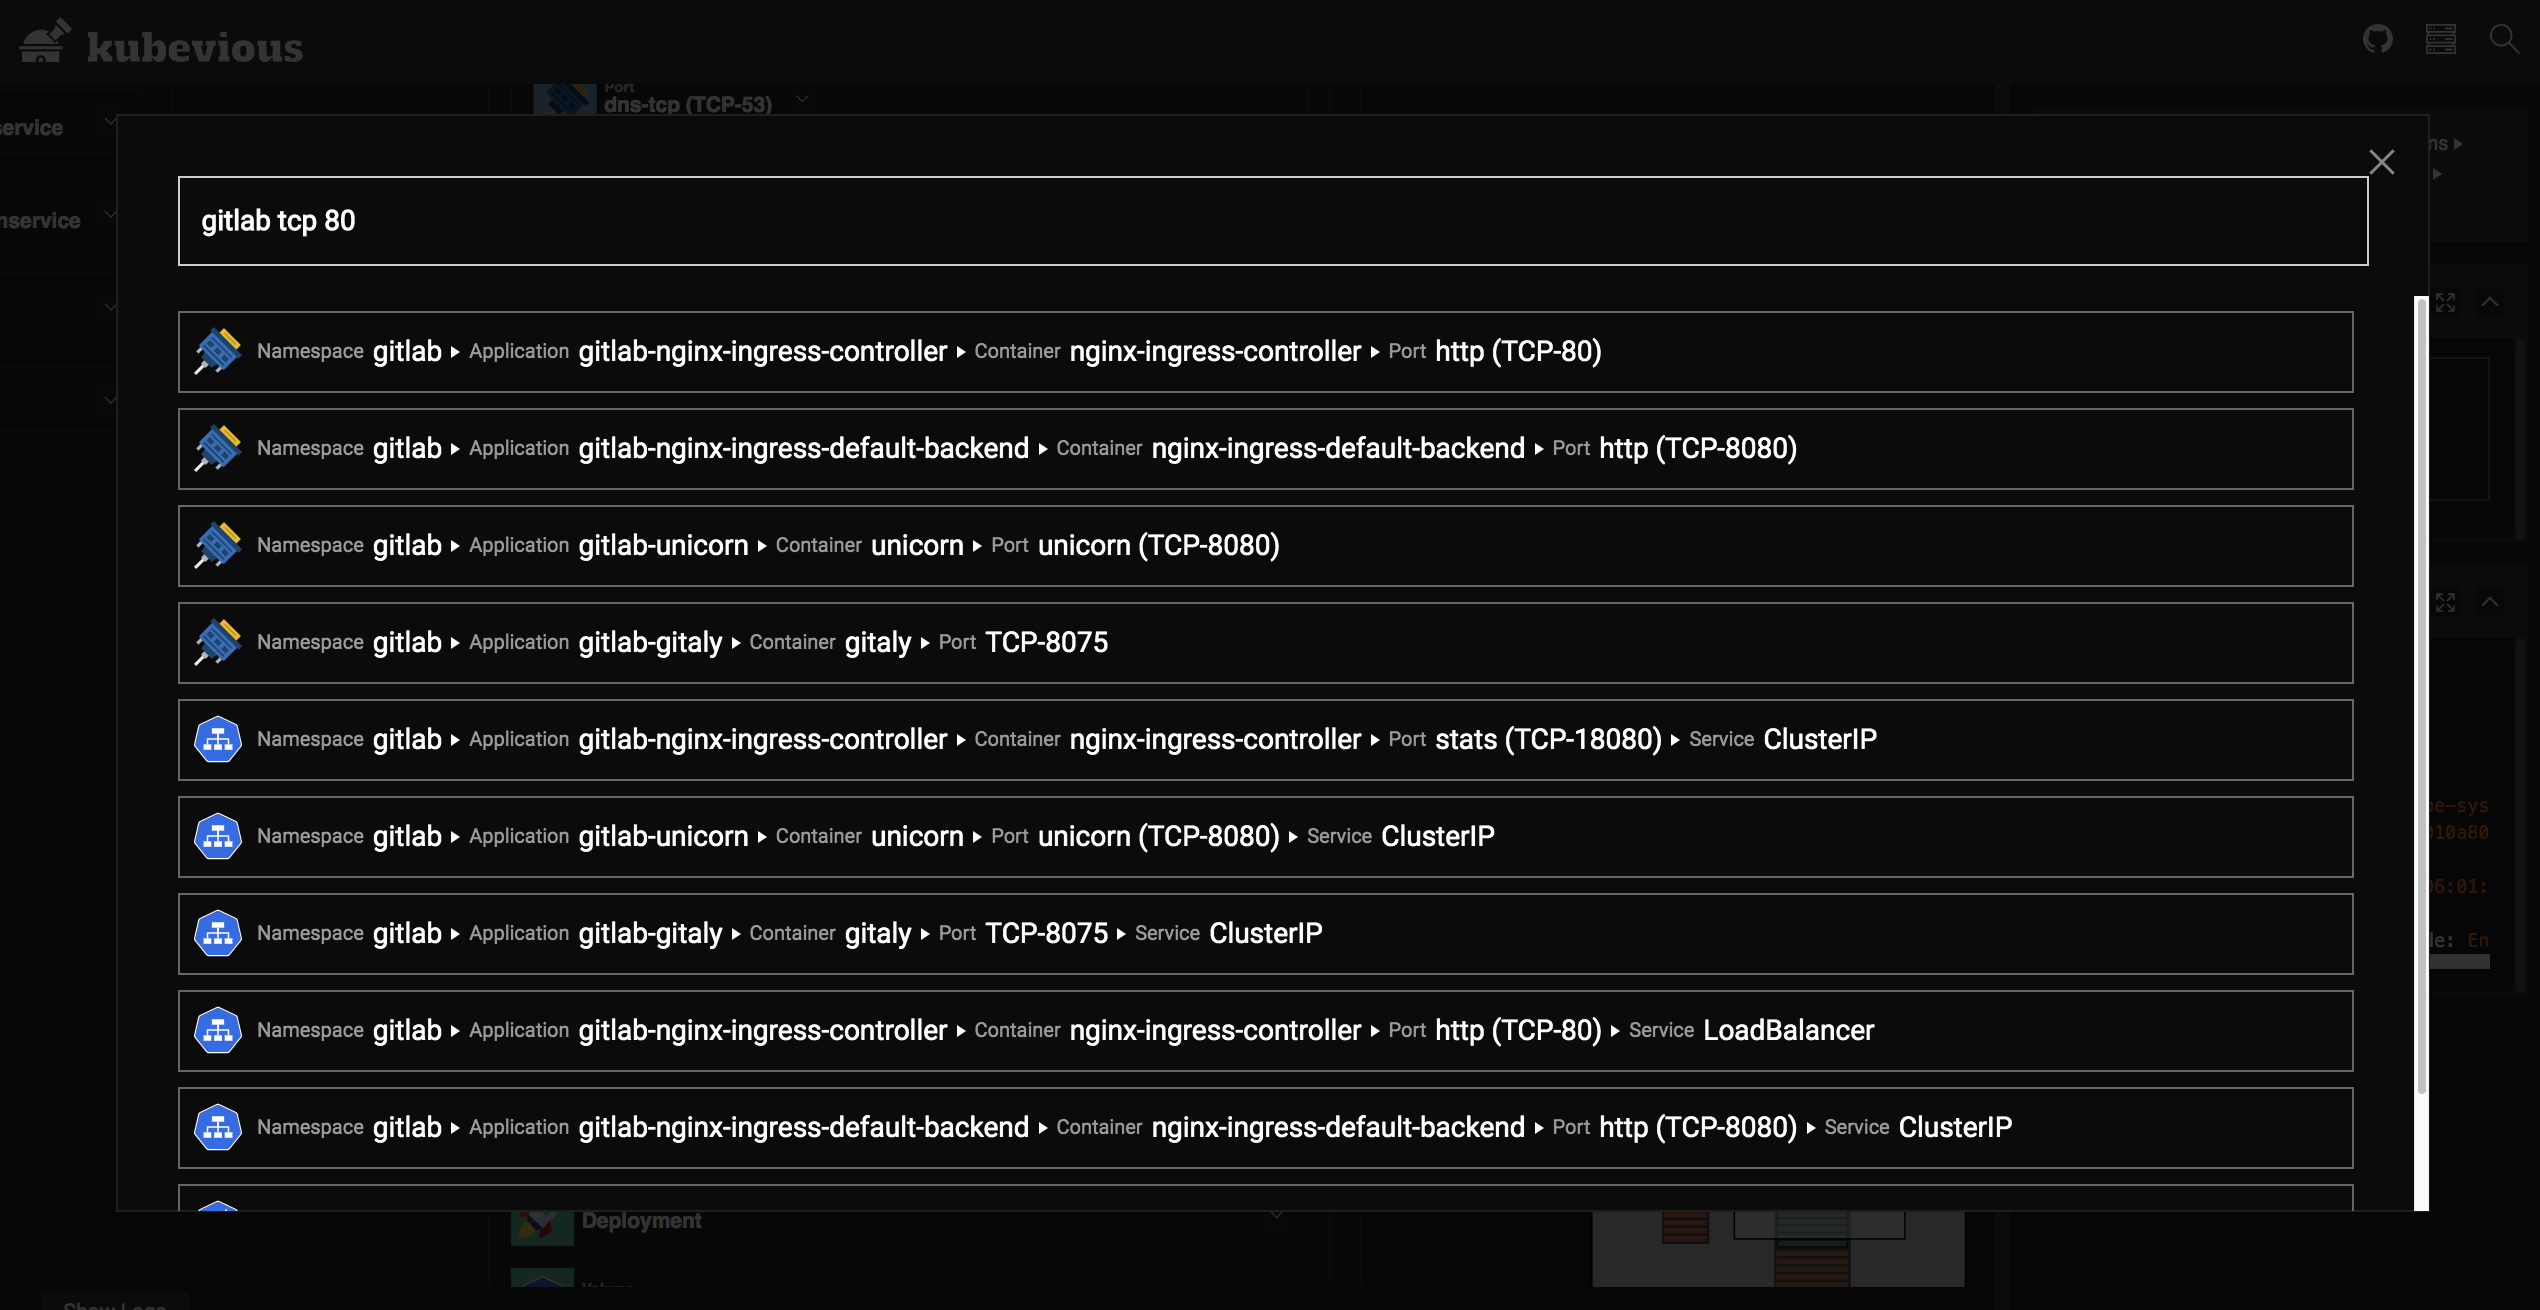
Support for full-text search
When there are so many objects in a Kubernetes cluster, it can be time-consuming to find a specific configuration, and Kubevious is all about supporting full-text search for the entire cluster.
Capacity Planning and Resource Usage Optimization
Kubevious clearly determines how many resources are used by each container, Pod, Deployment, DaemonSet, namespace, etc. Directly from Kubevious, Kubevious presents not only the absolute resource request values, but also the relative usage per node, namespace, and cluster as a whole. Determine which applications are taking up most of the resources in the namespace.
Permission marking
Kubevious marks applications and their corresponding namespaces as radioactive, specifically it checks for privileged containers, hostPID, hostNetwork, hostIPC, etc. flags, and mount to some sensitive host locations, such as docker.sock files, etc.
Time Machine
This is probably one of the most interesting features to me, because we know that it’s very difficult to keep track of the various issues with an application as it changes constantly, and Kubevious allows us to go back to a previous point in time to see the configuration and error messages of the application through the time machine feature.
Installation
Kubevious can be installed on any Kubernetes discovery release, and can be installed quickly using Helm, which can be viewed in our previous article on the subject.
Rendering the Chart template directly into a Kubernetes resource object, the rendered resource object will need some minor changes. Since Kubevious relies on MySQL, the best way to provide a storage for MySQL is to provide an available StorageClass object in volumeClaimTemplates so that the PV can be created automatically, and then just create the resource object above.
|
|
During the installation process, there may be a problem that the database and database tables are not created automatically, we can enter the database and create the database manually, then execute the SQL statement under kubevious-mysql-init-script ConfigMap once to create the tables manually. If you encounter problems connecting to the database with permissions, you can also log in to the database and reconfigure the permissions:
|
|
After the normal installation is complete we can view the corresponding resource objects.
|
|
By default, a Service of type NodePort is created, so that we can access Kubevious via http://<nodeIP:32367>.
But Kubevious also has a relatively large defect is the use of MySQL database to do the cluster snapshot, for small-scale clusters is not a big problem, for large-scale clusters should be performance and capacity will slowly become a bottleneck, after all, the project is still in the early stages, the future is still promising.