There are three main types of elastic scaling in Kubernetes: HPA, VPA, and CA. Here we will focus on Pod Horizontal Scaling HPA.
With the release of Kubernetes v1.23, the HPA API came to a stable version autoscaling/v2:
- Scaling based on custom metrics
- Scaling based on multiple metrics
- Configurable scaling behaviour
From the initial v1 version of HPA, which only supported CPU and memory utilisation scaling, to the later support for custom metrics and aggregation layer APIs, to v1.18, which added support for configurable scaling behaviour, HPA has become more and more usable and reliable.
Scaling on CPU or memory metrics is not used by all systems and does not appear to be as reliable. For most web backend systems, elastic scaling based on RPS (requests per second) to handle bursts of traffic is more reliable.
Prometheus is a popular open source monitoring system that provides access to real-time traffic load metrics, so today we’ll be trying out a custom metric based on Prometheus for elastic scaling.
Note: The current HPA scale to 0 requires the alpha version of HPAScaleToZero to be turned on at the feature gate and an object or external metric to be configured. Even if it is turned on, the scaling from 0 to 1 requires scheduling, IP allocation, mirror pulling, etc., which has some overhead. How to reduce this overhead is not covered here, but will be added in a subsequent article.
All code used in the article can be downloaded from here.
Overall architecture
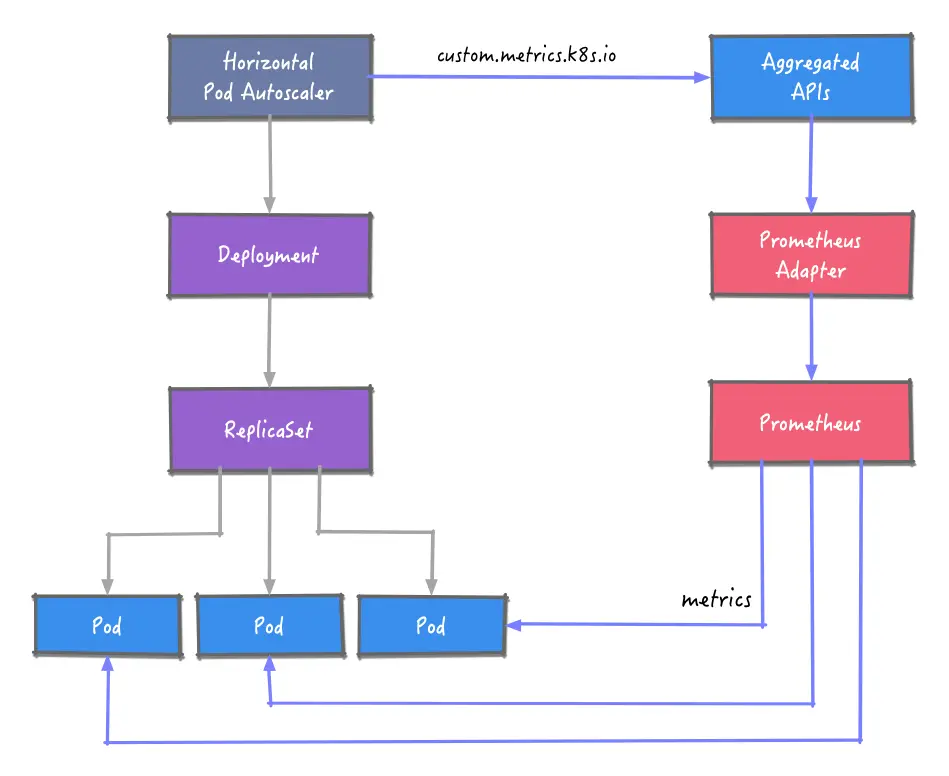
The HPA is to obtain metrics data from Prometheus. Here the Prometheus Adapter component is introduced, which implements the resource metrics, custom metrics and external metrics APIs APIs and supports autoscaling/v2 HPAs.
Once the metrics data is obtained, the number of examples of workloads is adjusted according to predefined rules.
Environment build
K3s
We use the latest 1.23 version of K3s as our Kubernetes environment.
1
2
|
export INSTALL_K3S_VERSION=v1.23.1+k3s2
curl -sfL https://get.k3s.io | sh -s - --write-kubeconfig-mode 644 --write-kubeconfig ~/.kube/config
|
Example application
We prepare a simple web application that records the number of requests and outputs the metric http_requests_total in Prometheus format via the /metrics endpoint.
 1
 2
 3
 4
 5
 6
 7
 8
 9
10
11
12
13
14
15
16
17
18
19
20
21
22
23
24
|
func main() {
	metrics := prometheus.NewCounterVec(
		prometheus.CounterOpts{
			Name:        "http_requests_total",
			Help:        "Number of total http requests",
		},
		[]string{"status"},
	)
	prometheus.MustRegister(metrics)

	http.HandleFunc("/", func(w http.ResponseWriter, r *http.Request) {
		path := r.URL.Path
		statusCode := 200
		switch path {
		case "/metrics":
			promhttp.Handler().ServeHTTP(w, r)
		default:
			w.WriteHeader(statusCode)
			w.Write([]byte("Hello World!"))
		}
		metrics.WithLabelValues(strconv.Itoa(statusCode)).Inc()
	})
	http.ListenAndServe(":3000", nil)
}
|
Deploying applications to clusters.
1
|
kubectl apply -f kubernetes/sample-httpserver-deployment.yaml
|
Prometheus
To install Prometheus using Helm, first add the chart repository for prometheus.
1
|
helm repo add prometheus-community https://prometheus-community.github.io/helm-charts
|
Only prometheus-server is used for this test, and other components are disabled during installation. Also, to demonstrate the effectiveness of the effect, the pull interval of the indicator is set to 10s.
1
2
3
|
# install prometheus with some components disabled
# set scrape interval to 10s
helm install prometheus prometheus-community/prometheus -n default --set alertmanager.enabled=false,pushgateway.enabled=false,nodeExporter.enabled=false,kubeStateMetrics.enabled=false,server.global.scrape_interval=10s
|
Port forwarding allows web pages to be accessed in a browser.
1
2
|
# port forward
kubectl port-forward svc/prometheus-server 9090:80 -n prometheus
|
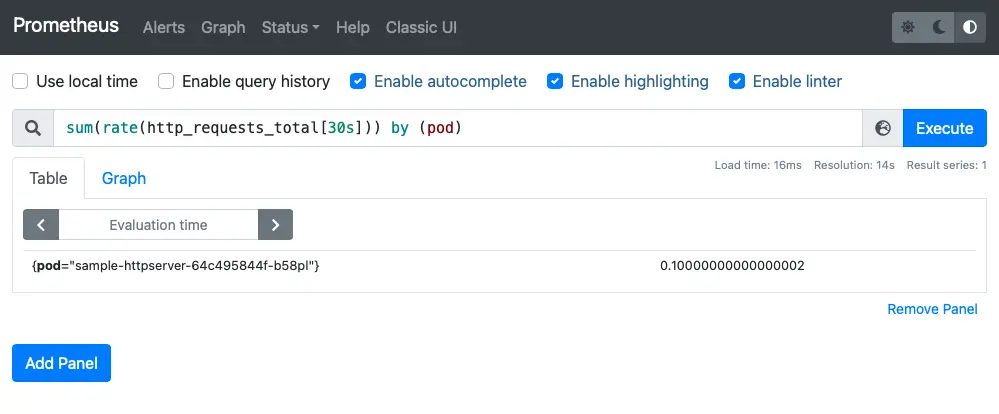
Here the RPS of the Pod is queried using the sum(rate(http_requests_total[30s])) by (pod) statement.
Prometheus Adapter
The Produmetheus Adapter is also installed using Helm, with additional configuration here.
1
|
helm install prometheus-adapter prometheus-community/prometheus-adapter -n default -f kubernetes/values-adapter.yaml
|
In addition to configuring how the Prometheus server is accessed, it is also important to configure the rules for calculating custom metrics, telling the adapter how to get the metrics from Prometheus and calculate the metrics we need.
 1
 2
 3
 4
 5
 6
 7
 8
 9
10
11
12
|
rules:
  default: false
  custom:
   - seriesQuery: '{__name__=~"^http_requests.*_total$",container!="POD",namespace!="",pod!=""}'
     resources:
       overrides:
         namespace: { resource: "namespace" }
         pod: { resource: "pod" }
     name:
       matches: "(.*)_total"
       as: "${1}_qps"
     metricsQuery: sum(rate(<<.Series>>{<<.LabelMatchers>>}[30s])) by (<<.GroupBy>>)
|
You can refer to the detailed Adapter configuration.
After the promethues-adapter pod has successfully run, you can execute the custom.metrics.k8s.io request.
 1
 2
 3
 4
 5
 6
 7
 8
 9
10
11
12
13
14
15
16
17
18
19
20
21
22
|
kubectl get --raw '/apis/custom.metrics.k8s.io/v1beta1/namespaces/default/pods/*/http_requests_qps' | jq .
{
  "kind": "MetricValueList",
  "apiVersion": "custom.metrics.k8s.io/v1beta1",
  "metadata": {
    "selfLink": "/apis/custom.metrics.k8s.io/v1beta1/namespaces/default/pods/%2A/http_requests_qps"
  },
  "items": [
    {
      "describedObject": {
        "kind": "Pod",
        "namespace": "default",
        "name": "sample-httpserver-64c495844f-b58pl",
        "apiVersion": "/v1"
      },
      "metricName": "http_requests_qps",
      "timestamp": "2022-01-18T03:32:51Z",
      "value": "100m",
      "selector": null
    }
  ]
}
|
Note: Here value: 100m, the suffix “m” identifies milli-requests per seconds, so 100m here means 0.1/s 0.1 requests per second.
HPA
Finally, the configuration of the HPA is as follows
- the minimum and maximum number of replicas is set to 1 and 10 respectively
- to test the effectiveness of the effect, set the behavior of the scaling
behavior.
- specify the metric
http_requests_qps, the type Pods and the target value 50,000m: the average RPS per pod is 50. For example, with 300 RPS accesses, the number of replicas is 300/50=6.
 1
 2
 3
 4
 5
 6
 7
 8
 9
10
11
12
13
14
15
16
17
18
19
20
21
22
23
24
25
26
27
28
29
30
31
32
|
kind: HorizontalPodAutoscaler
apiVersion: autoscaling/v2
metadata:
  name: sample-httpserver
spec:
  scaleTargetRef:
    apiVersion: apps/v1
    kind: Deployment
    name: sample-httpserver
  minReplicas: 1
  maxReplicas: 10
  behavior:
    scaleDown:
      stabilizationWindowSeconds: 30
      policies:
        - type: Percent
          value: 100
          periodSeconds: 15
    scaleUp:
      stabilizationWindowSeconds: 0
      policies:
        - type: Percent
          value: 100
          periodSeconds: 15
  metrics:
    - type: Pods
      pods:
        metric:
          name: http_requests_qps
        target:
          type: AverageValue
          averageValue: 50000m
|
Testing
The test tool is vegeta because it can specify the RPS.
First create the NodePort service for the application.
1
2
3
4
5
|
kubectl expose deploy sample-httpserver --name sample-httpserver-host --type NodePort --target-port 3000

kubectl get svc sample-httpserver-host
NAME                     TYPE       CLUSTER-IP     EXTERNAL-IP   PORT(S)          AGE
sample-httpserver-host   NodePort   10.43.66.206   <none>        3000:31617/TCP   12h
|
Requests are initiated using RPS of 240, 120 and 40 respectively.
1
2
3
4
5
6
|
# 240
echo "GET http://192.168.1.92:31617" | vegeta attack -duration 60s -connections 10 -rate 240 | vegeta report
# 120
echo "GET http://192.168.1.92:31617" | vegeta attack -duration 60s -connections 10 -rate 120 | vegeta report
# 40
echo "GET http://192.168.1.92:31617" | vegeta attack -duration 60s -connections 10 -rate 40 | vegeta report
|
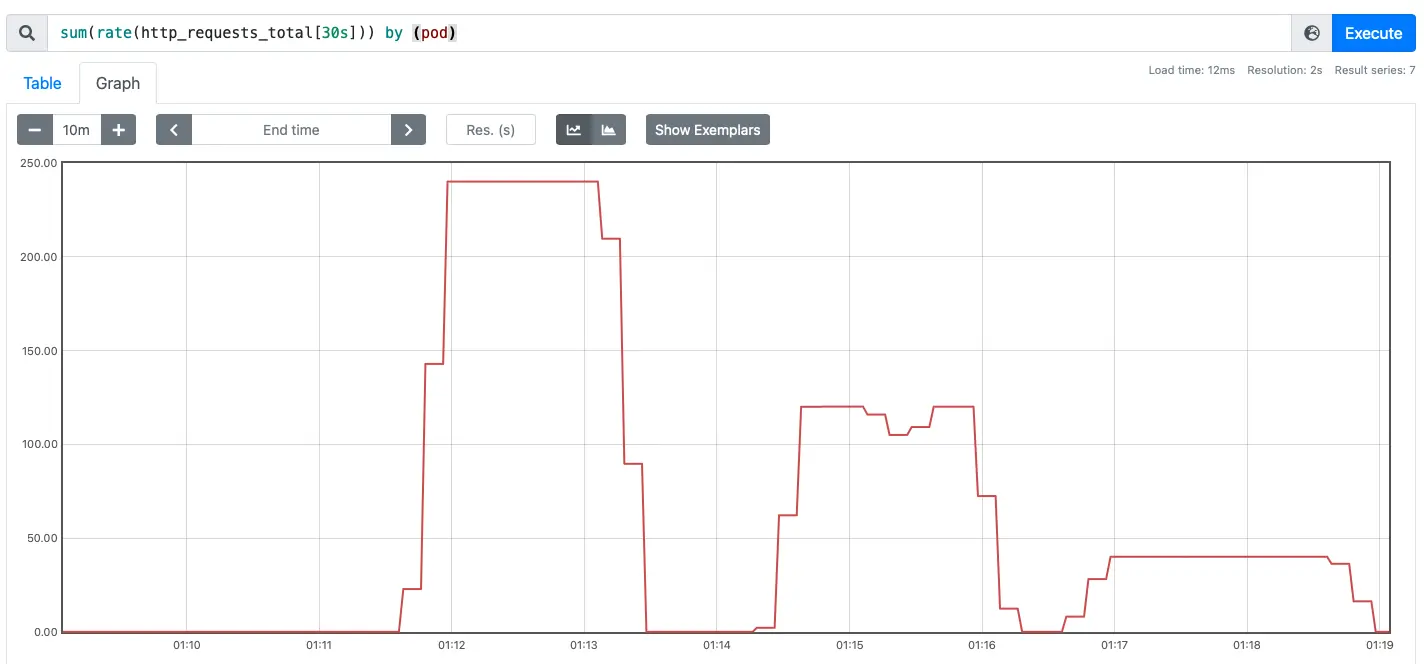
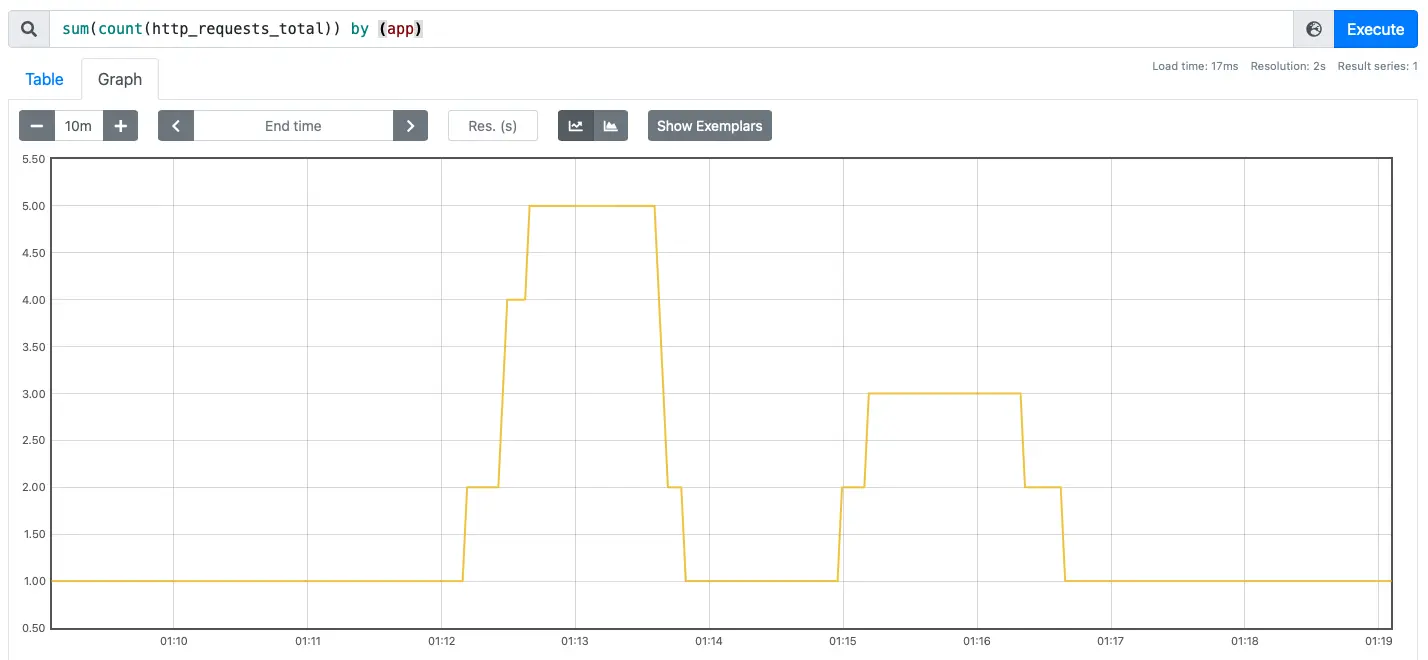
Observe the change in the number of requests versus the number of examples from the Prometheus web interface.
 1
 2
 3
 4
 5
 6
 7
 8
 9
10
11
12
13
14
15
16
17
18
19
20
21
22
23
24
25
26
27
28
29
30
31
32
33
34
35
36
37
38
39
40
41
|
kubectl describe hpa sample-httpserver
Warning: autoscaling/v2beta2 HorizontalPodAutoscaler is deprecated in v1.23+, unavailable in v1.26+; use autoscaling/v2 HorizontalPodAutoscaler
Name:                           sample-httpserver
Namespace:                      default
Labels:                         <none>
Annotations:                    <none>
CreationTimestamp:              Mon, 17 Jan 2022 23:18:46 +0800
Reference:                      Deployment/sample-httpserver
Metrics:                        ( current / target )
  "http_requests_qps" on pods:  100m / 50
Min replicas:                   1
Max replicas:                   10
Behavior:
  Scale Up:
    Stabilization Window: 0 seconds
    Select Policy: Max
    Policies:
      - Type: Percent  Value: 100  Period: 15 seconds
  Scale Down:
    Stabilization Window: 30 seconds
    Select Policy: Max
    Policies:
      - Type: Percent  Value: 100  Period: 15 seconds
Deployment pods:       1 current / 1 desired
Conditions:
  Type            Status  Reason              Message
  ----            ------  ------              -------
  AbleToScale     True    ReadyForNewScale    recommended size matches current size
  ScalingActive   True    ValidMetricFound    the HPA was able to successfully calculate a replica count from pods metric http_requests_qps
  ScalingLimited  False   DesiredWithinRange  the desired count is within the acceptable range
Events:
  Type    Reason             Age                  From                       Message
  ----    ------             ----                 ----                       -------
  Normal  SuccessfulRescale  25m                  horizontal-pod-autoscaler  New size: 6; reason: pods metric http_requests_qps above target
  Normal  SuccessfulRescale  19m                  horizontal-pod-autoscaler  New size: 4; reason: All metrics below target
  Normal  SuccessfulRescale  12m (x2 over 9h)     horizontal-pod-autoscaler  New size: 4; reason: pods metric http_requests_qps above target
  Normal  SuccessfulRescale  11m                  horizontal-pod-autoscaler  New size: 5; reason: pods metric http_requests_qps above target
  Normal  SuccessfulRescale  9m40s (x2 over 12m)  horizontal-pod-autoscaler  New size: 2; reason: pods metric http_requests_qps above target
  Normal  SuccessfulRescale  9m24s (x4 over 10h)  horizontal-pod-autoscaler  New size: 3; reason: pods metric http_requests_qps above target
  Normal  SuccessfulRescale  7m54s (x3 over 9h)   horizontal-pod-autoscaler  New size: 2; reason: All metrics below target
  Normal  SuccessfulRescale  7m39s (x4 over 9h)   horizontal-pod-autoscaler  New size: 1; reason: All metrics below target
|
Summary
Horizontal scaling of applications based on custom metrics such as requests per second is more reliable than CPU/memory and is suitable for most web systems. Promeheus is a popular application monitoring system that can be used as a scaling metric with the support of the Adapter and Aggregate APIs.
HPA’s scale to 0 is currently in alpha and needs to focus on the effectiveness of scaling from 0 to N replicas. If the minimum number of replicas is greater than 0, it will again be resource intensive for some services. Next, we will try to address the performance of 0 to N, and the resource consumption issues.