Developers often need to track performance bottlenecks in applications in production environments and try to identify the root cause of the bottlenecks. To do this, they typically gather this information through logs. Unfortunately, this approach can be time-consuming and does not provide sufficiently detailed information about the underlying problem.
A modern and more advanced approach is to apply and use profiling techniques and tools that highlight the slowest application code and methods that consume most of the resources (such as CPU and memory). Continuous profiling is the process of continuously collecting application performance data in a production environment and making this data available to developers for in-depth analysis.
By, we generate a summary file (Profile) for a single analysis by capturing the metrics of the program. the Go language provides the pprof tool to easily generate a profile file. You can generate CPU, Heap, etc. profile files by calling runtime/pprof programmatically, or you can use net/http/pprof Integrate into web applications and analyze from command line or web page by go tool pprof tool.
Sometimes we can’t perform pprof analysis in time, the fault may have disappeared or the program has crashed. In addition, we may need to compare profiles from different time periods and make comparisons to find problems, such as memory leaks. This is when continuous profiling is important. Many cloud service vendors provide continuous profiling capabilities, such as Go Continuous Profiler | Datadog, Cloud Profiler | Google Cloud, Amazon CodeGuru Profiler, etc.
Introduction to Pyroscope
If you want to use continuous analysis in your own production system, consider Pyroscope.
Pyroscope is an open source continuous analysis system implemented in Go language. The server side uses web pages to view and provide rich functionality for analysis, and the client side provides support for Go, Java, Python, Ruby, PHP, .NET and other languages, and supports PUSH, PULL two collection methods.
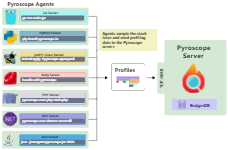
First of all, you need to deploy a Pyroscope server, which uses BadgerDB as the storage engine at the bottom, and optimizes the profile data.
Pyroscope server is responsible for receiving (or pulling, we mainly demonstrate the push approach below) the profile data uploaded by the agent, and provides a timeline interface to view the profile data within a period of time. For example, the following figure demonstrates 12 hours of profile data for a rpcx microservice application.
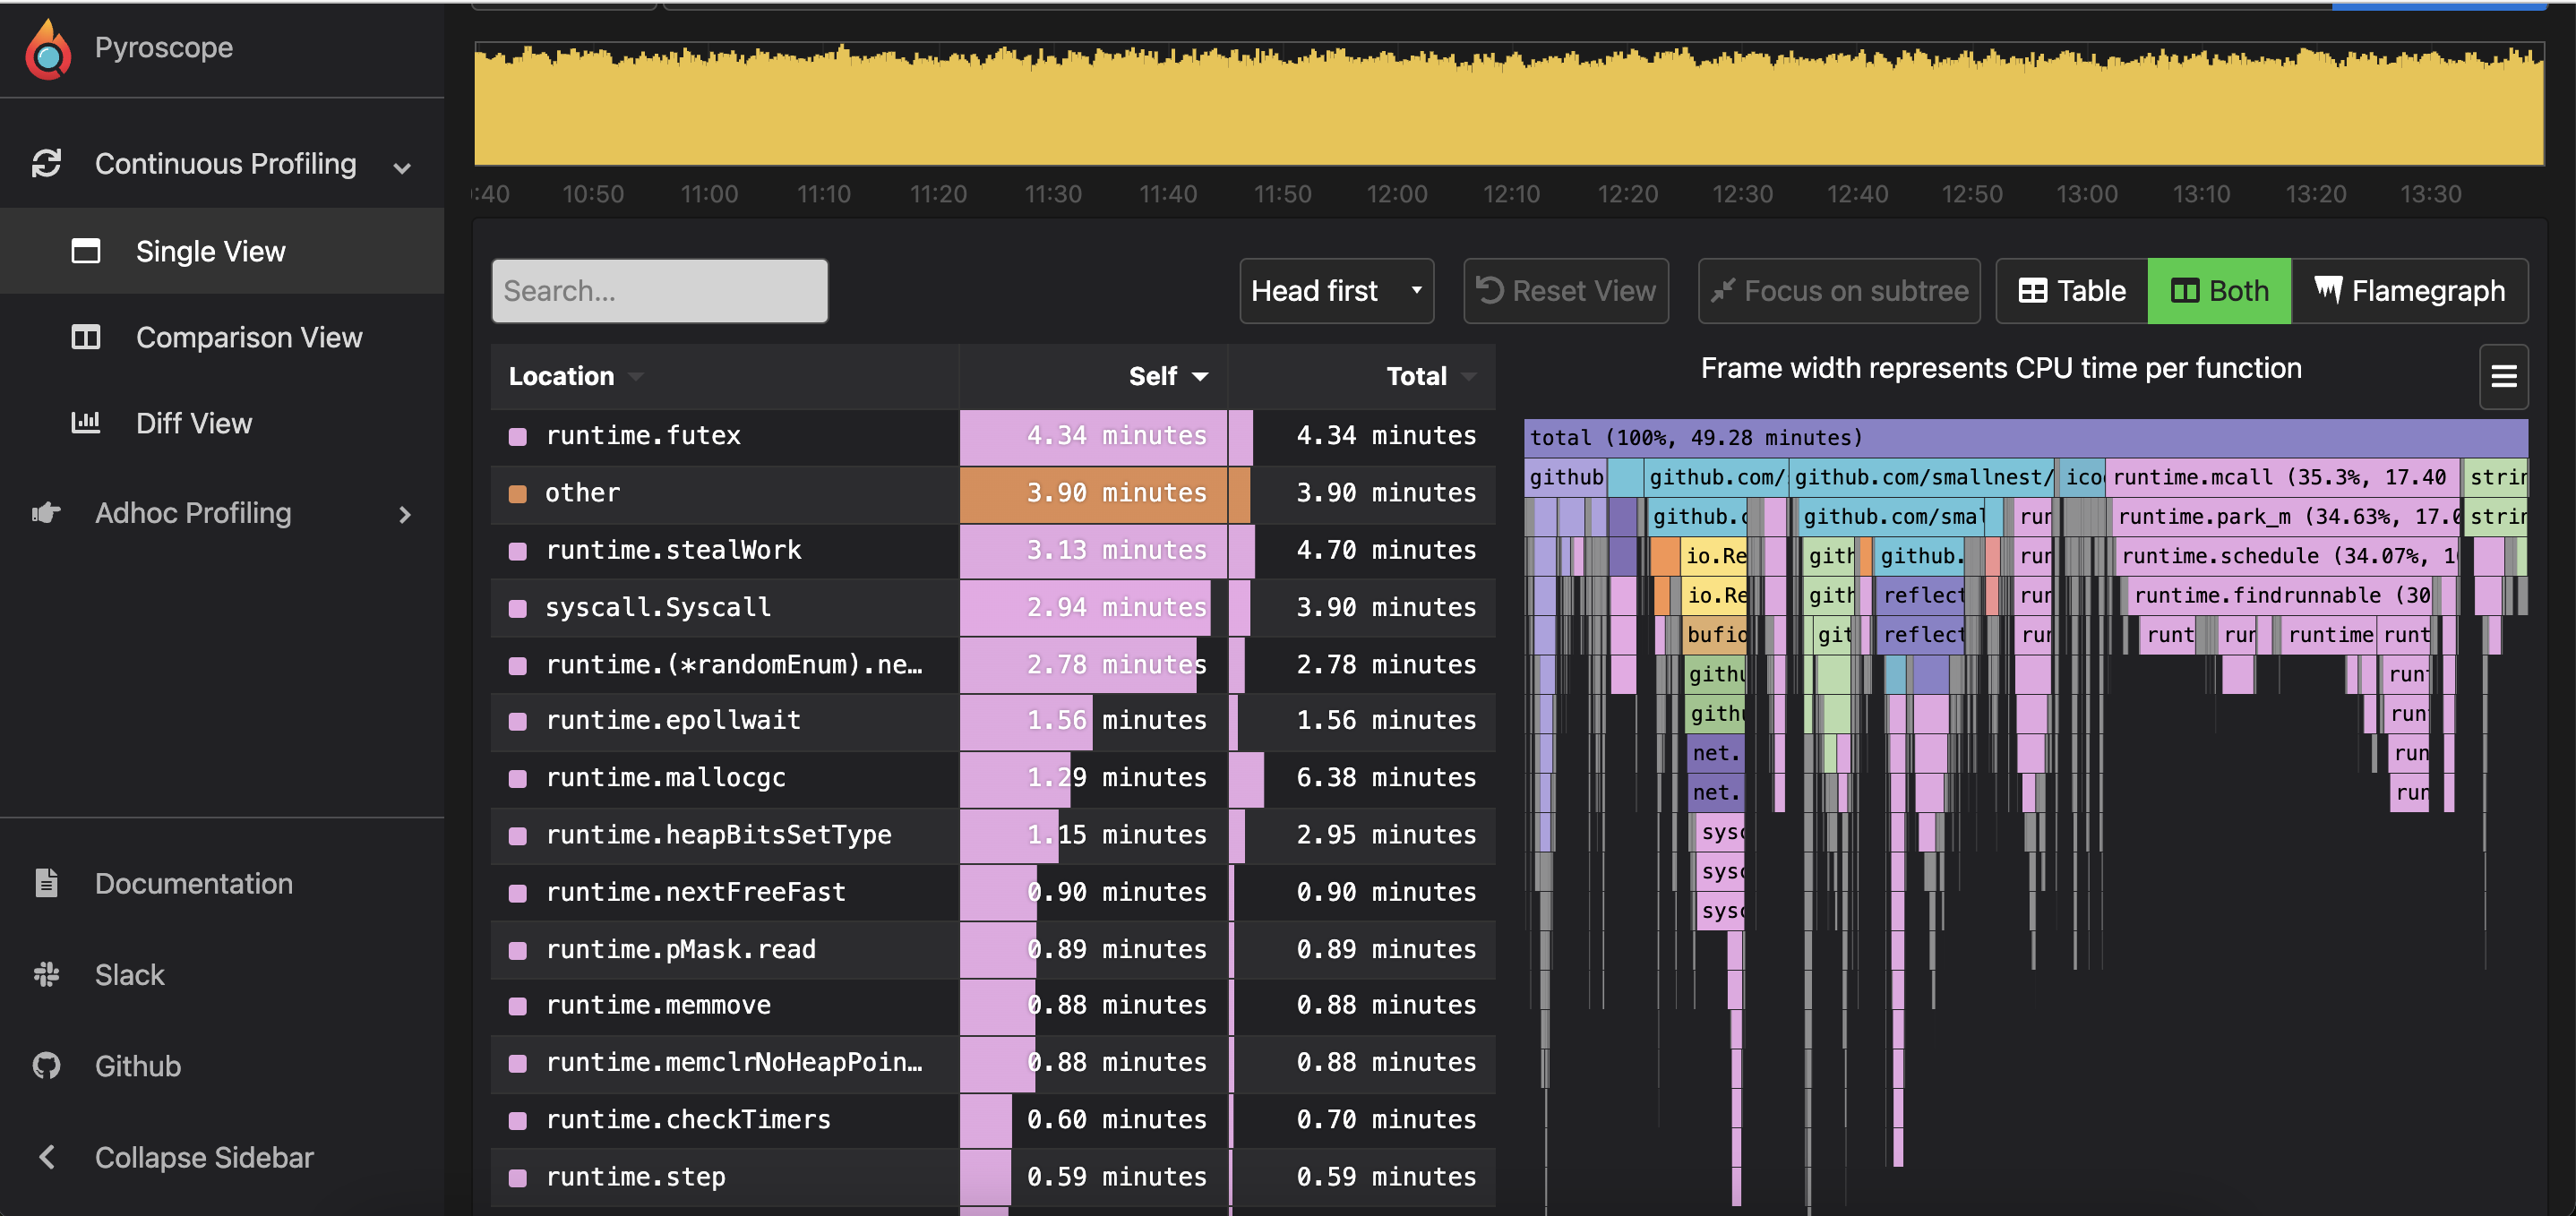
It can display either a flame chart for this period of time, a sorted table display, or both. This flame chart shows that the time consumption is mainly on method calls and codecs of microservices (except for Go runtime scheduling).
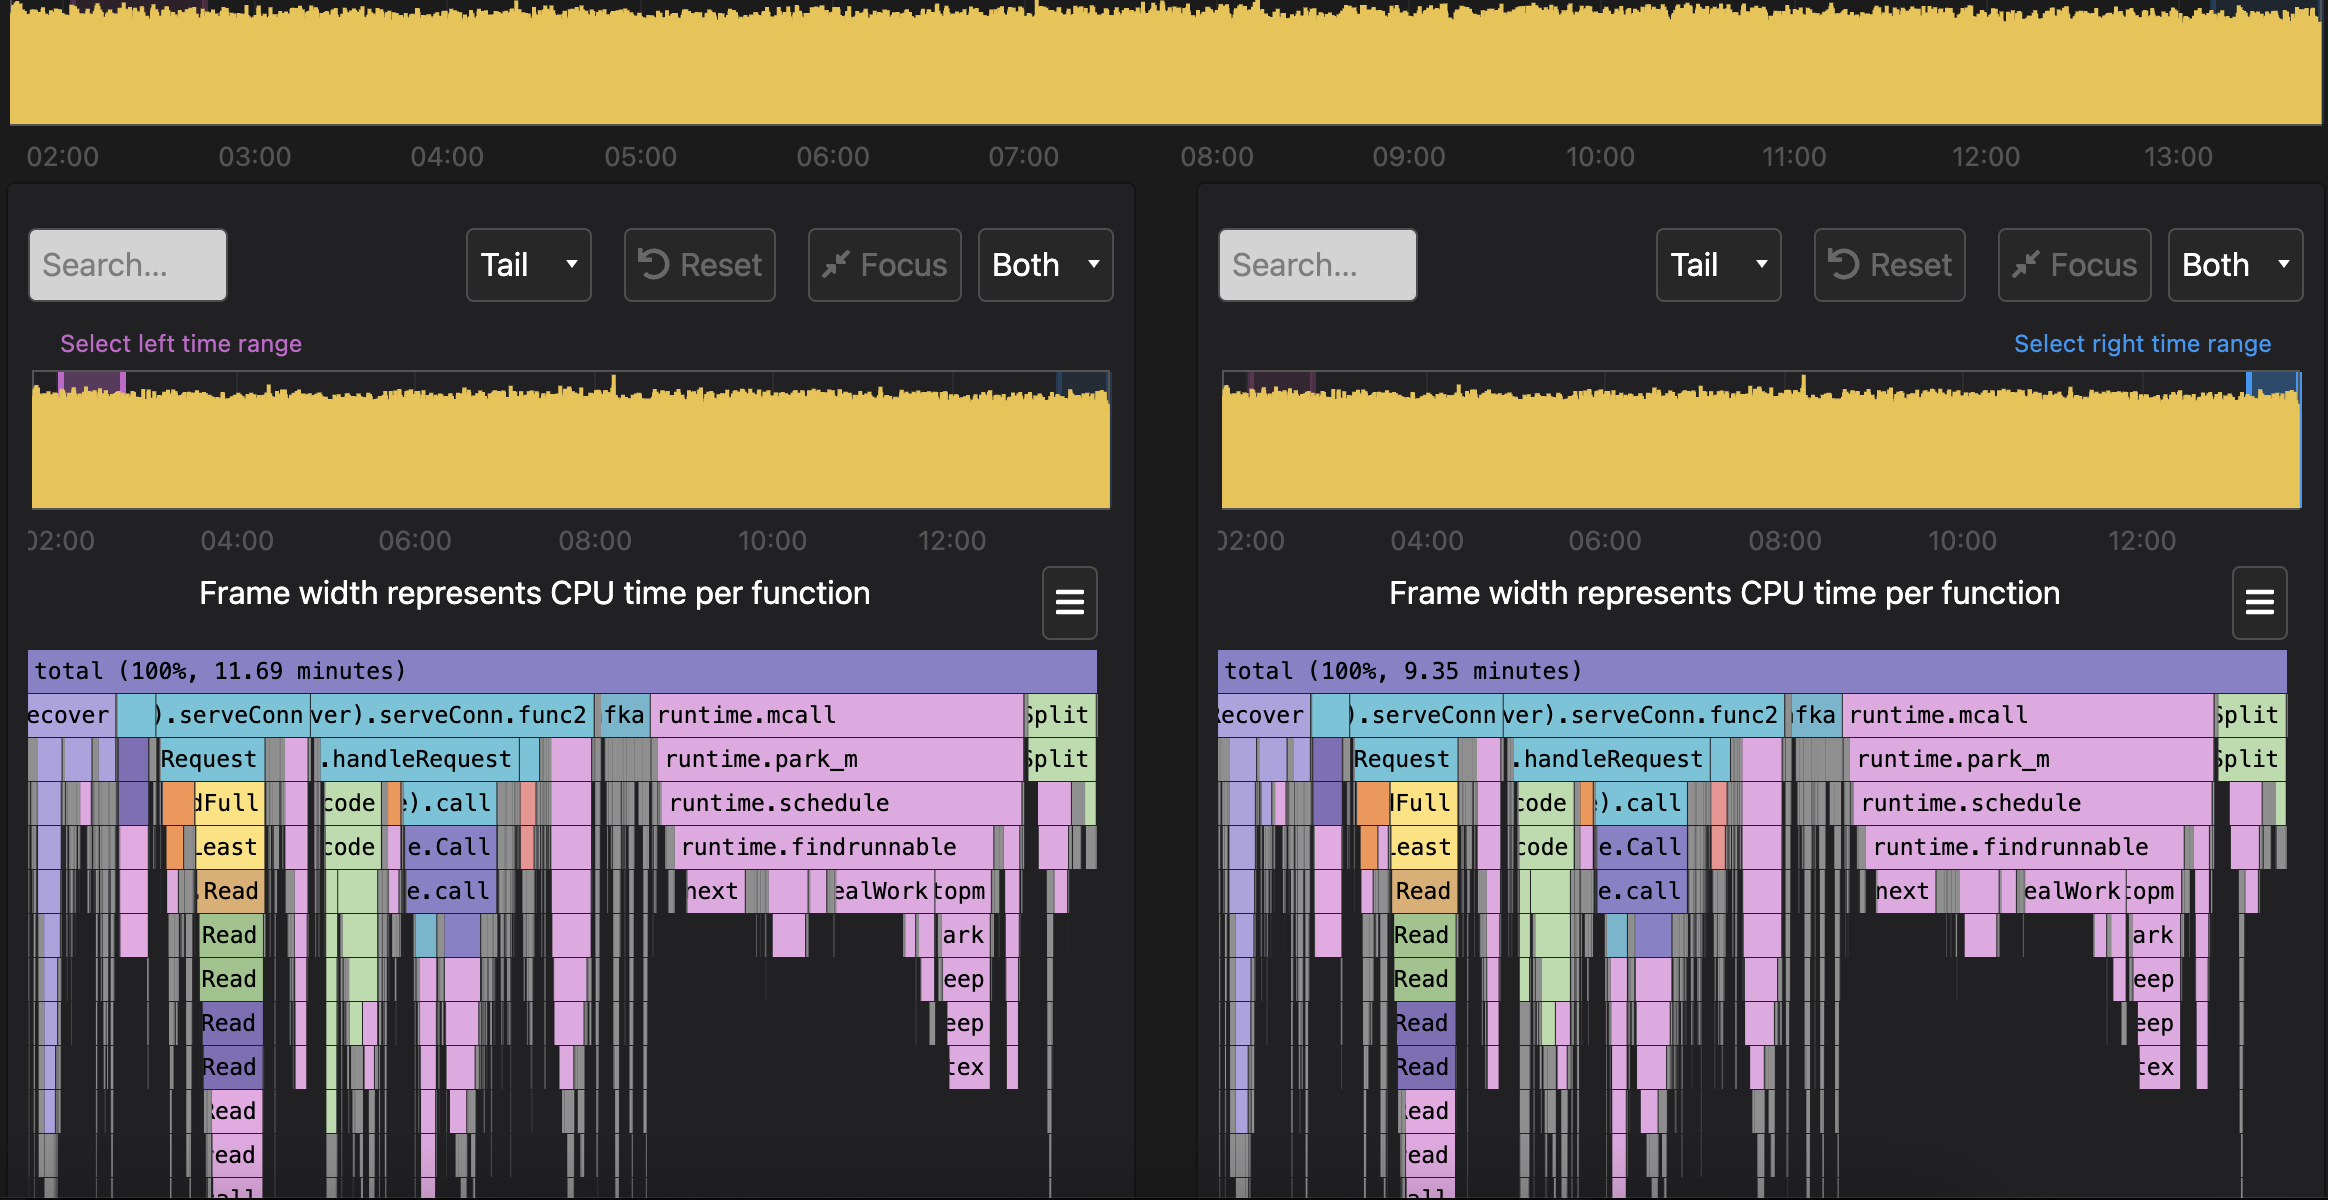
You can also select different time periods for comparison, and the time for the left and right graphs can be selected by simply dragging and dropping on the timeline.
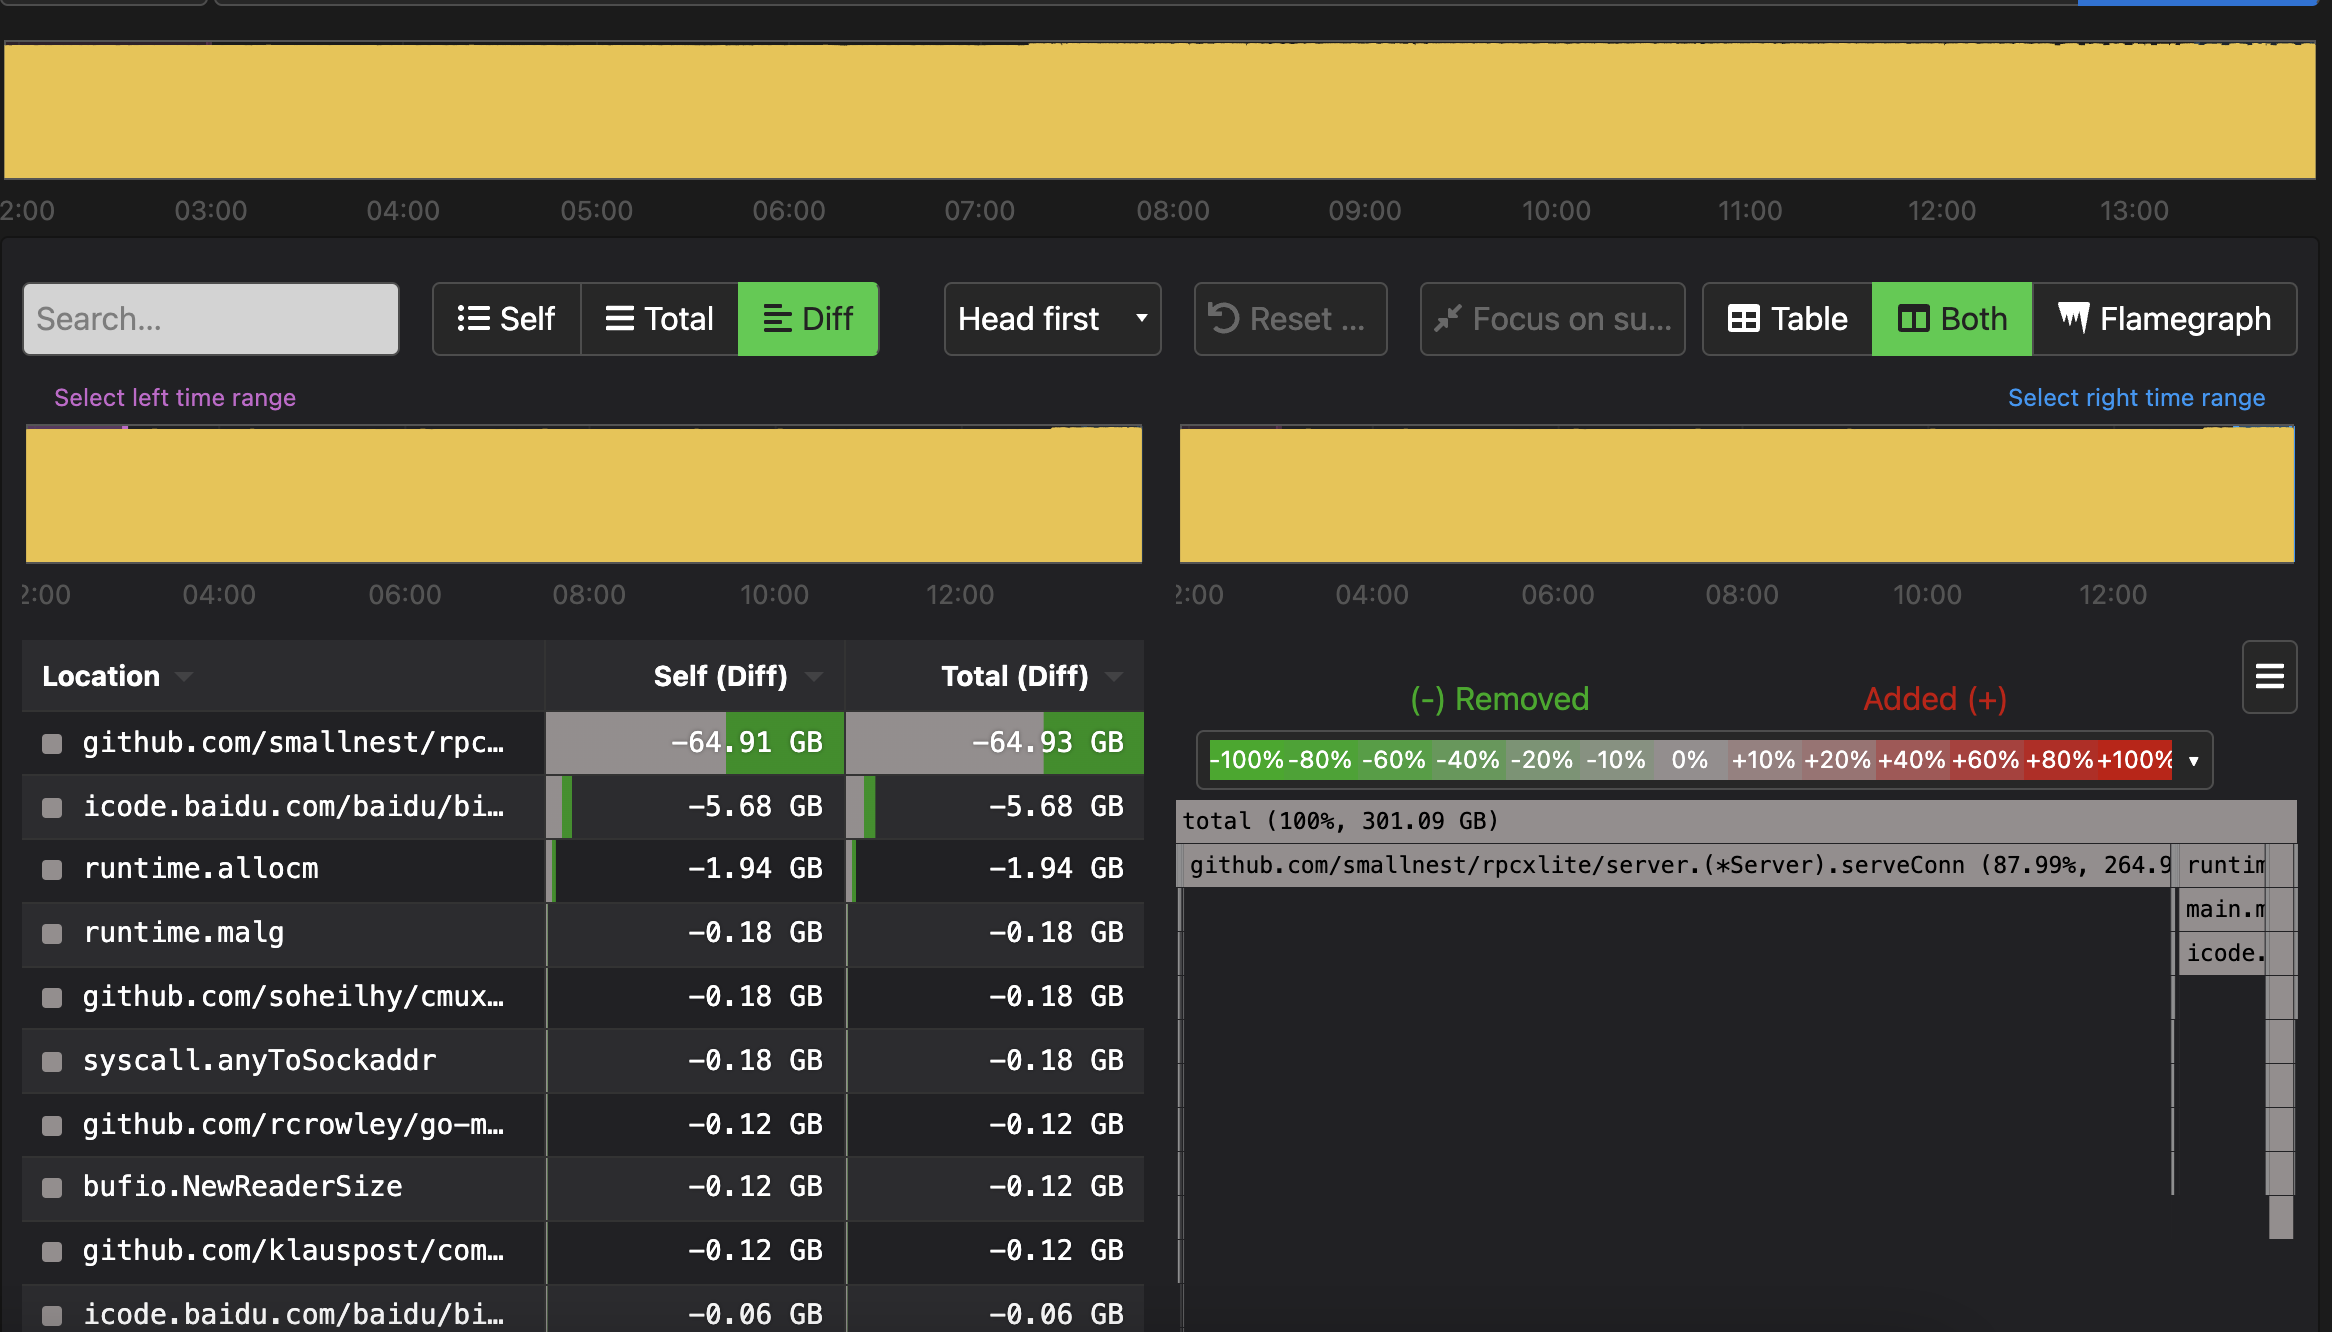
A diff view is also available, and this is often used for memory leak analysis.
Pyroscope server installation
The Pyroscope server side can be installed via docker:
|
|
It can also be installed directly in each operating system.
For example, Mac:
Various Liunx distributions are also easy to install, such as Cebtos:
For example, ubuntu:
Once the installation is complete, you can access it through the web interface: http://localhost:4040 , you can change the listening port and some other configuration items through the configuration file.
Client integration
As mentioned above, Pyroscope provides agent sdk in several languages, let’s take the Go Push method as an example. Add the agent configuration at the beginning of the application that you need to analyze continuously:
|
|
The main configuration is the name of the ApplicationName, which is displayed in the Pyroscope server drop-down box. profile data to be sent to which Pyroscope server, you can configure the ServerAddress, and the profile items to be monitored via ProfileTypes.
Just add these lines of code, start the program, and you’ll be able to view the continuously analyzed data in the Pyroscope server’s web interface.