Perf is a performance analysis tool that has been added to the kernel since Linux 2.6.31 (2009). It uses kernel runtime staking to detect the running of programs and can provide quite rich information, enough to find performance bottlenecks and optimisation priorities in the running of programs.
Installation
On some systems there may be a full Perf pre-installed, but on the Debian Buster (10) I am using, only the user space programs are pre-installed, so the corresponding kernel tools still need to be installed. Normally, the following command will install the kernel part of the corresponding kernel version of Perf. However, if the kernel being used is not the latest kernel in apt, you will need to reboot to switch to the new kernel or install the specified version of the Perf kernel tools.
At this point we should be able to run perf, but usually the following results will occur.
Or rather this
|
|
This is because, for security reasons, the kernel disables non-privileged users from monitoring system performance by default. There are several ways to resolve this.
- Modify the
kernel.perf_event_paranoidkernel parameter - Add the CAP_PERFMON permission bit to perf
- Use the root user for performance monitoring
I generally use the first one myself, so I will describe the details of how to do the first one. It is not recommended to run perf with the root user, as this may be a security risk.
There are two ways to modify the kernel.perf_event_paranoid parameter. The first method is temporary and expires after a reboot, but is a little quicker
|
|
Or use the sysctl command
|
|
The second method is to modify the sysctl configuration file, which in my environment is located at /etc/sysctl.conf and on some systems is /etc/sysctl.d
Once this has been done, the kernel will allow unprivileged users to use the interfaces in the perf kernel section.
Usage
There are several common uses of perf, the first being a simpler rough idea of how the program is using the hardware
|
|
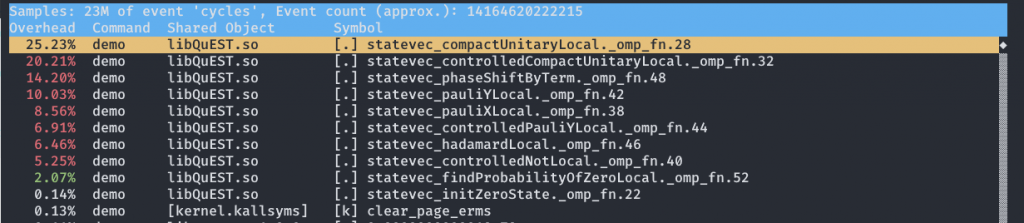
The second is also a powerful one, allowing a detailed analysis of the runtime percentage of each function of the program and also the time consumption percentage of each instruction in these functions, which allows us to get an accurate picture of the processor resource usage of the bottleneck of the program runtime.
At this point we can see a screen like this
Press A to see the disassembled assembly code and the corresponding time share.
Sometimes if the debug option is turned off at compile time (e.g. gcc -g) then it is likely that perf will not get the correct call stack, which will make the time share statistics problematic and will not allow us to observe hot functions. In this case you can specify that perf uses a more detailed call stack tracking method, for example using lbr
|
|
There are three methods of call stack tracing that perf can use.
- fp: least detailed, produces the smallest log file, and has little to no impact on program performance.
- lbr: more detailed, produces a significantly larger log file, and has a small impact on performance.
- dwarf: the most detailed, produces extremely large log files, maybe 10 gigabytes a minute, and has a significant impact on performance, so it is not very practical.
For me it’s usually straightforward to go with lbr, then consider fp if the hard drive isn’t big enough or if reading and writing a few gigabytes of files is slow.