Meet btop, an aesthetically pleasing system resource monitor that displays processor, memory, disk, network and process usage and statistics. btop is a lighter, faster version of C++, and is a continuation of bashtop and bpytop.
Over the years, the options available for command-line system monitoring tools have grown considerably. There are top, htop, glances, nmon, ytop, gtop, vtop and atop to name a few.
In Linux administration, it is important to monitor system performance and hardware resource usage in real time. Especially for production server environments.
Using btop to monitor system resources
Once you launch btop, you will notice how easy it is to use. Use this keyboard shortcut candidate list to control the UI.
- (Esc, m) - Show the main menu.
- (F2, o) - Show options.
- (F1, h) - Displays the help screen.
- (Ctrl-C, q) - Quit the program.
- (+, -) - Adds/subtracts 100 milliseconds to/from the update timer.
- (Up arrow) (Down arrow) - Selects in the list of processes.
- (Enter) - Displays the details of the selected process.
- (Pg Up) (Pg Down) - Jumps 1 page in the list of processes.
- (Home) (End) - Jumps to the first or last page of the process list.
- (Left) (Right) - Selects the previous/next sequence.
- (b, n) - Selects the previous/next network device.
- (e) - Toggles the process tree view.
- (r) - Inverts the sort order in the process box.
- (f, /) - Enter a string to filter processes.
You can also use the help menu to get more keyboard shortcuts.
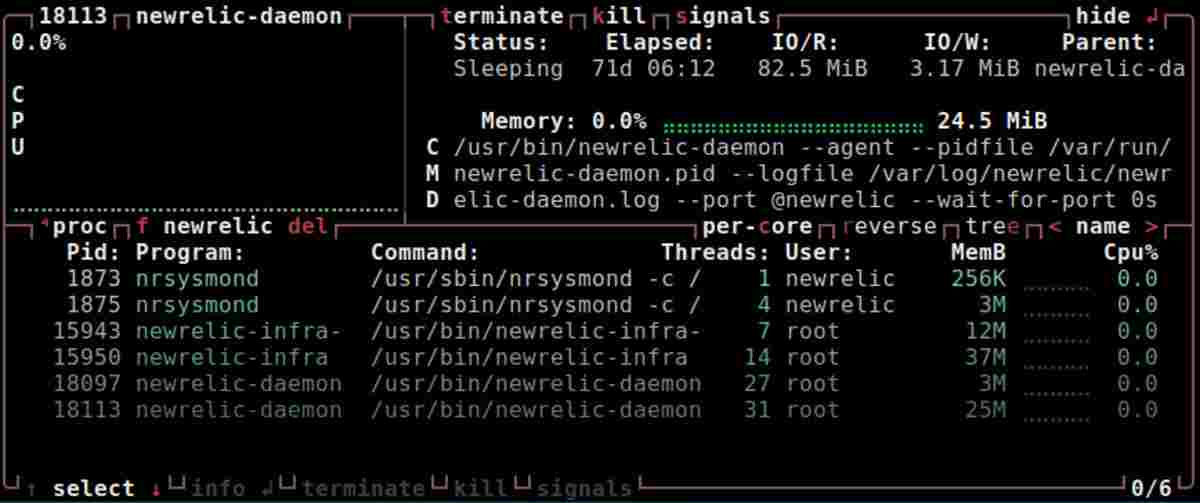
Using btop, you can quickly view detailed statistics about processes, easily switch between sorting options, send SIGTERM, SIGKILL, SIGINT to selected processes, see the current read/write speed of storage devices, and more.
btop Features
- Easy to use and attractive user interface with simplified overview of system statistics.
- Full mouse support, all buttons with highlighted keys are clickable, mouse scrolling works in process lists and menu boxes.
- Fast responsive UI with UP, DOWN keys for processing selection.
- Functionality for displaying detailed statistical information about the selected process.
- Ability to filter processes.
- Easy switching between sorting options.
- Tree view of processes.
- Send any signal to the selected process.
- UI menu for changing all profile options.
- Auto-scaling graph for network usage.
- Display of disk IO activity and speed.
- Battery chart
- Optional symbols for charts
- Custom presets
- Available in a growing list of official repositories from recent releases. For example, Manjaro install =
pacman -S btop. - Also compatible with Mac and FreeBSD.
- Uses less CPU and RAM than bashtop and bpytop.
Conclusion
In mission-critical settings, top, htop and atop, along with other useful tools such as net-tools, iptraf, collectl, dstat, iostat, iotop, sar, saidar and vmstat, remain tried-and-true solutions for monitoring and troubleshooting system resources.