I would like to summarize what I’ve been using in my recent work, the testing tool JMH and the Java runtime monitoring tool Arthas, which have helped me in my actual work. So here’s how to use these tools. I also want to deepen my familiarity with these tools. For these two tools, I will first briefly introduce the general usage scenarios of these tools, and then I will use an example of a real performance problem I encountered in my work to explain the actual usage of these two tools in detail. Without further ado, let’s get right to the point.
Problem Description
In order to be able to run through the use of these two tools in my later examples, I will first briefly describe the actual performance problems we encountered in our development. Then I’ll draw out the actual use of the two performance tools and see how we used them to successfully locate a performance bottleneck.
The problem is as follows: In order to be able to support the loss rate, we modified the original log4j2 Async+Custom Appender approach and put the asynchronous logic into our own revamped Appender. However, we found that the performance of the modified logging was much lower than the previous Async+Custom Appender approach. Here I didn’t use an example from the actual company for privacy reasons, here I used an alternative way that also reflects the problem. Let’s skip the specific configuration file for now and give the performance test code and results
Code
|
|
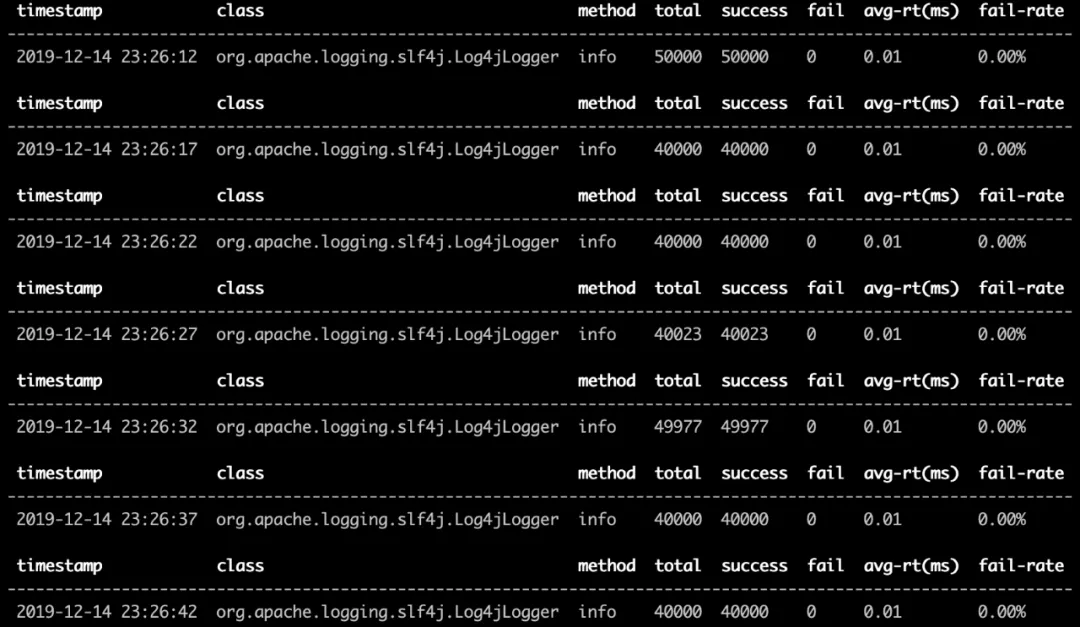
The code logic is simple, it calls logger.info to print 10,000 logs at a time and then records the elapsed time. The comparison between the two is as follows.
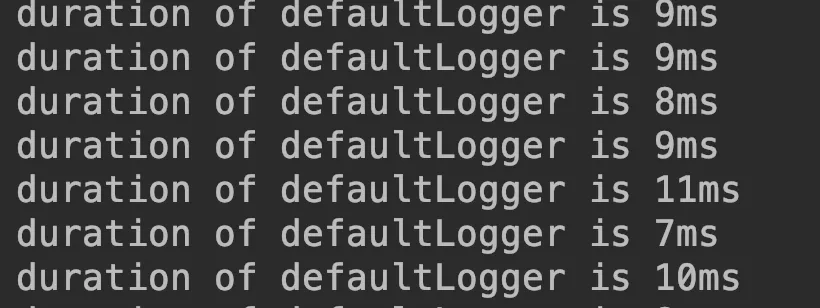
Comparison of results.
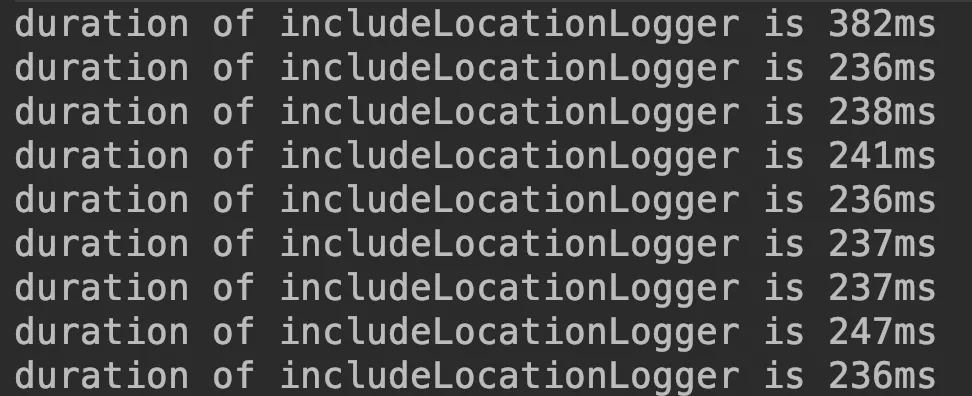
From these two pictures we are able to see the same logic, the difference in time consumption between the two programs is tens of times, but looking at the pictures, it seems to be just the name of the logger is different. Analyzing the results of the above experiment, we may have two questions
- whether the above code test is standard and regulated
- If it is really a performance problem, then the two codes have such a big difference in which method leads to the final performance difference
The following two tools will be used to answer these two questions respectively
Introduction to JMH
The first question is whether the test method is standard. We write our code in a dead loop + back and forth “stopwatch” style. If we were to add a multi-threaded test, we would need a thread pool, and we would have to care about the logic of the test in addition to the logic of the code itself. JMH is one such testing framework for Java. Here is the official definition of JMH.
JMH is a performance benchmarking framework for the Java language or other Java virtual machine languages.
The most suitable scenario is to test the performance of two collections of put and get, such as ArrayList vs. LinkedList, etc. Here we need to test the time required to play a batch of logs, which is also basically in line with the test scenario using JMH. Here is the test code, the bench framework code and the main function.
Methods to be tested
|
|
As you can see the method to be tested is very simple, it is the operation of printing 10,000 logs at once in a single batch, so there is no need to explain any additional parts. Let’s look at the benchmark section again.
|
|
In this code, we then find something unique to JMH, which I briefly describe below.
In the above code, I have defined 4 methods to be tested, the method Fork, BenchmarkMode are the average time to test a single OPS, but the number of threads for the 4 methods are different. In addition to these parameters, there are a few more parameters that I will talk about in the main function, and the main code is shown below.
|
|
We can see that in the main function, we are to set the basic configuration of JMH, which has several configuration parameters meaning as follows.
I ran the tests with both loggers separately to see the performance test report comparison
Using the normal logger
Loggers that use INCLUDE_LOCATION
Here we see that the performance gap is immediately apparent. The performance of using INCLUDE_LOCATION is significantly lower than the performance of using normal logger. This is where we must wonder and ask “what is the slowdown”!
Arthas What exactly does my code do at runtime
Arthas is a java debugging tool open-sourced by Ali, similar to greys, but with more powerful features than greys, for example, you can directly draw the flame graph of java method calls, etc. The principle of both tools is the use of Java’s powerful bytecode technology. After all, I am not a JVM expert, so I can not expand on the details of the implementation. All we have to do is stand on the shoulders of giants, accept and use these good performance monitoring tools with skill.
Hands-on
Talk is cheap, show me your code, since it’s a tool, let’s go straight to the real thing. Let’s run the program we started with locally and then explain how to use arthas.
We first find the process number of the program via jps, then we directly enhance the bytecode of our running program via as.sh given by arthas, and then start arthas with the following command
|
|
This is the startup screen of arthas, and we use the help command to see the features supported by the tool.
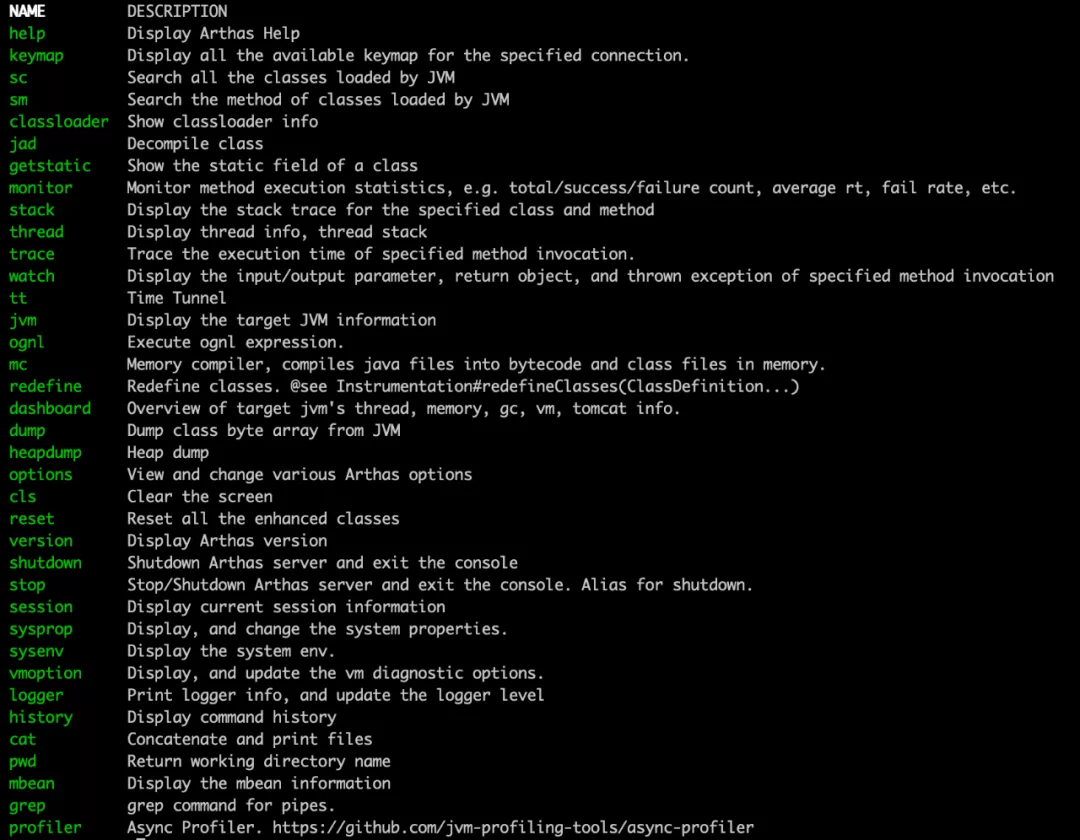
As you can see, arthas supports viewing the current state of jvm, viewing the current thread state, monitoring the call time of certain methods, trace, profile generation flame chart, etc., with a full range of functions. We will also only a few more commonly used commands here, other commands if you are interested in see the official website arthas website for details. This article mainly introduces the following functions.
- Decompile code
- Monitor the invocation of a method
- View the call and return value of a method
- Trace a method
Monitor method calls
The main command for this is monitor, and according to the official website, the common usage is.
|
|
where duration represents every few seconds to show the statistical results, that is, a single statistical cycle, className is the fully qualified name of the class, methodname is the name of the method, which we view the method is the Logger class info method, we use two different logger’s info method, respectively. The class here is org.slf4j.Logger, the method when info, our monitoring statement is.
|
|
The monitoring results are as follows
-
Using the normal appender

-
Use include appender
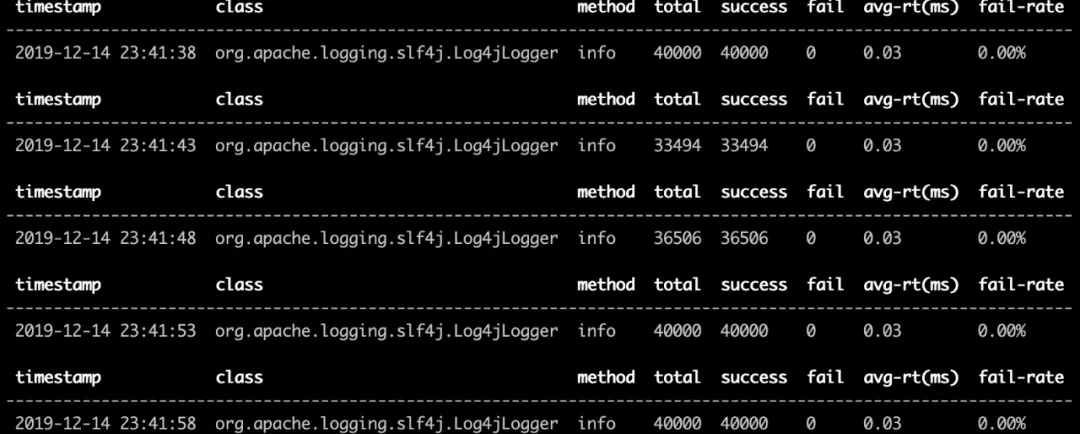
We can see that the print log method using include appeder is 3 times higher than the normal appender, which makes us wonder how time consuming the various steps of these two methods are. Here we will introduce the second command, trace method.
trace command & jad command
The log4j2 configuration files for these two programs are as follows.
|
|
We both used an AsyncAppender to apply a FileAppender. looking at the fileAppender, we found that there is no difference between the two, except for one option in the asyncAppender, which is includeLocation, one is false and the other is true. As for the meaning of this parameter, we won’t discuss it for now, we now know that the problem may be in AsyncAppender, but how do we verify it. trace command is useful.
The basic usage of the trace command is similar to monitor, where the main argument is -n, which means how many times to trace.
|
|
As I mentioned in my previous blog about Log4j2, the core method of any appender is its append method. So let’s trace the append method of each of the two programs.
|
|
The trace results are as follows.
-
Using the normal appender.
-
Use include appender
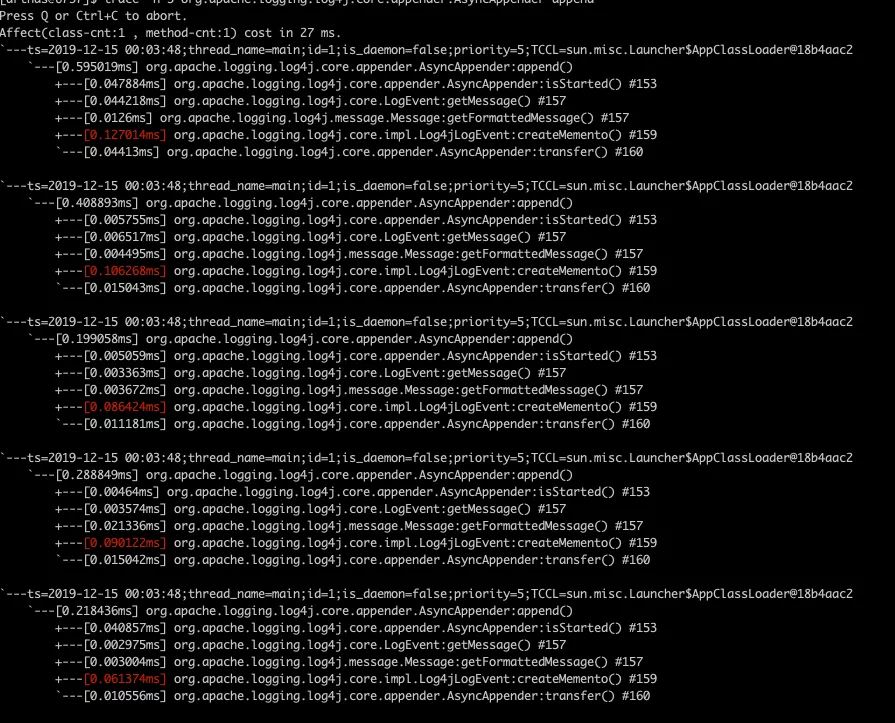
We can immediately find that the hot methods of the two traces are not the same. In the appender that uses include, the method that takes the longest time is the createMemento method in the org.apache.logging.log4j.core.impl.Log4jLogEvent class, so how can we know This method in the end what to do it, then out of our next common command jad, this command can decompile the code of the corresponding method. Here we jad the above-mentioned createMemento method, the command is very simple.
|
|
The results are as follows.

We find that there is an includeLocation parameter in this method, which coincides with the only different configuration we see for the two appenders, so we should have a guess at this point. To verify this guess, let’s introduce the next command, watch.
watch command
watch command can observe the entry, return value and other information of a particular method, we use this command to check the entry of the createMemento method, if the two programs have different entries, then we can basically conclude that this is the cause of the command as follows.
|
|
The meaning of the parameters here is as follows.
The param represents the list of parameters of the method call, and there are other monitoring items as detailed in the official website.
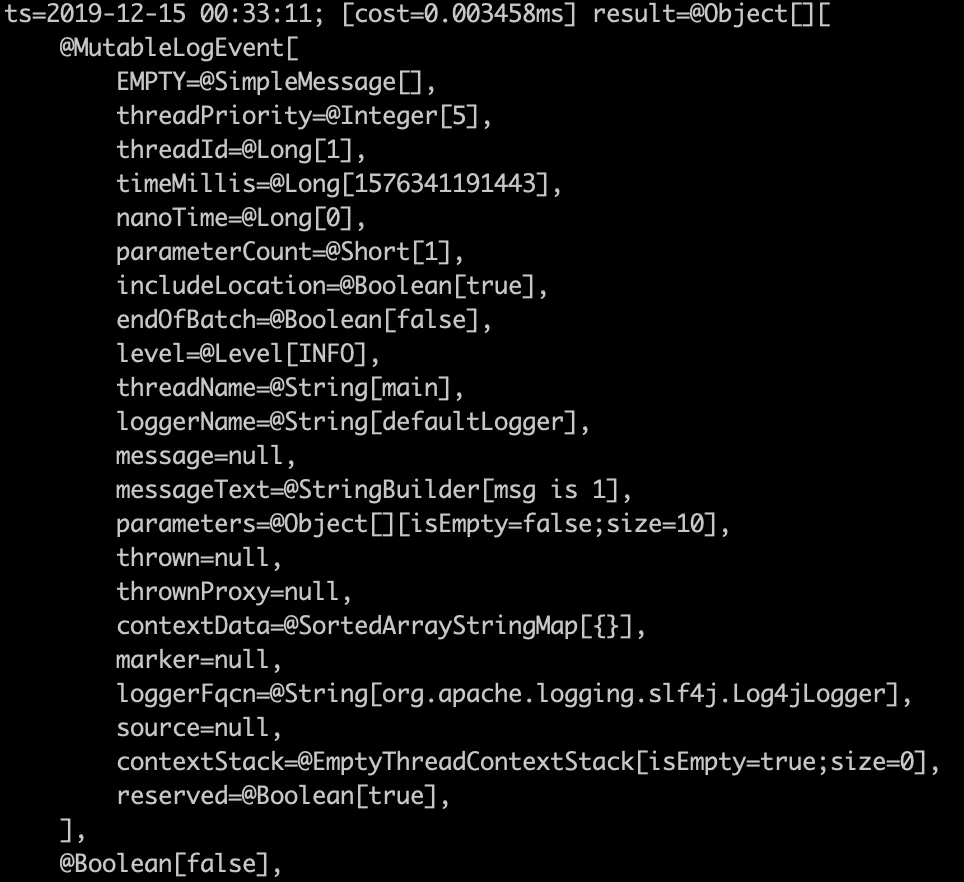
The final watch result is as follows.
-
Using normal logger
-
Use include
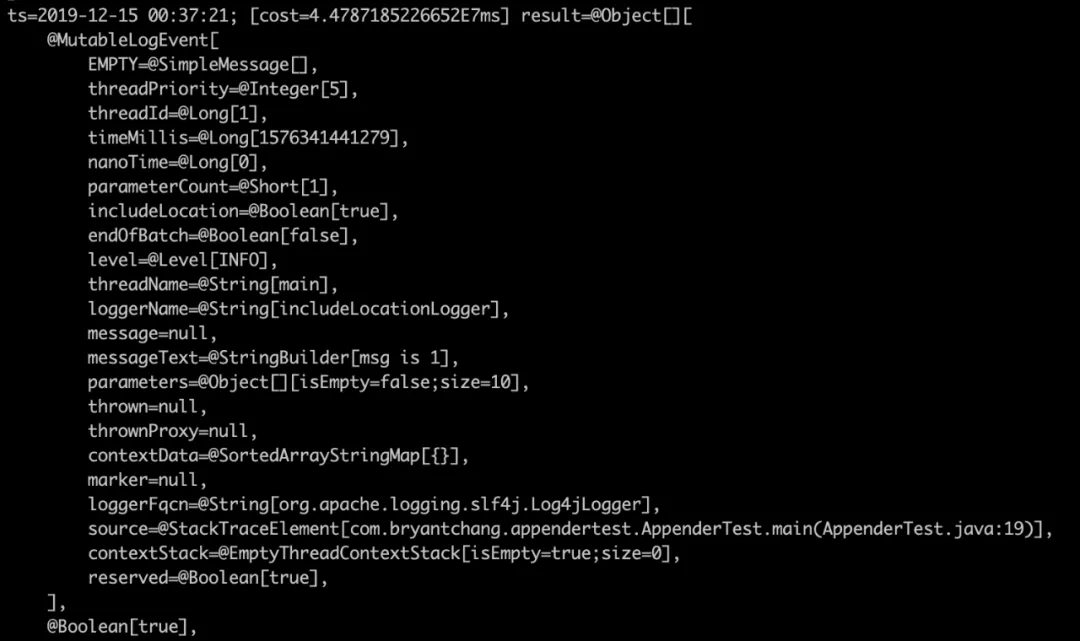
As expected, the two parameters are really a true and a false, we simply look at how this parameter is passed in, we jad the append method of AsyncAppender.
We found that this includeLocation is a property of appender, which is the one configured in our xml. Checking the analysis on the official website, we see that this parameter can reduce the performance of logging by 5-10 times.

However, to find out, I followed the code statically
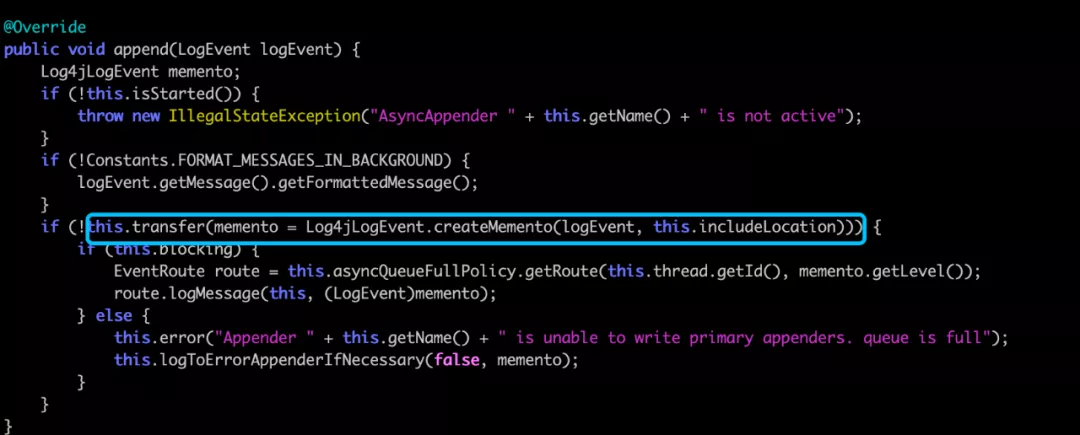
This includeLocation will be used in the event’s createMemento to create a LogEventProxy when serializing the generated object, the code is as follows.
|
|
If includeLocation is true, then the getSource function will be called, follow it in to see, the code is as follows.
|
|
We see that he will look at the entire call stack to find the line of code that calls this method, and the performance can be imagined. Let’s monitor it with arthas and verify it.
First we trace the crateMemento method.
|
|

Log4jLogEvent’s serialize() found in the hot method org.apache.logging.log4j.core.impl.Log4jLogEvent, keep tracing.
|
|

See the hotspot is the constructor of org.apache.logging.log4j.core.impl.Log4jLogEvent:LogEventProxy, continue trace.
|
|
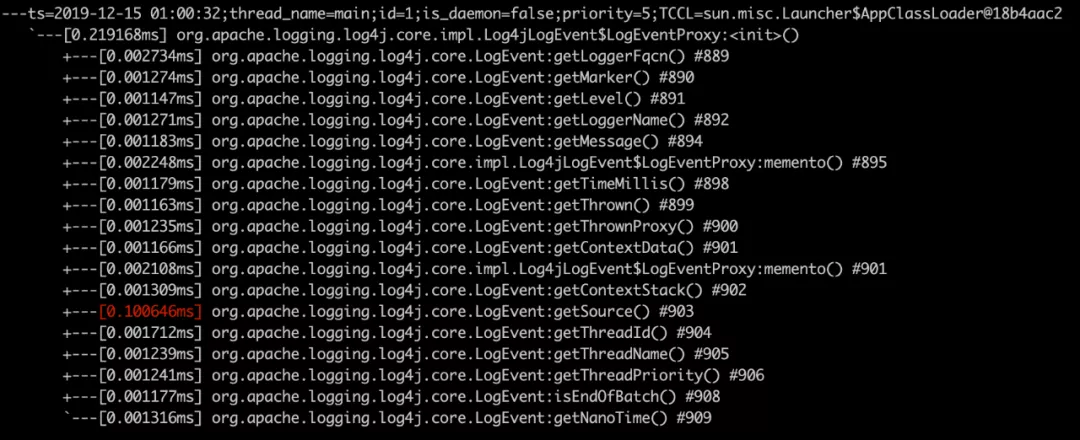
Found the getSource method, continue.
|
|

The hotspot was finally located, and it was the calcLocation function of org.apache.logging.log4j.core.impl.Log4jLogEvent, the same code as our static trace.
So far we have located an online performance problem by combining JMH and arthas together. However, I introduced only the tip of the iceberg, more common commands hope that you understand and practice through the official website, after a few hands-on practice, the tool will be familiar with.