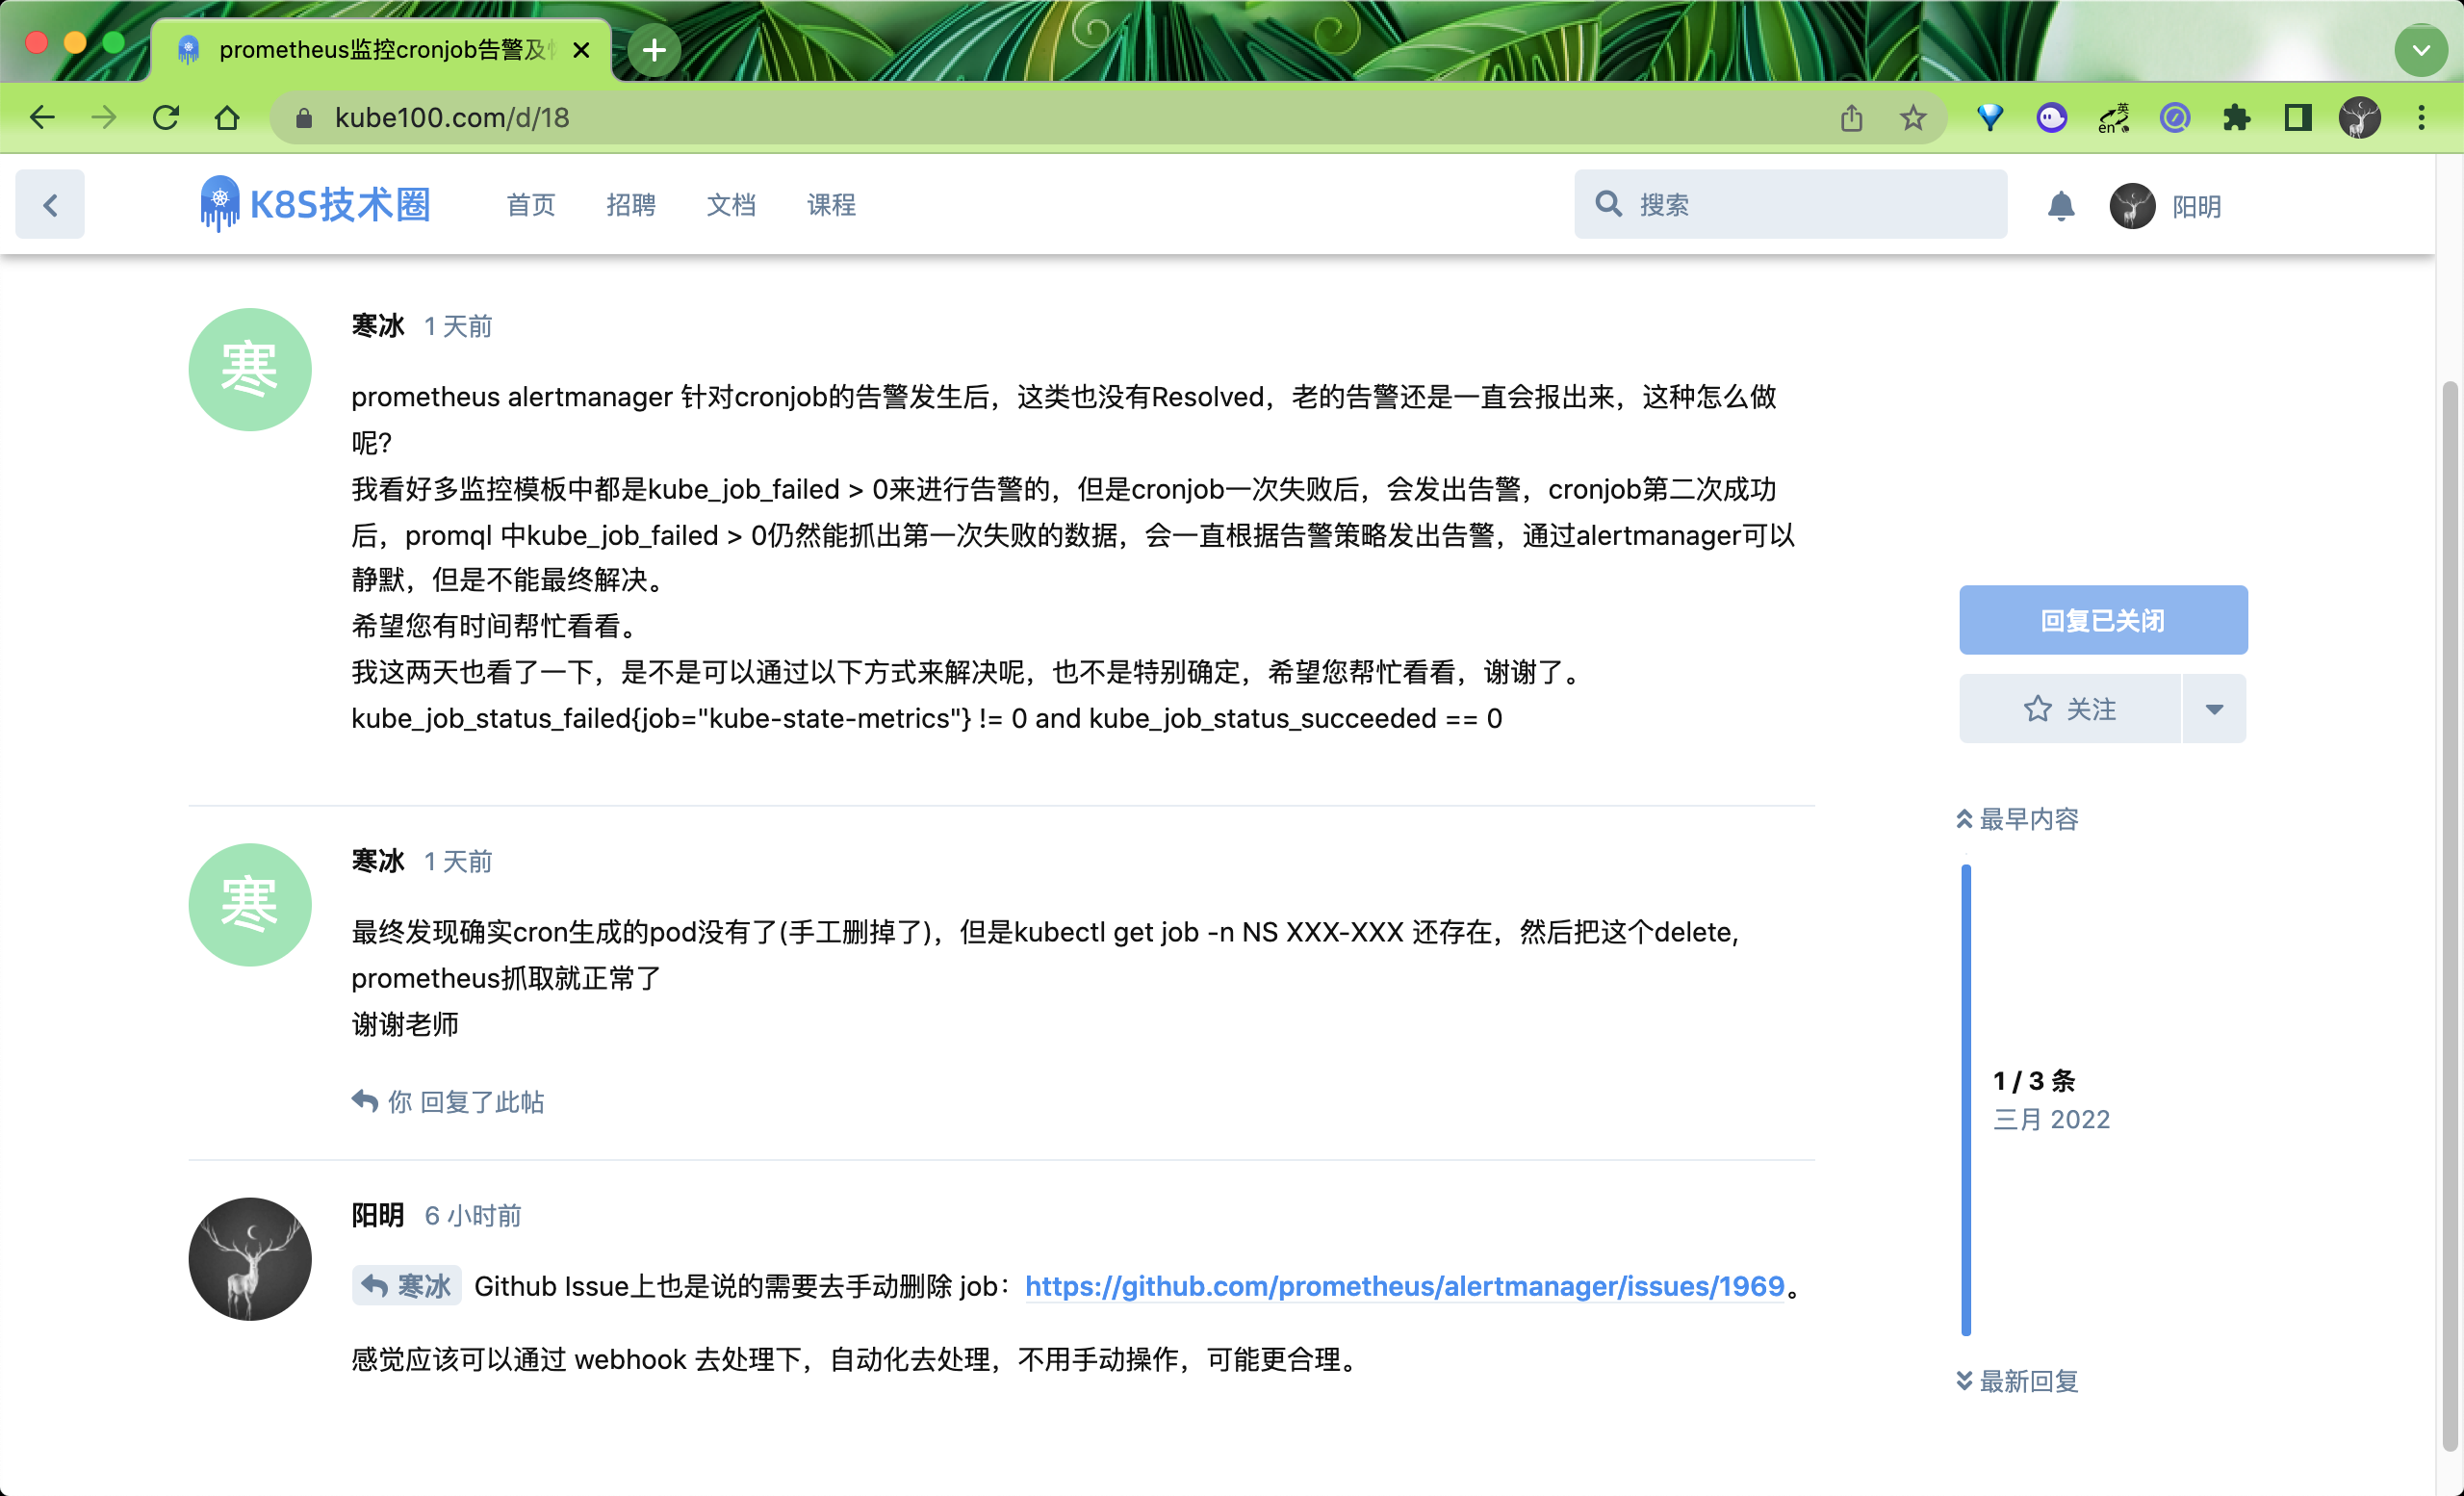
Someone mentioned a problem before, it is about Prometheus monitoring Job task false alarm problem, the general meaning of the CronJob control Job, the front of the execution failed, monitoring will trigger the alarm, after the solution to generate a new Job can be executed normally, but will still receive the alarm in front.

This is because we generally keep some history when executing Job tasks to facilitate troubleshooting, so if there is a failed Job before, even if it will become successful later, the previous Job will continue to exist, and the default alarm rule used by most direct kube-prometheus installation and deployment is kube_job_ status_failed > 0, which is obviously inaccurate. status_failed > 0`, which is obviously inaccurate, only we can manually delete the failed Job task to eliminate false positives. troubleshooting problems. Let’s reorganize our thinking to solve this problem.
CronJob will create a Job object at each execution time of the schedule, and you can use the .spec.successfulJobsHistoryLimit and .spec.failedJobsHistoryLimit properties to keep how many completed and failed Jobs, the default is 3 and 1 respectively, such as the following Declare a resource object for CronJob.
|
|
According to the resource object specification above, Kubernetes will keep only one failed Job and one successful Job.
To solve the above false positives, you also need to use the kube-state-metrics service, which listens to the Kubernetes APIServer and generates metrics about the state of objects. Deployment, Node, Job, Pod, and other resource objects. Here we will use the following metrics.
kube_job_owner: to find the relationship between a Job and the CronJob that triggered itkube_job_status_start_time: to get the time when the Job was triggeredkube_job_status_failed: Get the job that failed to executekube_cronjob_spec_suspend: filter out pending jobs
Here is an example metric with tags generated by the hello task triggered by the CronJob run.
|
|
To make monitoring alarms accurate, we really just need to go get the last job of a group of Jobs triggered by the same CronJob, and only trigger an alarm when the Job fails in execution.
Since the kube_job_status_failed and kube_job_status_start_time metrics do not contain the tag of the CronJob to which they belong, the first step is to add this tag, and the owner_name in the kube_job_owner metric is all we need to merge it with the following promql statement.
Here we use the max function because we may run multiple kube-state-metrics for HA, so it is sufficient to use the max function to return one result for each Job task. Assuming our Job history contains 2 tasks (one failed and the other successful), the results will look like this.
Now that we know the owner of each Job, we need to find out the last task executed, which we can do by aggregating the results by the owner_name tag.
The above statement will find the latest job start time of each owner (that is, CronJob), and then merge it with the above statement, keeping the record with the same start time as the latest executed Job task.
|
|
The results will show the last job executed for each CronJob and only the last one.
|
|
To increase readability we can also replace the job_name, owner_name tags with job and cronjob to make it easier to read.
|
|
You will now see a result similar to the following.
|
|
Since the above query statement is complex, it would be very stressful for Prometheus to perform a real-time computation for each alarm evaluation, so we can use record rules to implement an offline computation-like approach to greatly improve efficiency. Create a record rule as shown below to represent the last executed job record of each CronJob.
|
|
Now that we know the most recent job that CronJob started executing, we can use the kube_job_status_failed metric to filter out the failed ones.
The clamp_max function is used here to convert the result of job:kube_job_status_start_time:max to a set of time series with an upper bound of 1. It is used to filter the failed jobs by multiplication to get a set of Job tasks containing the most recent failures, which we also add here to the record rule named kube_job_ status_failed:sum to the record rule.
The final step is to add alarm rules directly to the failed Job tasks, as shown below.
To avoid false alarms, we have excluded pending tasks. Here we have solved the problem of false alarms for Prometheus monitoring CronJob tasks. Although kube-prometheus has a lot of built-in monitoring and alerting rules for us, we can’t be completely superstitious and sometimes they don’t always fit the actual needs.