As I am recently studying envoy project, which is a cpp project, for me this cpp newcomer is still more pressure, feel everywhere is a pit, open a guide article to record.
If you want to study the envoy project source code, it is definitely necessary to jump to the code, but if you open it with clion, then you will find that envoy is built with bazel, no CMakeLists.txt can not jump, bazel-cmakelists, a tool that has not been iterated for several years, is not usable at all. Therefore, the official recommendation is to use vscode for build development.
In the envoy project, since the runtime environment is based on ubuntu’s docker environment, vscode container mode is provided for us developers to develop and debug.
After reading envoy’s development documentation, it seems to be very easy to use, but there are some pitfalls that made me waste a lot of time.
Build the development environment
Create dev container environment
First, we need to install docker desktop on our machine, then open our envoy project with vscode, open envoy/.devcontainer/devcontainer.json file, this time vscode will pop up the following prompt.
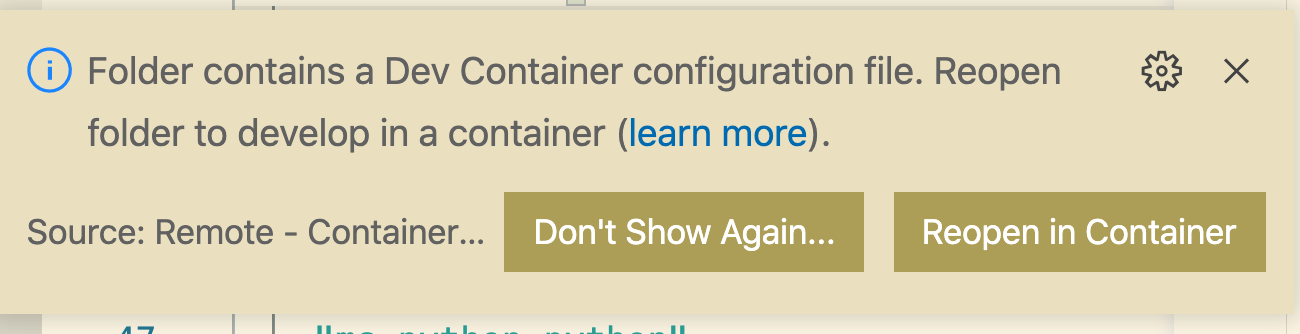
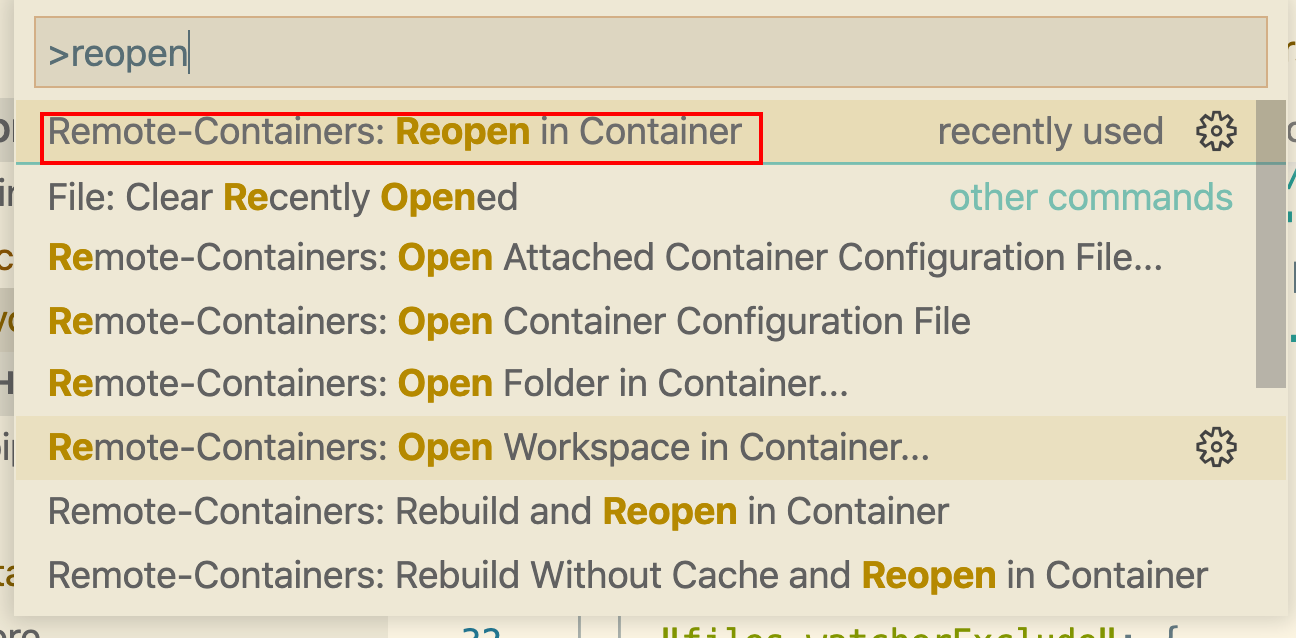
Then we click Reopen in Container to load the build vscode Container development environment. But some people say that they accidentally turned off this prompt, so how do I turn it on manually?
In a mac we can press: command+shift+p and type reopen.
Generate the appropriate dependency files
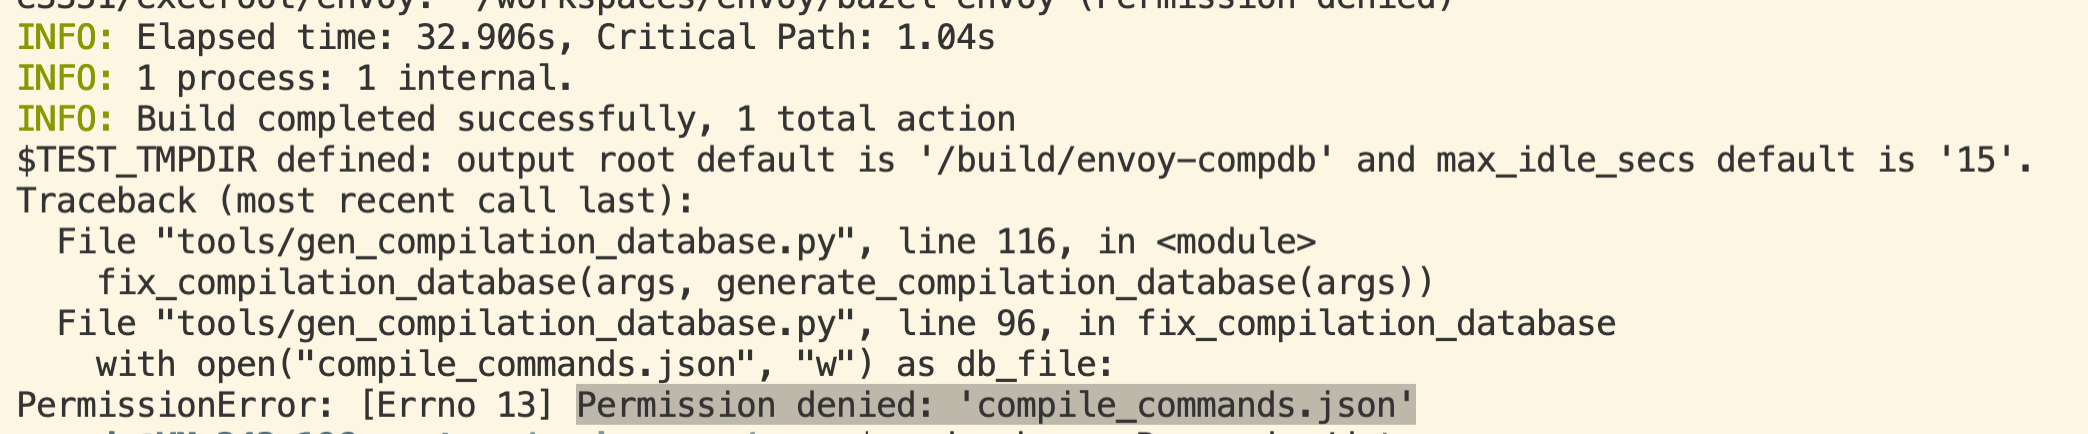
Then, once inside the container, you need to run the Refresh Compilation Database, i.e. the tools/vscode/refresh_compdb.sh script, which will generate all the dependencies for our code completion, such as protobuf generated code, external dependencies.
However, if we run it directly, it will report an error.
Then I went to the official documentation VSCode Remote - Containers and it said that I generally need to set the remoteUser in devcontainer. json to root, and then I rebuilt it a few times, but it was stuck directly for unknown reasons.
Then I ran to the host to add permissions to the vscode user, but I couldn’t find the user. Then I realized that this permission command should be executed from inside the container.
Then run the tools/vscode/refresh_compdb.sh script again, ok, no error is reported. Then I checked the generated complie_commands.json file and it was fine.
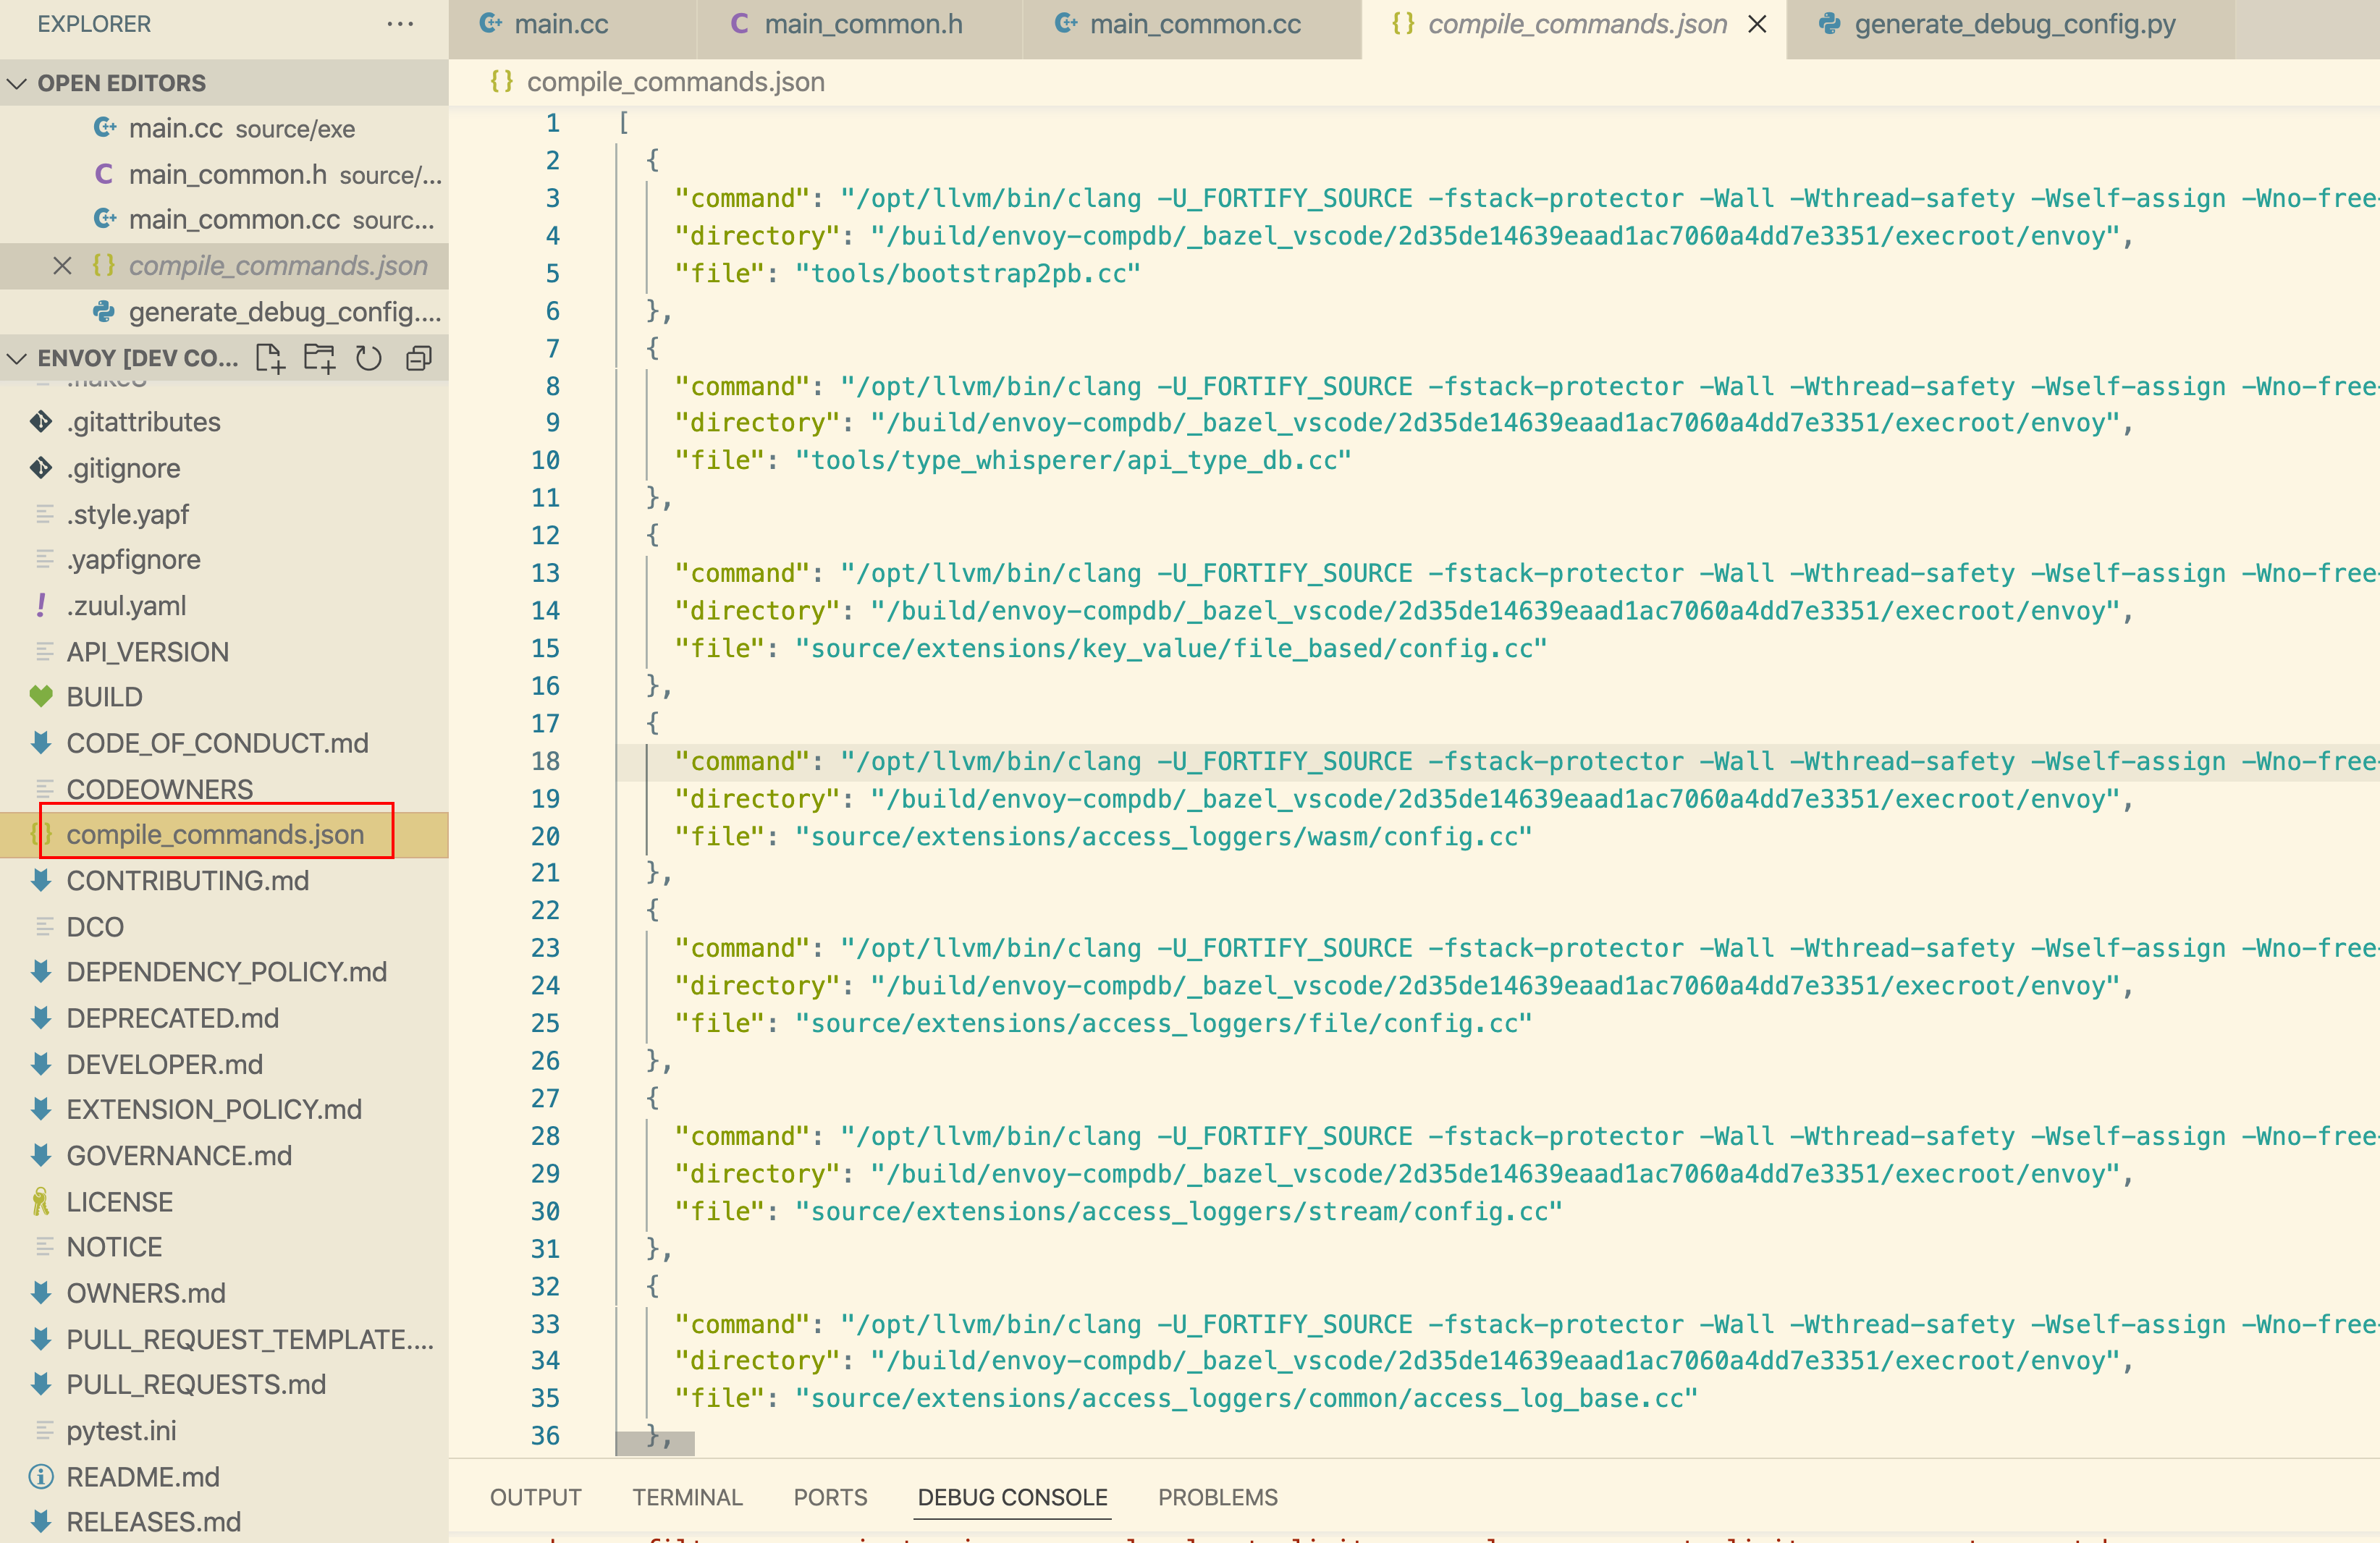
Let’s check again that the code can jump normally and no more errors are reported.
Development environment for envoy debugging
Of course, in addition to making our development environment’s code jump is not enough, it is better to debug the code, so let’s see how to debug envoy.
Configure a demo yaml
There are actually a lot of yaml templates under the config of the code, you can just take one out and put it under the envoy root directory, I also give a yaml example here.
|
|
Generate a vscode debug file
Run the following command in the root directory.
|
|
The -args parameter above is filled with our yaml file above, the compilation waiting process is very long, my 8C16G machine took me almost an hour to get it done.
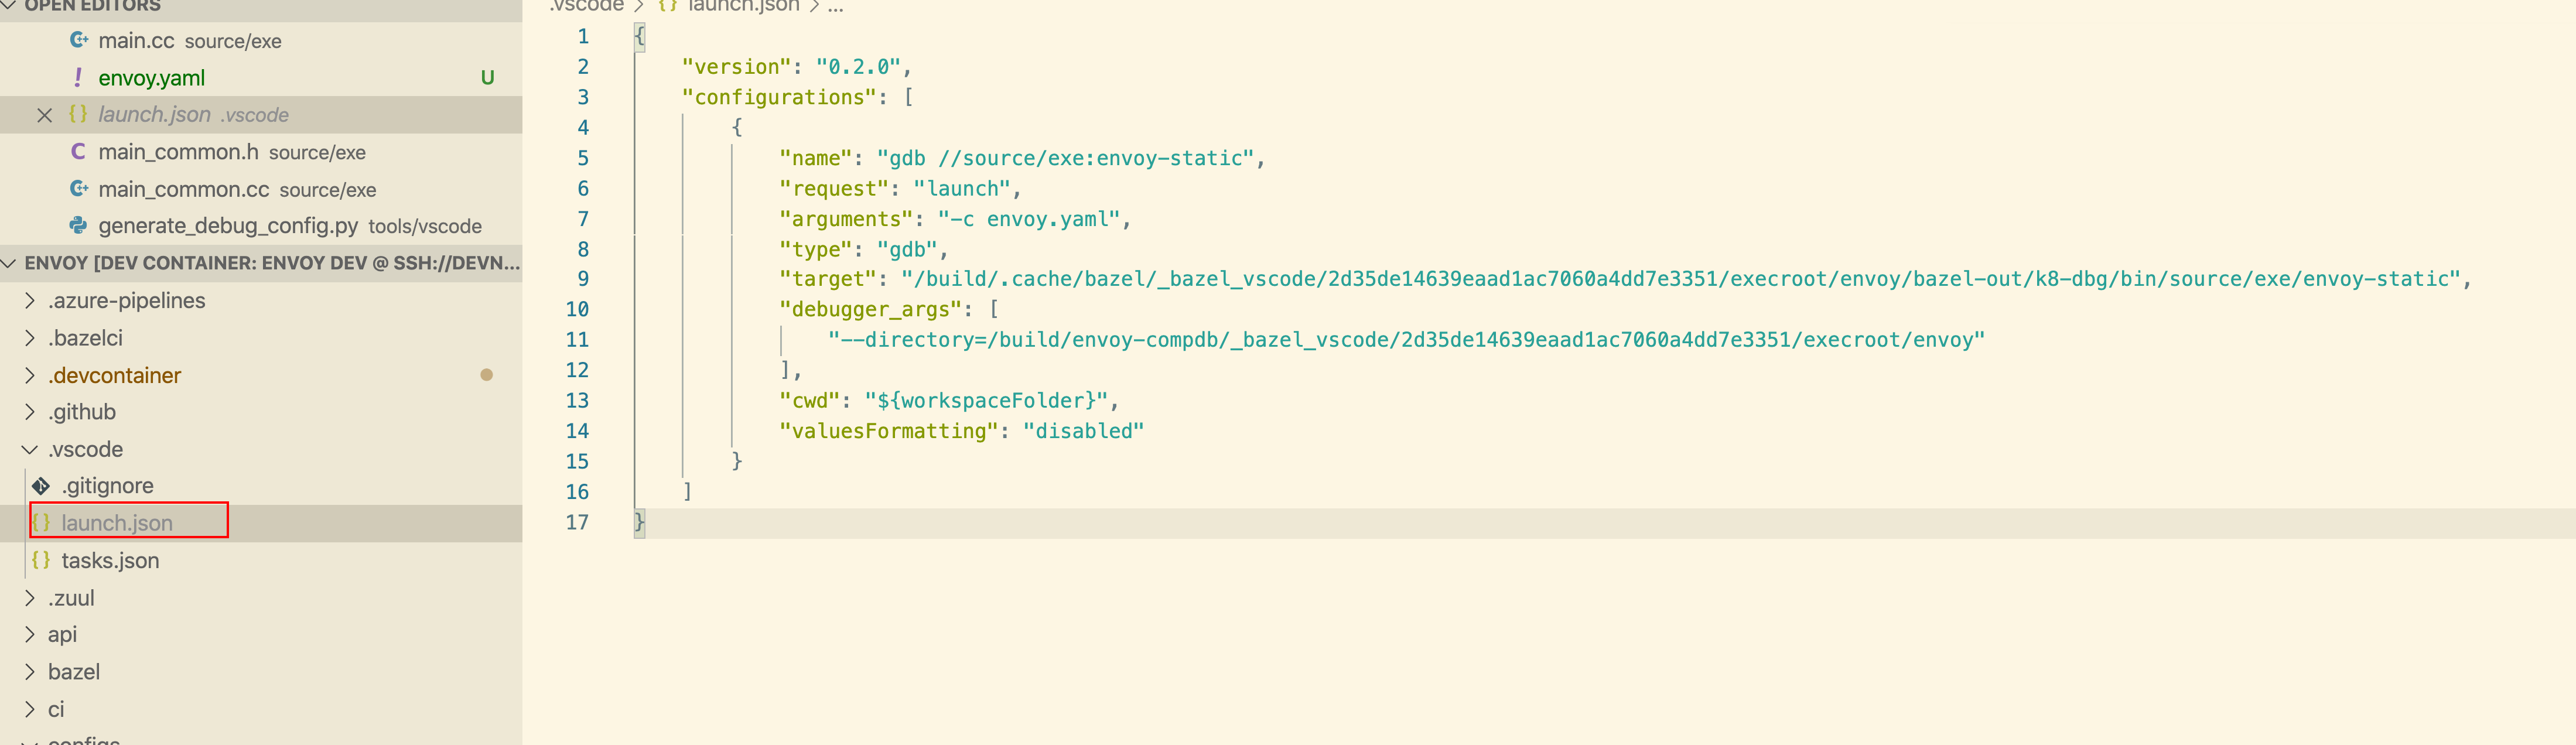
After running it, we can see that the launch.json file is generated for us.
Debugging
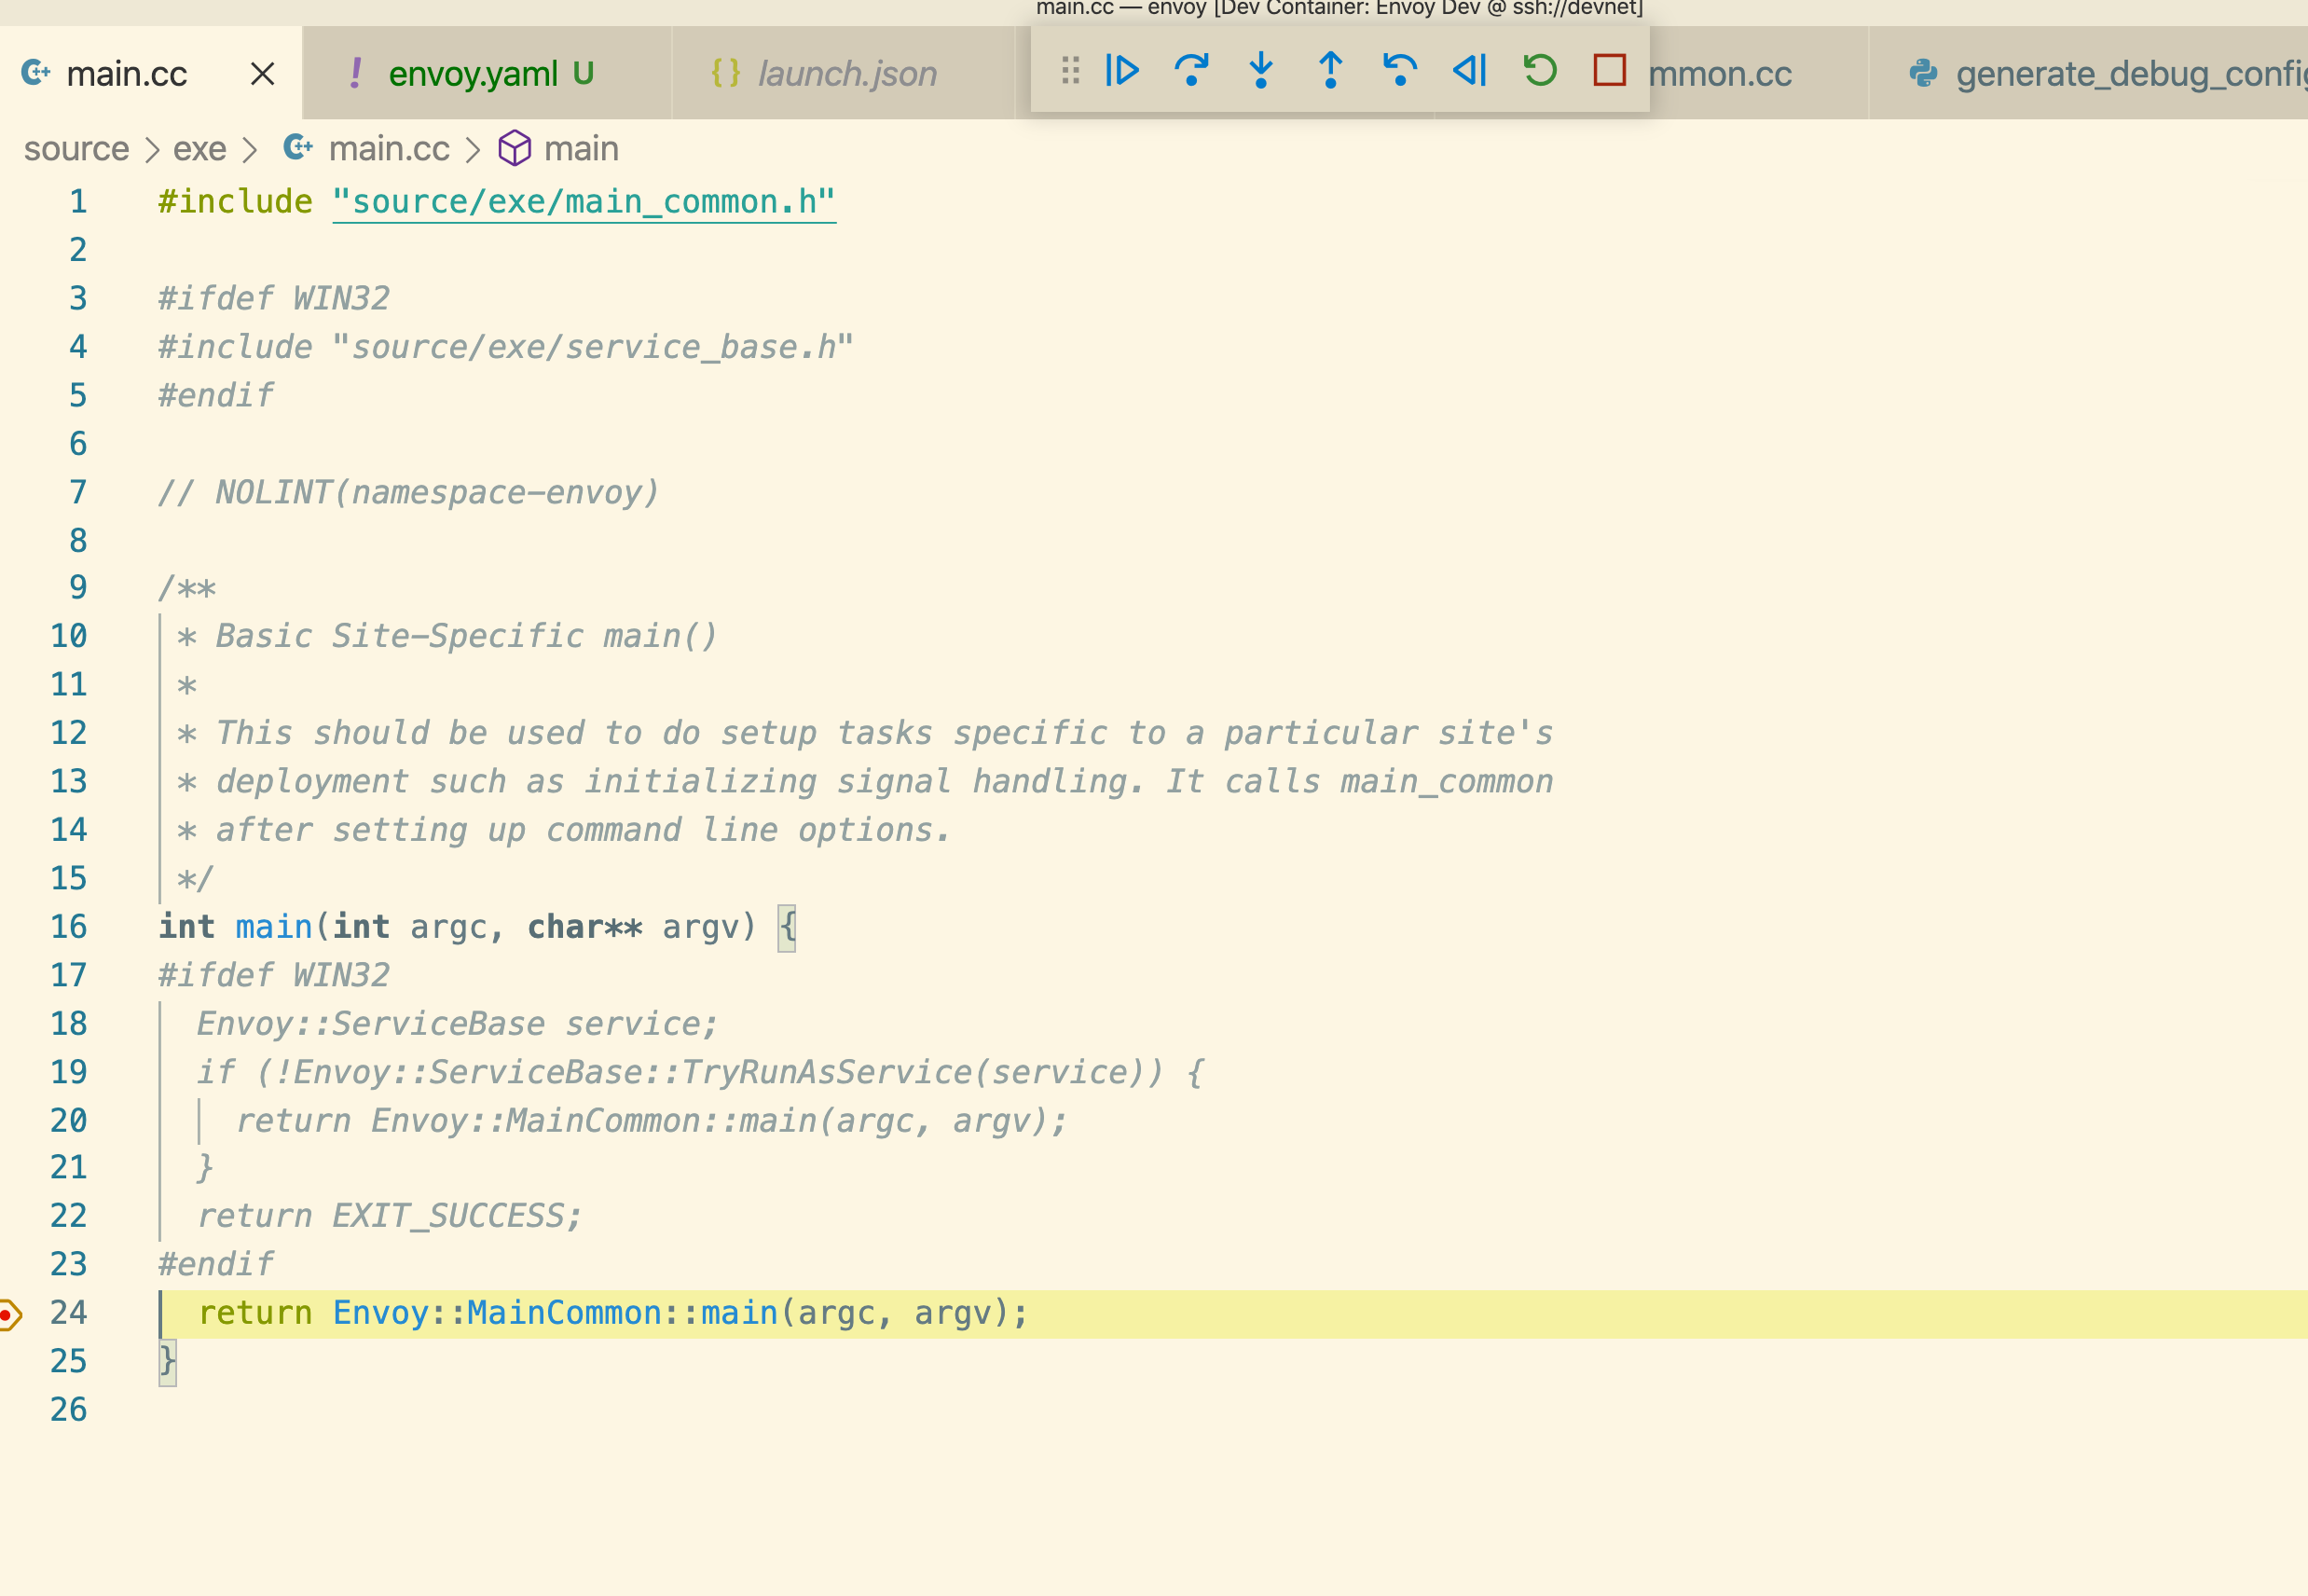
Then we press F5 and find that we can get to the breakpoint of our mian function without any problems.
At this point, our envoy development and debugging as one integrated environment is built, and then you can read the source code happily.