As you know, Kubernetes QOS is divided into three levels
- Guaranteed: Each container in a Pod must have a memory/CPU limit and a request, and the values must be equal. If a container specifies only a limit but not a request, the value of the request is equal to the limit value.
- Burstable: At least one container in the Pod has a memory or CPU request and does not satisfy the Guarantee level, i.e., the memory/CPU values are set differently.
- BestEffort: The container must not have any memory or CPU limits or requests.
Google’s best practices tell you to always configure Guaranteed for important services so that you can keep your important services from being evicted when resources are low.
Best practices require you to configure it this way from an operations and post-operations perspective. Teams are just starting out and will basically work fine without setting resource requests and limits, but as your team and project grows, you will start to run into stability issues. Services interact with each other and it may be time to add limits to services and save yourself from many headaches.
It should already be clear here that by following best practices, the entire cluster can be made more flexible and reliable.
But things get interesting when it comes to CPU limits, which are compressible resources. If your application starts to reach its CPU limit, Kubernetes will start limiting your containers. This means that CPUs will be artificially limited, making your application performance potentially worse!
1. Why is this?
Because when you set hard CPU limits in the container scheduler, the kernel uses the Complete Fairness Scheduler (CFS) Cgroup to enforce those limits. the CFS Cgroup mechanism uses two settings to manage CPU allocations: quota and period. When an application uses more than its allocated CPU quota for a given time period, it is limited until the next time period.
All CPU metrics for cgroup are located in /sys/fs/cgroup/cpu,cpuacct/<container> . The quota and period settings are located in cpu.cfs_quota_us and in cpu.cfs_period_us.

You can also look at the limit indicator cpu.stat. Inside cpu.stat you will find.
- nr_periods - the number of cycles that any thread of the cgroup can run
- nr_throttled - the number of runnable cycles for which the application uses its full quota and is limited
- throttled_time - controls the total time of each thread in the cgroup
2. As a simple example
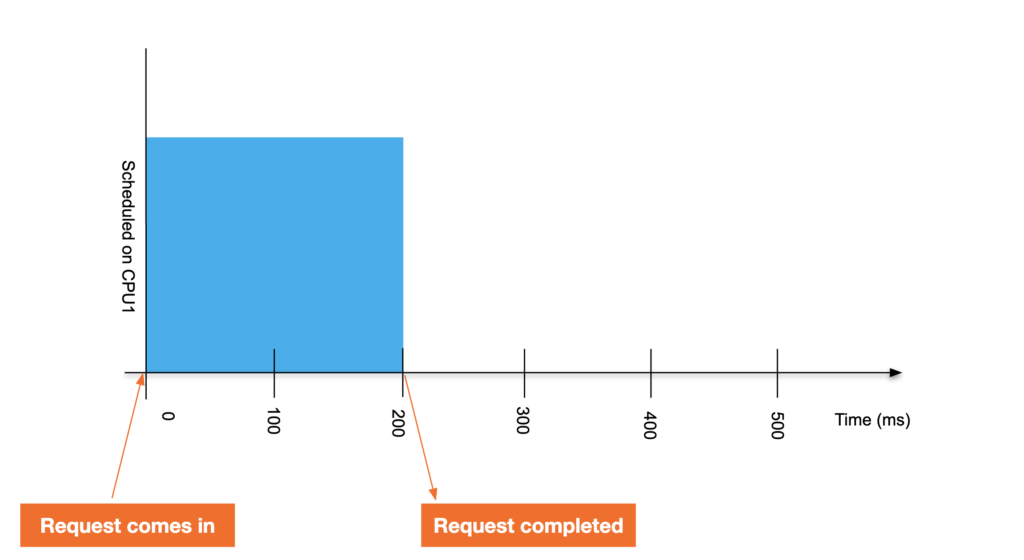
A single-threaded application runs on a CPU with a cgroup constraint. This application requires 200 milliseconds of processing time to complete a request. Unconstrained, its response looks like the following.
Now, suppose we assign a CPU limit of 0.4 CPU to the application. This means that the application gets 40 milliseconds of runtime for every 100 millisecond cycle - even if the CPU has no other work to do during that time. 200 millisecond requests now take 440 milliseconds to complete.
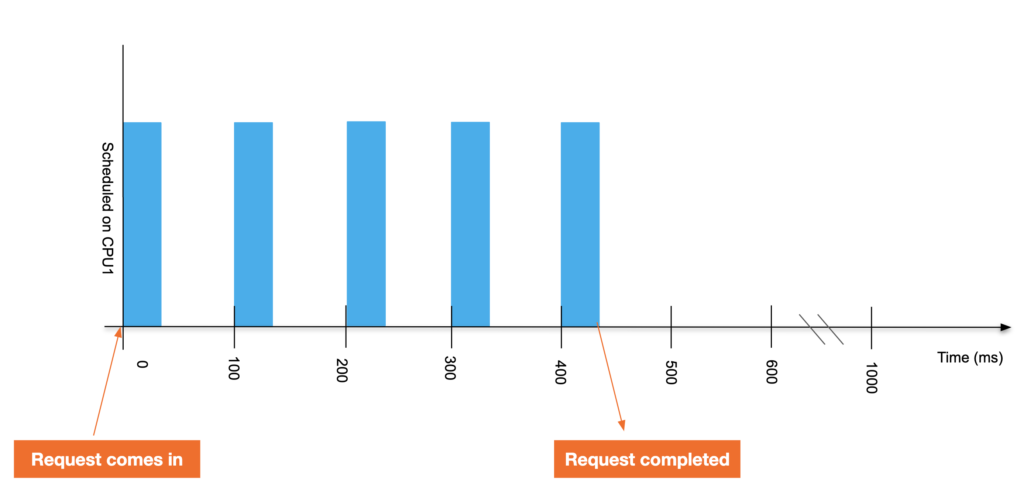
At this point you look at the cpu.stat throttled_time under the path of the container you are in and you will see that it is limited to 240ms (for every 100ms cycle the application can only run for 40ms and is limited to 60ms. It has been limited to 4 cycles, so 4 * 60 = 240 ms.)
To put it in layman’s terms, when you ask for 1 CPU, this means that your application can use 1 CPU core per second. If it is a single thread, it will be able to use one core all the time. However, if it has 2 threads, it can use 2 cores per second for an unlimited amount of seconds. So with this limit, it can fully use 2 cores for 1/2 second, and then it will be limited. (Although this isn’t really measured in seconds, it’s actually us, but I find it easier to understand that way).
Seeing this, you might say that this is just a constraint, and that resources that are out of range just can’t be used or they will be limited.
3. Is there an unnecessary limit
It’s not that simple. Many people have given feedback about unnecessary cgroup restrictions, even without CPU caps, and there are heated discussions here about
- https://github.com/kubernetes/kubernetes/issues/67577
- https://github.com/kubernetes/kubernetes/issues/51135
- https://github.com/kubernetes/kubernetes/issues/70585
- https://github.com/kubernetes/kubernetes/pull/75682
The key metric to check when running containers is throttling. This indicates how many times your container is limited. We have found that many containers are limited regardless of whether the CPU usage is close to the limit or not. The following is an example of feedback from an enthusiastic user.
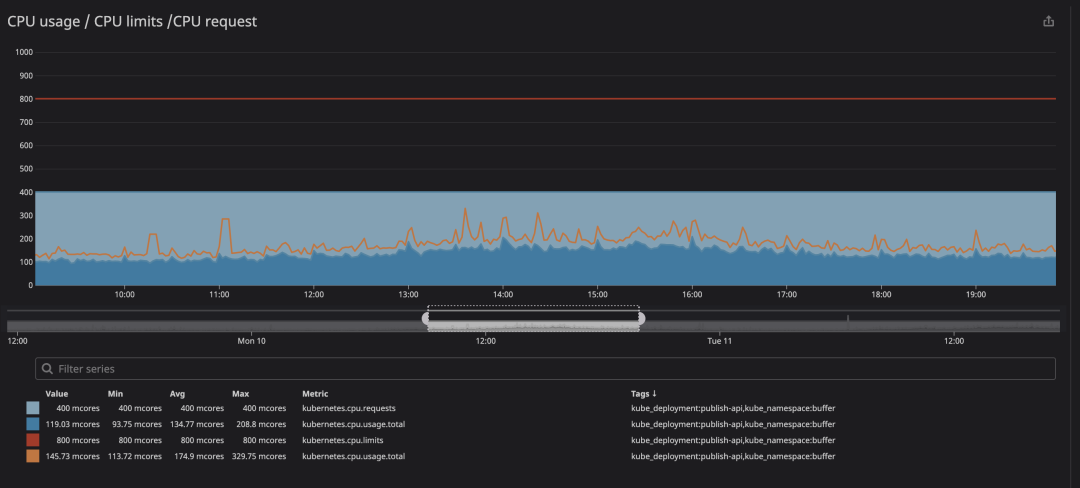
In the animation you can see that the CPU limit is set to 800m (0.8 cores, 80% of the cores) and the peak usage is up to 200m (20% of the cores). After seeing that, we might think we have enough CPU to get the service running before it throttles down, right? Now look at this.
You will notice that a CPU limit has occurred even if the CPU usage is below the CPU limit. The maximum CPU usage is not even close to the CPU limit.
Limiting means service performance degradation and higher latency.
4. What causes this?
Essentially, the problem is caused by the linux kernel, see this video for details: https://www.youtube.com/watch?v=UE7QX98-kO0
This video probably means something like this.
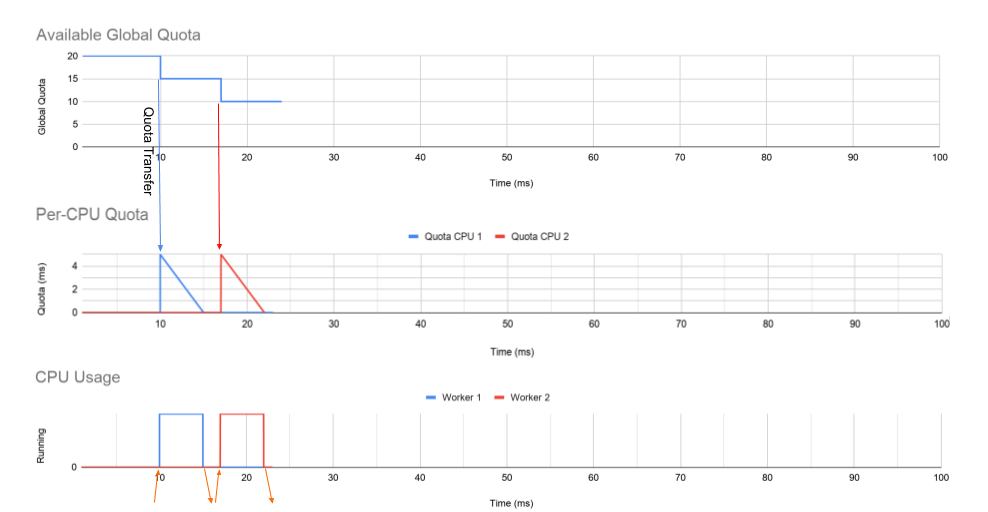
Here is an example of a multi-threaded daemon with two worker threads, each fixed to its own core. As you can see below, the first graph shows the global quota of the cgroup over a period of time. This starts with a quota of 20ms, which is associated with 0.2 CPUs. The middle graph shows the quota allocated to each CPU queue, and the bottom graph shows how long the actual worker threads run on their CPUs.
-
At 30 milliseconds
- Worker 1 has received a request.
- Worker 1 only needs 1 millisecond to process the request, and CPU 1 has 4 milliseconds left on each CPU storage bucket.
- Since there is time left on each CPU run queue, but no more runnable threads on CPU 1, a timer is set to return the slack quota to the global storage bucket. This timer is set to 7ms after worker 1 stops running.
-
at 38 ms
- The slack timer set on CPU 1 triggers and returns all but 1 ms of quota to the global quota pool.
- This leaves 1 ms of quota on CPU 1.
-
At 41 ms
- Worker 2 receives a long request.
- All remaining time is transferred from the global storage bucket to CPU 2’s per-CPU storage bucket, and Worker 2 uses all the time.
-
At 49 milliseconds
- Worker 2 on CPU 2 is now limited in the event that the request is not completed.
- This happens even though CPU 1 still has a 1ms quota.
While 1 millisecond may not have much impact on a dual-core machine, these milliseconds add up on a high core count machine. If we encounter this behavior on an 88-core (n) machine, we could be spending 87 (n-1) milliseconds per cycle. That’s 87 milliseconds or 0.87 CPUs (per Container) that may not be available. This is how we reach low quota usage by over-throttling. In the best case, if the fix increases the available CPU per instance of the affected application by 0.87, or the required CPU quota is reduced accordingly. These benefits will increase application density and reduce application response time in our cluster.
This issue went largely unnoticed when it came to 8-core and 10-core machines. Now that core counts are all the rage, the problem is becoming more pronounced. This is why we have noticed an increase in limitations when running the same application on a higher core count machine.
To summarize, the clock deviation limit is a problem, which leads to a strict quota limit for each period. This problem has always existed, and it has worked this way at least since the 512ac999 commit and kernel v4.18.
5. How the linux kernel solves this problem
Pre-patched code expires at runtime if and only if the per CPU expiration time matches the global expiration time cfs_rq->runtime_expires ! = cfs_b->runtime_expires . By testing the kernel, I proved that this almost never happens on my node. Therefore, that 1 millisecond never expires. The patch changed this logic from being based on clock time to cycle sequence counting, fixing a long-standing bug in the kernel. The code is as follows.
Modification issues are part of the 5.4+ mainline kernel. They have been backported to many of the available kernels.
- Linux-stable: 4.14.154+, 4.19.84+, 5.3.9+
- Ubuntu: 4.15.0-67+, 5.3.0-24+
- Redhat Enterprise Linux:
- RHEL 7: 3.10.0-1062.8.1.el7+
- RHEL 8: 4.18.0-147.2.1.el8_1+
- CoreOS: v4.19.84+
The bug https://git.kernel.org/pub/scm/linux/kernel/git/torvalds/linux.git/commit/?id=763a9ec06c4 has been fixed and merged into the kernel of Linux distributions running 4.19 or later.
However, in reading the kubernetes issue https://github.com/kubernetes/kubernetes/issues/67577, we can see that various Linux projects have been referencing this issue, so I guess some Linux distributions still have this bug and are working on integrating a fix. and are working on integrating a fix.
If your Linux distribution has a kernel version lower than 4.19, I suggest you upgrade to the latest Linux distribution for your node, but in any case, you should try to remove the CPU limit and see if there are any limitations.
6. Summary
Monitor your containers for poor performance due to throttle, if it does happen, it is best to solve it by upgrading the kernel version in batches, if that is not possible, you can do the following.
unrestricted (personally, I don’t think this is a good idea)
- Pods with performance requirements are scheduled to nodes with specific taint.
- Remove CPU limits for these Pods, consider adding limits at the namespace level.
add resources
Also CPU throttle throttling is mainly due to lower CPU limits. Its limits affect the behavior of Cgroups. Therefore, a quick solution to this problem is to increase the limit by 10-25% based on monitoring to ensure that spikes are reduced or avoided altogether.
Auto Scaling
Because setting CPU requests and limits to the same value usually gives people the behavior they expect, a simple solution to this problem is to set CPU requests and limits to the same value and add an HPA that allows Pods to automatically scale up and down based on load.