The well-known top command in Linux lists the utilization of system resources by each process. There are several fields VIRT , RES , SHR , CODE , DATA and so on, which describe the memory usage of the processes. (The last two are not displayed by default, you need to press the F key to bring up the relevant fields).
But what do they actually mean?
Documentation for the top command
Execute man top to view the top command’s manual. You can see the meaning of these fields.
VIRTVirtual Memory Size (KiB): all virtual memory used by the process; includes code, data, shared libraries, and parts that have been swapped out to the swap area and mapped but not yet used (not loaded into physical memory).RESResident Memory Size (KiB): All the physical memory occupied by the process, excluding the part that is swapped out to the swap area.SHRShared Memory Size (KiB): All the shared memory readable by the process, not all of which is contained inRES. It reflects the portion of memory that may be shared by other processes.CODECode Size (KiB): The amount of memory occupied by executable code in the physical memory occupied by the process. This is also known as the Text Resident Set (TRS).DATAData + Stack Size (KiB): The size of the physical memory occupied by the process, excluding the portion occupied by executable code. This is also known as the Data Resident Set (DRS).
But is it really so?
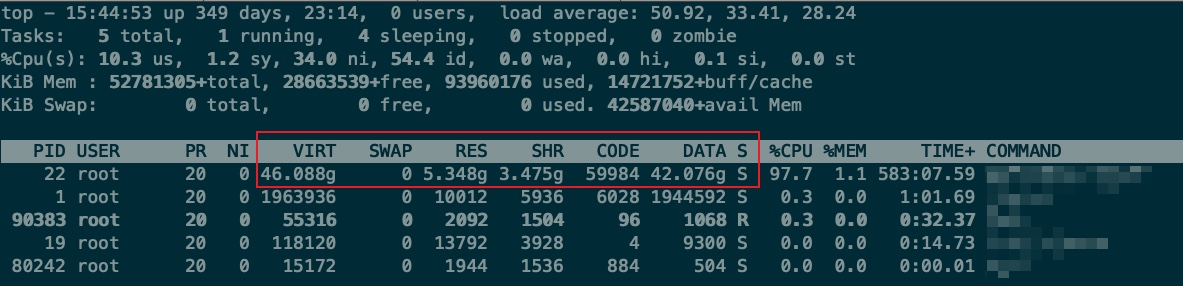
According to the manual of the top command, the equation CODE + DATA = RES should hold. But here, the process number 22 has CODE of 59,984 KiB, DATA of 42.076 GiB, and RES of 5.348 GiB, which obviously does not satisfy the above equation.
Data source for the top command
The top command reads data from /proc/<pid>/statm.
You can see it by
cat /proc/<pid>/statm. It has 7 columns,VIRT,RES,SHR,CODE, LRS,DATA, DIRTY in terms of memory pages, where LRS and DIRTY are no longer used since Linux 2.6. The size of a memory page is 4KiB, so multiplying the number of memory pages by 4 is the size of the memory footprint in KiB.
The data in /proc/<pid>/statm is read by the kernel function task_statm and then written to by procfs.
Let’s see how the kernel function task_statm is defined as follows.
|
|
Here get_mm_counter does nothing but ensure that the counter is read atomically - this is because it reads the physical memory footprint.
It follows that the equation CODE + DATA = RES does not necessarily hold, but the equation ANON = RES - SHR does. Here ANON represents the memory allocated on the heap.
get_mm_counteris defined inmm.h.
1 2 3 4 5 6 7 8 9 10 11 12 13 14static inline unsigned long get_mm_counter(struct mm_struct *mm, int member) { long val = atomic_long_read(&mm->rss_stat.count[member]); #ifdef SPLIT_RSS_COUNTING /* * counter is updated in asynchronous manner and may go to minus. * But it's never be expected number for users. */ if (val < 0) val = 0; #endif return (unsigned long)val; }As you can see,
get_mm_counterdoesn’t really do anything but ensure the atomicity of the read counter.
As you can see from the code
sharedis the sum of the physical memory page occupied by shared files and dynamic libraries; it corresponds toSHR.textis the memory page occupied by the code segment; it corresponds toCODE.datais the sum of the memory pages occupied byVM_WRITE & ~VM_SHARED & ~VM_STACKandVM_STACK, that is, the sum of all writable but non-shared memory pages in non-stack memory and stack memory pages; it corresponds toDATA.residentis the sum ofsharedand the entity anonymous memory page; it corresponds toRES.- return value is the entire virtual memory memory page; it corresponds to
VIRT.
From the code, VIRT , SHR , CODE , RES match the manual of the top command, the difference is in the DATA field - and from what we have observed, there is indeed an obvious problem with DATA.
The DATA Puzzle
In Linux, all that processes can see directly is virtual memory (virtual memory is somewhat different from physical memory).
For each virtual memory page, depending on whether it has a corresponding physical memory frame corresponding to it or not. There are three states.
- the page has no physical memory frame corresponding to it; noted as vm_unmapped.
- The page has a physical memory frame corresponding to it and has not been swapped out to the swap area; noted as vm_physic.
- the page has a physical memory frame corresponding to it, but has been swapped out to the swap area; noted as vm_swap.
Of the five fields discussed in this article, the following is recorded according to whether or not there is an emphasis on vm_physic.
| top Manuals | Kernel Code | |
|---|---|---|
| VIRT | x | x |
| RES | y | y |
| SHR | x | y |
| CODE | y | y |
| DATA | y | x |
As you can see, it is more clear that VIRT , RES and CODE. In the case of SHR, it is also easy to understand that the kernel code clearly contains only the physical memory part, while TOP is not specified in the manual, so we understand it as containing only the physical memory part as well.
Now, all we need to confirm is DATA. Let’s look at the implementation of DATA.
|
|
where mm is a Linux memory descriptor defined in linux/mm_types.h, which is a rather large structure. Where data_vm and stack_vm are defined as follows.
Here, it is clear that the suffix vm indicates Virtual Memory, so it is clear that DATA indicates more than just physical memory usage. The next question is, what do the comments here indicate? Macros such as VM_WRITE, defined in linux/mm.h. These macros represent properties of the Virtual Memory Area (vm_area), represented by some one-hot integer. Thus, VM_WRITE & ~VM_SHARED & ~VM_STACK represent non-stacked and non-shared writable virtual memory areas. So the DATA field expresses the sum of the non-shared writable areas in the stack and non-stack regions of virtual memory.
This explains why DATA appears to be much larger than RES. This is because RES is the actual size of the physical memory occupied, while DATA calculates the size of the virtual memory occupied by the data part. The latter may contain a lot of virtual memory pages that are not actually mapped to physical memory frames, thus making it look inflated.
Summary
The manual for top is wrong and buggy regarding DATA, updated as follows.
VIRTVirtual Memory Size (KiB): all virtual memory used by the process; includes code, data, shared libraries, and swap out to swap area and mapped but not used (not loaded into physical memory). The following is a list of the parts that have not been used (not loaded into physical memory).RESResident Memory Size (KiB): all physical memory occupied by the process, excluding the part that is swapped out to the swap area.SHRShared Memory Size (KiB): all shared physical memory readable by the process, not all of which is contained inRES. It reflects the portion of memory that may be shared by other processes.CODECode Size (KiB): The amount of memory occupied by executable code in the physical memory occupied by the process. This is also known as the Text Resident Set (TRS).DATAData + Stack Size (KiB): The sum of the non-shared writable areas in the stack and non-stack areas of the virtual memory occupied by the process.
The equation CODE + DATA = RES does not necessarily hold, but the equation ANON = RES - SHR and the inequality ANON <= DATA (vm_physic) <= DATA do. If it is observed that RES - SHR is growing while the program is running steadily, it may indicate a memory leak in the program.