Although the title says SSL performance testing, it doesn’t really matter if it’s SSL or not, it’s just that the configuration of the test is different. We should focus more on the general principles of performance testing than on the testing methodology of a specific metric. The specific test metrics may vary with the test business and test environment, but the core test methodology is the same.
Since I am familiar with SSL performance testing, I will share the three main metrics of SSL performance testing: new connections per second, maximum throughput, and maximum number of connections.
Performance Testing Methodology
Proactive Testing
This is at the top of the list because it is so important.
Proactive testing, as opposed to reactive testing. Most people do performance testing by running a command or script and then reading the results and that’s it. This type of testing is typically reactive testing.
Passive testing: You want to test A, but you actually test B and end up with the conclusion that you tested C.
Passive testing often leads to all kinds of problems, drawing wrong conclusions based on wrong results, and then making wrong judgments and choices. What’s worse is that the testers themselves don’t realize it.
Proactive testing can help you test exactly what you really want and understand the results correctly. The little extra effort you put in at the beginning can save you much more time and even money later.
So what is considered active testing? Ask yourself the following two questions.
- can you confirm that what you are testing is the real test target?
- Can you explain the results of the test, i.e. what is the bottleneck?
So proactive testing is not a matter of running a command and then everything is fine and you can go have coffee, but you need to analyze before, during and after the test. And proactive testing is usually not done at once. Depending on the test situation, you may need to make continuous adjustments to the test environment, test tools, etc.
- Pre-test:
- Clarify what you are testing, i.e., what exactly you are testing. This is critical. You must clearly know what you are testing in order to adopt a reasonable configuration and make the right analysis judgment. All the later configuration modifications and analysis adjustments serve this testing goal: to make the test value as close to the ideal value as possible.
- You need to understand your test tool and know how it works. Usually the testing tools we use are open source, and you can analyze them with the help of the source code.
- You need to analyze the configuration in advance, including your test environment, test objects, test tools, etc.
- Even if you analyze the configuration in advance, there may still be some missing or unknown, especially when you have little experience. That’s okay, because we are proactive testing, the problems will be exposed and discovered later in the test, and then you can break them one by one.
- In testing:
- Use other tools to confirm that you are testing the real target
- Analyze system conditions (e.g. CPU, memory, I/O, sockets, etc.) with the help of other tools to identify the real bottlenecks.
- If you find that what you are testing is not the real target, adjust it and start again.
- If the bottleneck is not as expected, you need to analyze and confirm the reason, and then restart the test after adjustment.
- After testing:
- Eventually you confirm that you have tested the real target and got a test value that can be reasonably interpreted. At this point it’s not as simple as recording this one value; a single number is meaningless; it’s only meaningful when augmented by your particular test environment, test configuration, and the evidence provided by other observation tools. So these are all part of the test results and need to be recorded and saved together.
- Attempt to perform optimization, which currently may require you to have sufficient knowledge of the test system or test objects.
Example
Let’s take the SSL new connection count test as an example and briefly describe the idea.
-
Pre-test:
- Determine the test object, because it is to measure the TPS of SSL new connections, so you need to make sure that the CPU is mainly consumed in the process of complete SSL handshake. In other words, tcp cannot be the bottleneck, no session reuse, http cannot be a long connection, the smaller the CPU consumption of the http layer business, etc.
- After investigation and research, we decided to use wrk as the test tool.
- Understand how its test model looks like and what each option represents.
- Modify the Nginx configuration to ensure that it is the correct target for testing. Because there are so many indicator items that affect performance, it is recommended that you can consider them in layers: nginx core, tcp layer, ssl layer, http layer, etc. The resource limit class is usually configured at the system level and at the process level, with the process level not exceeding the system. Nginx is configured at the process level, so you need to make sure that the system one is set large enough.
- Since SSL new connections also involve TCP new connections, the kernel network related parameters also need to be looked at, especially those related to the TCP build and break phases, such as backlog and timewait.
- As traffic increases, soft disruptions and NICs may become bottlenecks and need to be configured accordingly.
-
Under test:
- The confirmation test by packet capture is SSL New Connection. If you are lazy and ignore this step, you may not find out that it is actually reusing sessions by default. Or the two-way authentication test becomes a one-way authentication, or it gets stuck on tcp connection establishment, etc.
- By observing the system conditions (CPU, memory, IO, sockets, etc.) through tools, you may find that the TPS does not go up to a certain value, while the CPU is not full. At this point, you need to use various tools to analyze and troubleshoot, and the reasons may be various. It may be that your worker’s maximum number of connections is set too small, the backlog may be set too small, the client pressure may not be enough, there may be a 100 megabit switch in the network, or the timewait may be the reason, if there is a backend may also be the backend to the bottleneck.
- After locating the problem and adjusting accordingly then retesting, you may find new problems and bottlenecks and just keep optimizing and iterating. Eventually you may find that the CPU on the server side is full, which is expected since the SSL handshake is a CPU-intensive operation. If you can, it is best to do a sampling of the system to see where the CPU is being consumed in the flame chart and if there are any anomalies.
-
Post-test:
- After several tuning attempts, you finally think the test value is close enough to the real value. This test value, along with the test environment, test configuration, and observed evidence, make up the final test result.
Some Suggestions
Some common suggestions are given next. Following these suggestions may seem to increase the workload, but in fact will eventually improve your efficiency, reduce the possibility of errors and detours, and also facilitate subsequent reproduction and look-back, and save a lot of repetitive work the next time you conduct similar tests.
- Record in as much detail as possible
- Record hardware and software configurations
- Save and organize test results
- Write down command line calls to avoid manual input each time
- Record queries and researched documents and urls, etc.
- Automate repetitive tasks
- Automate as many test tasks as possible to reduce both the possibility of errors and the testing burden
- Try to use low overhead tools
- Make our test values closer to the real values
- Use multiple tools
- May need to use multiple tools for cross-validation when necessary to rule out problems with the tools themselves
- Define baselines and targets
- A single value usually doesn’t mean much, not knowing if it’s good or bad, no comparison is harmless
- Separate the problem, compare, and control variables
- This is the basic idea of locating the problem
- You need to re-run the full test after doing the optimization
- Because of uncertainty about whether it will negatively affect other projects
Key configuration sorting
Let’s start with the key configurations in general
SSL new connection
Server-side tuning
-
nginx configuration
- cpu affinity
- file handle restrictions
- backlog, reuseport, deferred
- tcp_nopush/tcp_nodelay
- SSL full handshake, no session reuse, HTTP short connections
-
kernel parameters (mainly backlog, timewait, file handle restrictions)
-
irq binding
Client-side tuning
- kernel parameters (major timewait, file handle limits, ports)
- irq binding
- configure multiple ip addresses (as needed, such as insufficient number of ports or load balancing needs)
Throughput
Just need to make slight adjustment on the basis of SSL new connection
- change the server side to http long connection, long connection timeout time is set large
- client request also change to long connection, request 1MB large file
Maximum concurrency
The maximum concurrency is mainly memory related and limited by the total memory of the machine. If you want the maximum concurrency to be as high as possible, you need to reduce the size of the various buffers and set the timeouts to be larger, because the maximum concurrency usually takes a long time to test.
- http long connection
- increase worker_connections to the target value
- each timeout time is set large (recv/send)
- each buffer is set small (tcp/ssl/http)
- long client connections, requesting small files, limiting the pressure to a small value (you can use wrk2’s
-Roption)
The next sections are described in detail, and the related configuration files and scripts etc. can be found in the Git repository ssl-perf-test.
It is important to remind that the configuration of the test is not set in stone, but needs to be reasonably configured on the basis of understanding the meaning of the configuration and combining it with your own testing needs.
Configuration details
Nginx Configuration
The following is the main configuration nginx-tps.conf for testing new SSL connections.
|
|
main
- worker_processes, generally set to auto, will automatically be set according to the number of CPU cores on the system
- worker_cpu_affinity, generally auto will do, it will automatically bind one core per process
- worker_rlimit_nofile, set the maximum number of files the process can open, the bottom is set to RLIMIT_NOFILE, can not exceed the hard nofile
- worker_priority, set the priority of the process, similar to what the nice command does, the smaller the value the higher the priority.
- error_log, the log configuration is also listed in the note is to remind you not to forget to modify
event
- worker_connections, the number of process connections must be sufficient, but do not set it to a very large value, because the memory of these connections is allocated at startup and may lead to a lack of memory. Also mention that this is the number of connections for the entire worker, including downstream and upstream.
- multi_accept, by default, when closed, the process accepts one connection at a time; when open, the process accepts all connections that are ready at once. This configuration needs to be chosen based on the specific test scenario, and is generally left off by default.
- Accept_mutex, when open, each worker takes turns receiving new connections, when closed, all workers are notified of new connections (the so-called swarm effect). If the number of new connections is small, it can waste system resources. Note that when using reuseport there is no need for this configuration, because the kernel has already done the load balancing. Whether this configuration is turned on or not needs to be determined based on actual load conditions.
http
- access_log, logging is generally selected off for performance testing
- listenlisten, which has many additional parameters and can be configured with some socket options
- reuseport, corresponding to the
SO_REUSEPORToption, where multiple worker processes create independent listening sockets, allowing the kernel to load balance the connected connections between worker processes. - deferred, corresponding to
TCP_DEFER_ACCEPToption, can defer the connection ready time, only when receiving application data from the client can accept, can slightly reduce the server side overhead. - backlog, set the listen full connection queue size, cannot exceed the system
net.core.somaxconnlimit. This needs to be large enough, otherwise it will affect the speed of new connections.
- reuseport, corresponding to the
- keepalive_requests/keepalive_time, which set the maximum number of requests and timeout time for http long connections respectively, and choose whether to start them according to the actual test index.
- sendfile, whether or not to use the sendfile() system call, you can directly send the file in the kernel, no need to go to the user state to transfer the first hand
- tcp_nopush, turn this on only when sendfile is used, corresponds to
TCP_CORKoption on Linux, the response header and the beginning of the file are sent in one packet, the file is sent in a full packet to improve network efficiency. - tcp_nodelay, corresponding to
TCP_NODELAYoption, this option is for Nagle algorithm (before the sent data is acknowledged, save the new small data first and wait until a full MSS is made up or an acknowledgement is received from the other side before sending). - linger_close/linger_time/linger_timeout, these control whether to wait and process additional data before closing the server-side connection, and how long to wait.
- ssl_session_cache/ssl_session_timeout/ssl_session_tickets, which control whether SSL session reuse is enabled and the timeout, as determined by test metrics
- ssl_verify_client/ssl_client_certificate, whether to perform SSL two-way authentication, depending on the test requirements
- ssl_buffer_size, the size of SSL buffer when sending data, we know the larger the data block length, the faster the symmetric encryption, so this default value is larger. However, if you are concerned about the first byte arrival time, it is better to change this configuration to a smaller one.
- proxy_cache/proxy_cache_path, static files using cache can improve performance
- client and proxy buffer, depending on the application data and the actual network conditions, client and proxy buffer related configuration may also affect the performance.
Kernel parameters and network configuration
The kernel has a lot of network and tcp related parameters, the most important ones for our tests are backlog, timeout, file handle and port. I generally modify these parameters as follows. If your tests have other needs or encounter other bottlenecks, you can add and modify them.
|
|
In order to restore the system configuration after testing, it is recommended to save the original configuration before modifying it. I have written a simple script in tune.sh that will automatically execute store.sh to save the configuration you are going to modify in recover.sh, and execute recover.sh to restore the original configuration after the test is completed.
Note that the client and server-side concern parameters are not exactly the same, for example, the server side generally does not require the number of ports, the client does not require the backlog. In general, it is not a big problem to change all of them directly for convenience.
Client virtual ip
Sometimes the client may need more than one ip address for testing, the following script setip.sh sets the corresponding number of ip addresses on a NIC according to the number of CPU cores of the test machine.
|
|
Deleting IPs can be done with the corresponding script delip.sh.
Client testing scripts
The client here uses wrk2, and several simple scripts are written to facilitate testing. test-tps.sh is used to test new connections, test-tpt.sh is used to test throughput, test-max.sh is used to test maximum concurrent connections, and test-rps.sh is used to test HTTP services with long connections. The following are scripts for new connections, and several others are similar.
|
|
To maximize client performance, we used taskset to bind each wrk2 process to a separate CPU to reduce the overhead from context switching. However, this prints a test result for each wrk2 instance, which is not convenient for viewing and counting, so a script test.sh was written to automatically calculate the sum.
The usage is as follows, just specify the specific test (tps|tpt|max|rps) in the parameter.
|
|
Server-side NIC bonding
Sometimes the traffic on a single NIC reaches a bottleneck and it may be necessary to bond multiple NICs to double the traffic. The following script binds 4 NICs, eth2, eth3, eth4, eth5, to bond0.
Here both server and client are set to mode 0, i.e. roundrobin mode load balancing.
|
|
For bonding you can refer to here.
NIC Queuing and irq
In practical testing, you may find that the si on some individual CPUs is particularly high and becomes a performance bottleneck. This is when you need to allocate the NIC queue to different CPU cores for soft interrupt handling. If the client encounters a similar problem, then a similar operation is required.
To facilitate testing, I wrote a script irqbind.sh to automatically perform the binding of NIC interrupt numbers and RPS settings, which is used as follows.
The following describes the process of doing the setup manually to get an idea of the operation in the script.
NIC interrupt number binding to CPU
The irqbalance service can bind the interrupt number for you, but it changes dynamically. If you are not satisfied with the effect of irqbalance, or want to bind it statically, you can also do it manually by yourself. The operation steps are as follows.
-
cat /proc/interruptsCheck the interrupt number of the corresponding NIC. 218-249 below is the interrupt number corresponding to eth11, the NIC with 32 queues1 2 3 4 5 6 7 8 9 10 11218: 17094773 0 0 0 0 0 0 0 0 0 0 0 0 0 0 0 14 22 0 0 0 0 12697 0 0 0 0 0 0 0 0 0 IR-PCI-MSI-edge eth11-TxRx-0 219: 3119 13271410 0 0 0 0 0 0 0 0 0 0 0 0 0 0 0 0 0 0 0 0 0 0 0 0 0 0 0 0 0 0 IR-PCI-MSI-edge eth11-TxRx-1 220: 2385 0 13265837 0 0 0 0 0 0 0 0 0 0 0 0 0 0 0 0 0 0 0 0 0 0 0 0 0 0 0 0 0 IR-PCI-MSI-edge eth11-TxRx-2 221: 23 0 0 13290114 0 0 0 0 0 0 0 0 2064 0 0 0 0 0 0 0 0 0 0 0 0 0 0 0 0 0 0 0 IR-PCI-MSI-edge eth11-TxRx-3 ... ... 245: 0 23 0 0 0 0 0 0 0 0 0 0 0 0 0 0 0 5 2000 6603326 0 0 0 0 0 0 0 149556 0 0 0 0 IR-PCI-MSI-edge eth11-TxRx-27 246: 0 23 0 0 0 0 0 0 0 0 0 0 0 0 0 0 0 0 0 0 0 0 0 0 0 0 0 5 6869437 0 0 2000 IR-PCI-MSI-edge eth11-TxRx-28 247: 0 23 0 0 0 0 0 0 0 0 0 0 0 0 0 0 0 0 0 0 0 0 0 0 0 0 5 0 0 6846871 2000 0 IR-PCI-MSI-edge eth11-TxRx-29 248: 0 23 0 0 0 0 0 0 0 0 0 0 0 0 0 0 0 0 0 0 0 0 0 0 0 5 0 0 0 2000 6937093 0 IR-PCI-MSI-edge eth11-TxRx-30 249: 0 23 0 0 0 0 0 0 0 0 0 0 0 0 0 0 0 0 0 0 0 0 0 0 5 0 0 0 2000 0 0 6837127 IR-PCI-MSI-edge eth11-TxRx-31 -
Next, bind the interrupt number to the CPU core
In the example, interrupt number 218 is bound to CPU number 1, and so on.
1 2 3 4 5 6 7 8 9 10 11 12 13 14 15 16 17 18#!/bin/bash echo 00000001 > /proc/irq/218/smp_affinity echo 00000002 > /proc/irq/219/smp_affinity echo 00000004 > /proc/irq/220/smp_affinity echo 00000008 > /proc/irq/221/smp_affinity echo 00000010 > /proc/irq/222/smp_affinity echo 00000020 > /proc/irq/223/smp_affinity echo 00000040 > /proc/irq/224/smp_affinity echo 00000080 > /proc/irq/225/smp_affinity # ... echo 01000000 > /proc/irq/242/smp_affinity echo 02000000 > /proc/irq/243/smp_affinity echo 04000000 > /proc/irq/244/smp_affinity echo 08000000 > /proc/irq/245/smp_affinity echo 10000000 > /proc/irq/246/smp_affinity echo 20000000 > /proc/irq/247/smp_affinity echo 40000000 > /proc/irq/248/smp_affinity echo 80000000 > /proc/irq/249/smp_affinity
RPS
Sometimes your NIC does not support multiple queues, or the number of queues is less than the number of CPU cores, or the number of RX queues in the NIC’s Indirection Table is less than the number of CPU cores, so you need to use the kernel’s RPS/RFS mechanism to reallocate at the software level. For example, in the following example, the maximum number of RX queues in the NIC’s indirect table is only 16.
|
|
Setting to a value greater than 16 will fail.
At this point, the 16 rx queues can be redistributed to the 56 cores using RPS.
|
|
The diagram nicely depicts what happened above.
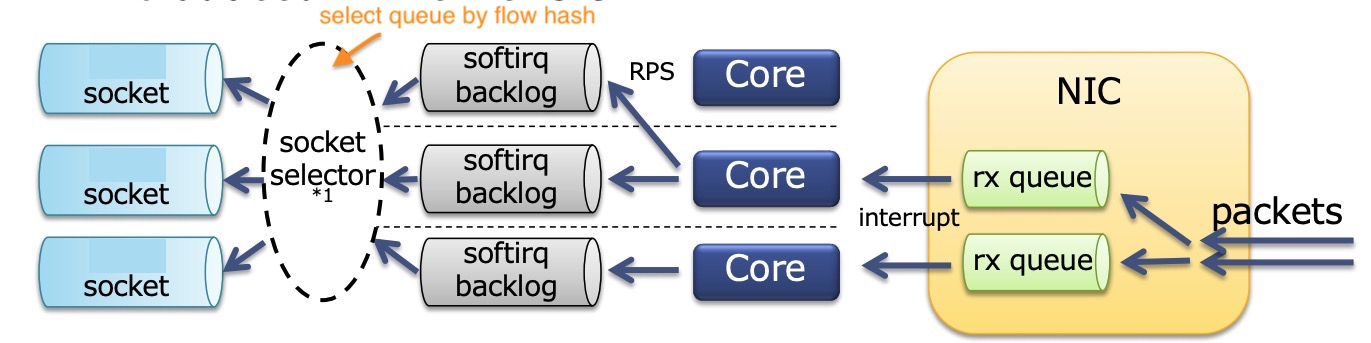
The NIC receives packets to multiple queues, then binds the queue interrupt number to the CPU core, and if the CPU is not fully utilized, assigns it to another CPU core again with the help of RPS. Each CPU core has a ksoftirqd working on it. SO_REUSEPORT solves the socket contention problem, each process has a separate socket, and by default it does a hash of the data stream (source and destination ip port numbers) to choose the socket to send it to. but there is actually a bit of competition in this place, the same The Linux kernel has supported SO_ATTACH_REUSEPORT_CBPF/EBPF since version 4.5, which allows you to select a socket based on the core number to eliminate the competition here in softirq, with the CPU affinity binding of the process to maximize the performance. However, Nginx does not currently support this option.