VictoriaMetrics (VM) is a highly available, cost-effective and scalable monitoring solution and time series database for long-term remote storage of Prometheus monitoring data.
Compared to Thanos, VictoriaMetrics is primarily a horizontally scalable local full-volume persistent storage solution, VictoriaMetrics is more than just a temporal database, its advantages are mainly reflected in the following points.
- External support for Prometheus-related APIs, which can be used directly in Grafana as a Prometheus data source
- High performance and scalability for metric data ingestion and querying, up to 20 times better than InfluxDB and TimescaleDB
- Memory is also optimized for processing high-base time series, 10x less than InfluxDB and 7x less than Prometheus, Thanos, or Cortex
- High-performance data compression that can fit up to 70x more data points into limited storage compared to TimescaleDB, and 7x less storage than Prometheus, Thanos or Cortex
- It is optimized for storage with high latency IO and low IOPS
- Provides a global query view where multiple Prometheus instances or any other data source may ingest data into VictoriaMetrics
- Simple operation
- VictoriaMetrics consists of a small executable with no external dependencies
- All configuration is done with explicit command line flags and sensible defaults
- All data is stored in the directory pointed to by the - storageDataPath command line argument
- Easy and fast backup from live snapshots to S3 or GCS object storage using the
vmbackup/vmrestore tool
- Support for fetching data sources from third-party chronological databases
- Due to the storage architecture, it protects the storage from data corruption in case of abnormal shutdown (i.e. OOM, hardware reset or kill -9)
- Also supports relabel operations for metrics
Architecture
VM is divided into single node and cluster solutions, choose according to business needs. Single-node version directly runs a binary file both, the official recommendation is to collect data points less than 100w/s, recommended VM single-node version, simple and good maintenance, but does not support alarms. The cluster version supports horizontal data splitting. The following diagram is the official architecture of VictoriaMetrics Cluster Edition.
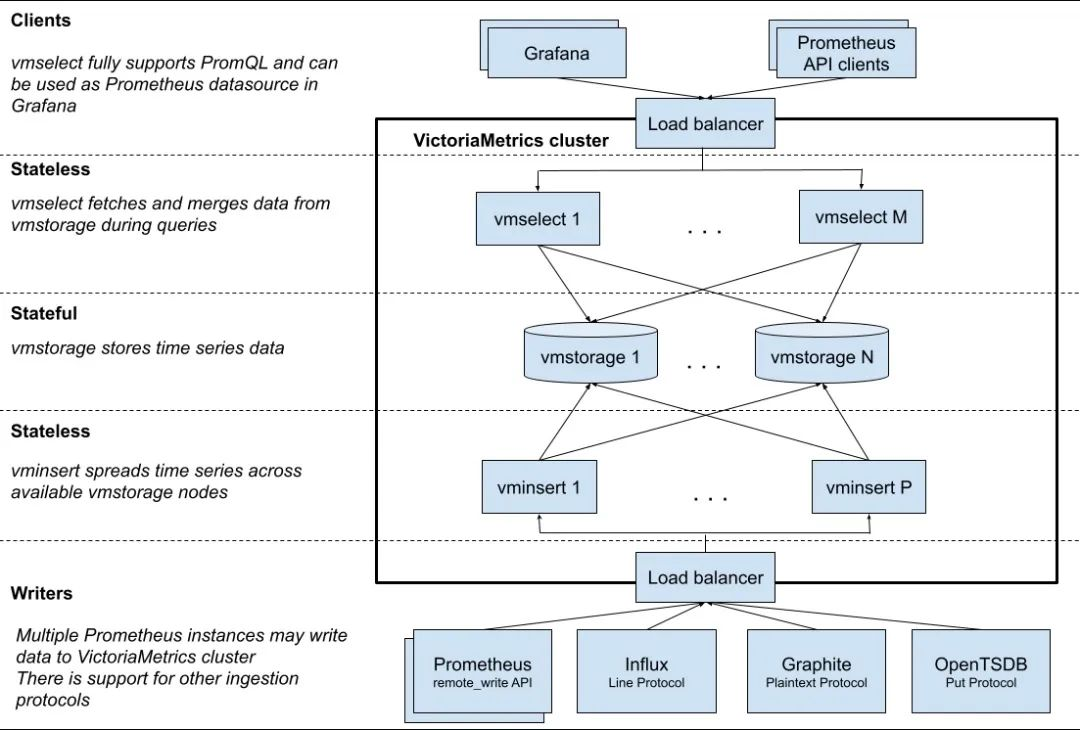
The main components include the following.
vmstorage : data storage and query result return, the default port is 8482vminsert : data entry, similar to slicing and replica functions, default port 8480vmselect : data query, aggregation and data de-duplication, default port 8481vmagent : data metrics crawling, supports multiple back-end storage, will occupy the local disk cache, default port 8429vmalert : alarm-related components, not if you do not need the alarm function can not use the component, the default port is 8880
The clustering solution splits the functionality into vmstorage, vminsert, vmselect components, and if you want to replace Prometheus, you also need to use vmagent, vmalert. as you can see from the above diagram vminsert and vmselect are stateless, so scaling is simple, only vmstorage is stateful.
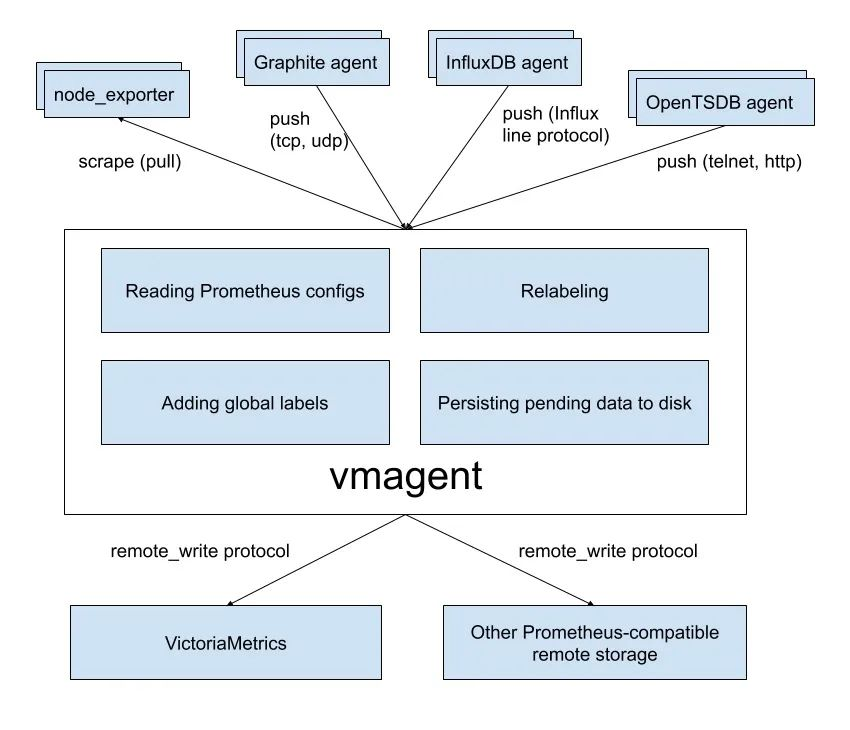
The main purpose of vmagent is to collect metrics data and store it in VMs and Prometheus-compatible storage systems (support for remote_write protocol is sufficient).
The following diagram shows a simple architecture of vmagent, which also implements the push function for metrics, in addition to many other features.
- Replaces the scraping target of prometheus
- Supports adding, removing, and modifying labels based on prometheus relabeling patterns, which makes it easy to filter data before it is sent to remote storage.
- Supports multiple data protocols, including influx line protocol, graphite text protocol, opentsdb protocol, prometheus remote write protocol, json lines protocol, csv data.
- Support for data collection and replication to multiple remote storage systems at the same time
- Supports unreliable remote storage (via local storage
-remoteWrite.tmpDataPath) and maximum disk footprint
- Uses less memory, cpu, disk io, and network bandwidth than prometheus
Next, we introduce the use of single-node and cluster scenarios for VMs respectively.
single-node
Here we collect node-exporter for example, first use Prometheus to collect data, then write Prometheus data remotely to VM remote storage, because VM provides vmagent component, finally we use VM to replace Prometheus completely, can make the architecture simpler and lower resource consumption This makes the architecture simpler and less resource intensive.
Here we run all resources under the kube-vm namespace.
1
|
☸ ➜ kubectl create ns kube-vm
|
First we run node-exporter under the kube-vm namespace using the DaemonSet controller, and the corresponding resource manifest file is shown below.
 1
 2
 3
 4
 5
 6
 7
 8
 9
10
11
12
13
14
15
16
17
18
19
20
21
22
23
24
25
26
27
28
29
30
31
32
33
34
35
36
37
38
39
40
41
42
43
44
45
46
47
48
49
50
51
52
53
54
55
56
57
58
59
60
61
62
63
64
65
66
67
68
69
70
71
72
73
74
75
76
77
|
# vm-node-exporter.yaml
apiVersion: apps/v1
kind: DaemonSet
metadata:
  name: node-exporter
  namespace: kube-vm
spec:
  selector:
    matchLabels:
      app: node-exporter
  template:
    metadata:
      labels:
        app: node-exporter
    spec:
      hostPID: true
      hostIPC: true
      hostNetwork: true
      nodeSelector:
        kubernetes.io/os: linux
      containers:
        - name: node-exporter
          image: prom/node-exporter:v1.3.1
          args:
            - --web.listen-address=$(HOSTIP):9111
            - --path.procfs=/host/proc
            - --path.sysfs=/host/sys
            - --path.rootfs=/host/root
            - --no-collector.hwmon # 禁用不需要的一些采集器
            - --no-collector.nfs
            - --no-collector.nfsd
            - --no-collector.nvme
            - --no-collector.dmi
            - --no-collector.arp
            - --collector.filesystem.ignored-mount-points=^/(dev|proc|sys|var/lib/containerd/.+|/var/lib/docker/.+|var/lib/kubelet/pods/.+)($|/)
            - --collector.filesystem.ignored-fs-types=^(autofs|binfmt_misc|cgroup|configfs|debugfs|devpts|devtmpfs|fusectl|hugetlbfs|mqueue|overlay|proc|procfs|pstore|rpc_pipefs|securityfs|sysfs|tracefs)$
          ports:
            - containerPort: 9111
          env:
            - name: HOSTIP
              valueFrom:
                fieldRef:
                  fieldPath: status.hostIP
          resources:
            requests:
              cpu: 150m
              memory: 180Mi
            limits:
              cpu: 150m
              memory: 180Mi
          securityContext:
            runAsNonRoot: true
            runAsUser: 65534
          volumeMounts:
            - name: proc
              mountPath: /host/proc
            - name: sys
              mountPath: /host/sys
            - name: root
              mountPath: /host/root
              mountPropagation: HostToContainer
              readOnly: true
      tolerations: # 添加容忍
        - operator: "Exists"
      volumes:
        - name: proc
          hostPath:
            path: /proc
        - name: dev
          hostPath:
            path: /dev
        - name: sys
          hostPath:
            path: /sys
        - name: root
          hostPath:
            path: /
|
Since we also created the node-exporter in the previous section, to prevent port conflicts, here we use the parameter --web.listen-address=$(HOSTIP):9111 to configure the port to 9111. Just apply the resource list above directly.
1
2
3
4
5
6
|
☸ ➜ kubectl apply -f vm-node-exporter.yaml
☸ ➜ kubectl get pods -n kube-vm -owide
NAME                  READY   STATUS    RESTARTS   AGE    IP              NODE      NOMINATED NODE   READINESS GATES
node-exporter-c4d76   1/1     Running   0          118s   192.168.0.109   node2     <none>           <none>
node-exporter-hzt8s   1/1     Running   0          118s   192.168.0.111   master1   <none>           <none>
node-exporter-zlxwb   1/1     Running   0          118s   192.168.0.110   node1     <none>           <none>
|
Then we redeploy a separate set of Prometheus, for simplicity we directly use static_configs static configuration to grab the node-exporter metrics, the configuration list is shown below.
 1
 2
 3
 4
 5
 6
 7
 8
 9
10
11
12
13
14
15
16
17
18
19
20
21
|
# vm-prom-config.yaml
apiVersion: v1
kind: ConfigMap
metadata:
  name: prometheus-config
  namespace: kube-vm
data:
  prometheus.yaml: |
    global:
      scrape_interval: 15s
      scrape_timeout: 15s
    scrape_configs:
    - job_name: "nodes"
      static_configs:
      - targets: ['192.168.0.109:9111', '192.168.0.110:9111', '192.168.0.111:9111']
      relabel_configs: # 通过 relabeling 从 __address__ 中提取 IP 信息,为了后面验证 VM 是否兼容 relabeling
      - source_labels: [__address__]
        regex: "(.*):(.*)"
        replacement: "${1}"
        target_label: 'ip'
        action: replace
|
The relabel operation in the above configuration extracts the IP information from the __address__, which can be used later to verify that the VM is compatible with the relabel operation.
To persist the Prometheus data, you also need to create a corresponding PVC resource object.
 1
 2
 3
 4
 5
 6
 7
 8
 9
10
11
12
13
14
15
16
17
18
19
20
21
22
23
24
25
26
27
28
29
30
31
32
33
34
35
36
37
38
39
40
41
|
# apiVersion: storage.k8s.io/v1
# kind: StorageClass
# metadata:
#   name: local-storage
# provisioner: kubernetes.io/no-provisioner
# volumeBindingMode: WaitForFirstConsumer
---
apiVersion: v1
kind: PersistentVolume
metadata:
  name: prometheus-data
spec:
  accessModes:
    - ReadWriteOnce
  capacity:
    storage: 20Gi
  storageClassName: local-storage
  local:
    path: /data/k8s/prometheus
  persistentVolumeReclaimPolicy: Retain
  nodeAffinity:
    required:
      nodeSelectorTerms:
        - matchExpressions:
            - key: kubernetes.io/hostname
              operator: In
              values:
                - node2
---
apiVersion: v1
kind: PersistentVolumeClaim
metadata:
  name: prometheus-data
  namespace: kube-vm
spec:
  accessModes:
    - ReadWriteOnce
  resources:
    requests:
      storage: 20Gi
  storageClassName: local-storage
|
Then create Prometheus directly, mount the above PVC and ConfigMap into the container, specify the path to the configuration file via the -config.file parameter, specify the TSDB data path, etc. The resource list file is shown below.
 1
 2
 3
 4
 5
 6
 7
 8
 9
10
11
12
13
14
15
16
17
18
19
20
21
22
23
24
25
26
27
28
29
30
31
32
33
34
35
36
37
38
39
40
41
42
43
44
45
46
47
48
49
50
51
52
53
54
|
# vm-prom-deploy.yaml
apiVersion: apps/v1
kind: Deployment
metadata:
  name: prometheus
  namespace: kube-vm
spec:
  selector:
    matchLabels:
      app: prometheus
  template:
    metadata:
      labels:
        app: prometheus
    spec:
      volumes:
        - name: data
          persistentVolumeClaim:
            claimName: prometheus-data
        - name: config-volume
          configMap:
            name: prometheus-config
      containers:
        - image: prom/prometheus:v2.35.0
          name: prometheus
          args:
            - "--config.file=/etc/prometheus/prometheus.yaml"
            - "--storage.tsdb.path=/prometheus" # 指定tsdb数据路径
            - "--storage.tsdb.retention.time=2d"
            - "--web.enable-lifecycle" # 支持热更新,直接执行localhost:9090/-/reload立即生效
          ports:
            - containerPort: 9090
              name: http
          securityContext:
            runAsUser: 0
          volumeMounts:
            - mountPath: "/etc/prometheus"
              name: config-volume
            - mountPath: "/prometheus"
              name: data
---
apiVersion: v1
kind: Service
metadata:
  name: prometheus
  namespace: kube-vm
spec:
  selector:
    app: prometheus
  type: NodePort
  ports:
    - name: web
      port: 9090
      targetPort: http
|
Just apply the list of resources above directly.
 1
 2
 3
 4
 5
 6
 7
 8
 9
10
11
12
|
☸ ➜ kubectl apply -f vm-prom-config.yaml
☸ ➜ kubectl apply -f vm-prom-pvc.yaml
☸ ➜ kubectl apply -f vm-prom-deploy.yaml
☸ ➜ kubectl get pods -n kube-vm -owide
NAME                      READY   STATUS    RESTARTS   AGE     IP              NODE      NOMINATED NODE   READINESS GATES
node-exporter-c4d76       1/1     Running   0          27m     192.168.0.109   node2     <none>           <none>
node-exporter-hzt8s       1/1     Running   0          27m     192.168.0.111   master1   <none>           <none>
node-exporter-zlxwb       1/1     Running   0          27m     192.168.0.110   node1     <none>           <none>
prometheus-dfc9f6-2w2vf   1/1     Running   0          4m58s   10.244.2.102    node2     <none>           <none>
☸ ➜ kubectl get svc -n kube-vm
NAME         TYPE       CLUSTER-IP      EXTERNAL-IP   PORT(S)          AGE
prometheus   NodePort   10.103.38.114   <none>        9090:31890/TCP   4m10s
|
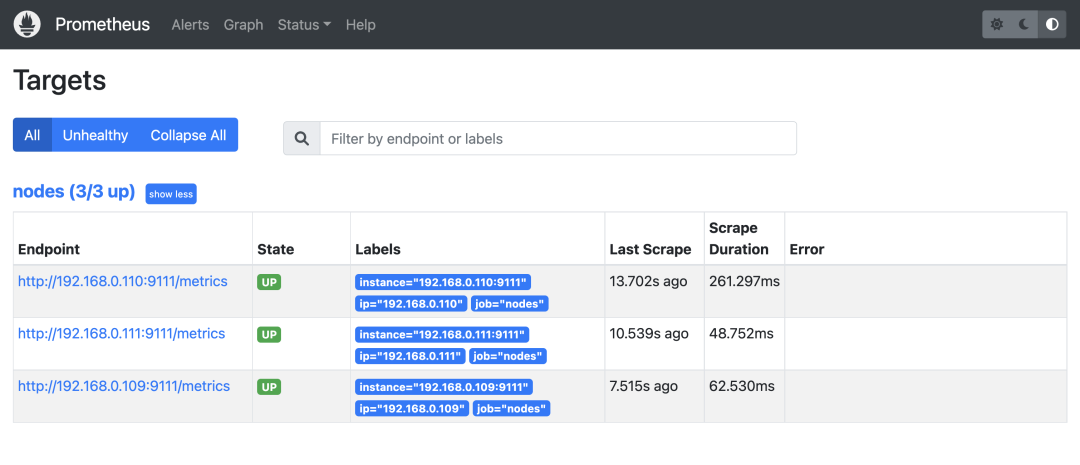
After deployment, you can access Prometheus via http://<node-ip>:31890 and see the metrics tasks for the 3 node nodes collected as normal.
Redeploying Grafana in the same way, the list of resources is shown below.
 1
 2
 3
 4
 5
 6
 7
 8
 9
10
11
12
13
14
15
16
17
18
19
20
21
22
23
24
25
26
27
28
29
30
31
32
33
34
35
36
37
38
39
40
41
42
43
44
45
46
47
48
49
50
51
52
53
54
55
56
57
58
59
60
61
62
63
64
65
66
67
68
69
70
71
72
73
74
75
76
77
78
79
80
81
82
83
|
# vm-grafana.yaml
apiVersion: apps/v1
kind: Deployment
metadata:
  name: grafana
  namespace: kube-vm
spec:
  selector:
    matchLabels:
      app: grafana
  template:
    metadata:
      labels:
        app: grafana
    spec:
      volumes:
        - name: storage
          persistentVolumeClaim:
            claimName: grafana-data
      containers:
        - name: grafana
          image: grafana/grafana:main
          imagePullPolicy: IfNotPresent
          ports:
            - containerPort: 3000
              name: grafana
          securityContext:
            runAsUser: 0
          env:
            - name: GF_SECURITY_ADMIN_USER
              value: admin
            - name: GF_SECURITY_ADMIN_PASSWORD
              value: admin321
          volumeMounts:
            - mountPath: /var/lib/grafana
              name: storage
---
apiVersion: v1
kind: Service
metadata:
  name: grafana
  namespace: kube-vm
spec:
  type: NodePort
  ports:
    - port: 3000
  selector:
    app: grafana
---
apiVersion: v1
kind: PersistentVolume
metadata:
  name: grafana-data
spec:
  accessModes:
    - ReadWriteOnce
  capacity:
    storage: 1Gi
  storageClassName: local-storage
  local:
    path: /data/k8s/grafana
  persistentVolumeReclaimPolicy: Retain
  nodeAffinity:
    required:
      nodeSelectorTerms:
        - matchExpressions:
            - key: kubernetes.io/hostname
              operator: In
              values:
                - node2
---
apiVersion: v1
kind: PersistentVolumeClaim
metadata:
  name: grafana-data
  namespace: kube-vm
spec:
  accessModes:
    - ReadWriteOnce
  resources:
    requests:
      storage: 1Gi
  storageClassName: local-storage
|
1
2
3
|
☸ ➜ kubectl apply -f vm-grafana.yaml
☸ ➜ kubectl get svc -n kube-vm |grep grafana
grafana      NodePort   10.97.111.153   <none>        3000:31800/TCP   62s
|
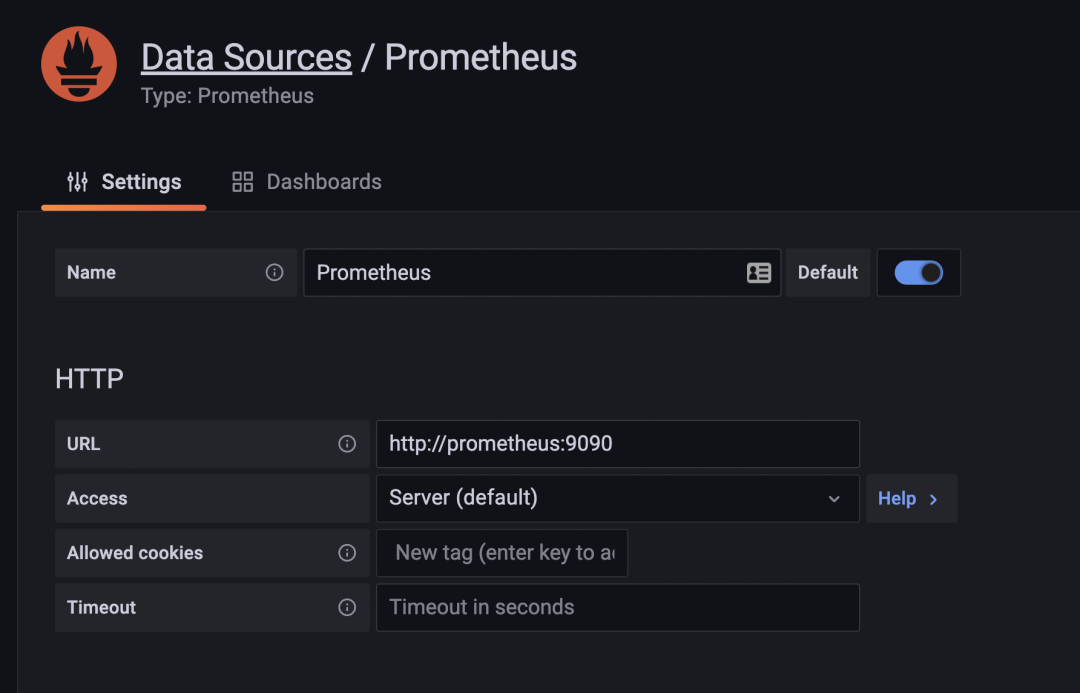
Grafana is also accessible via http://<node-ip>:31800 to access the Grafana configuration Prometheus data source.
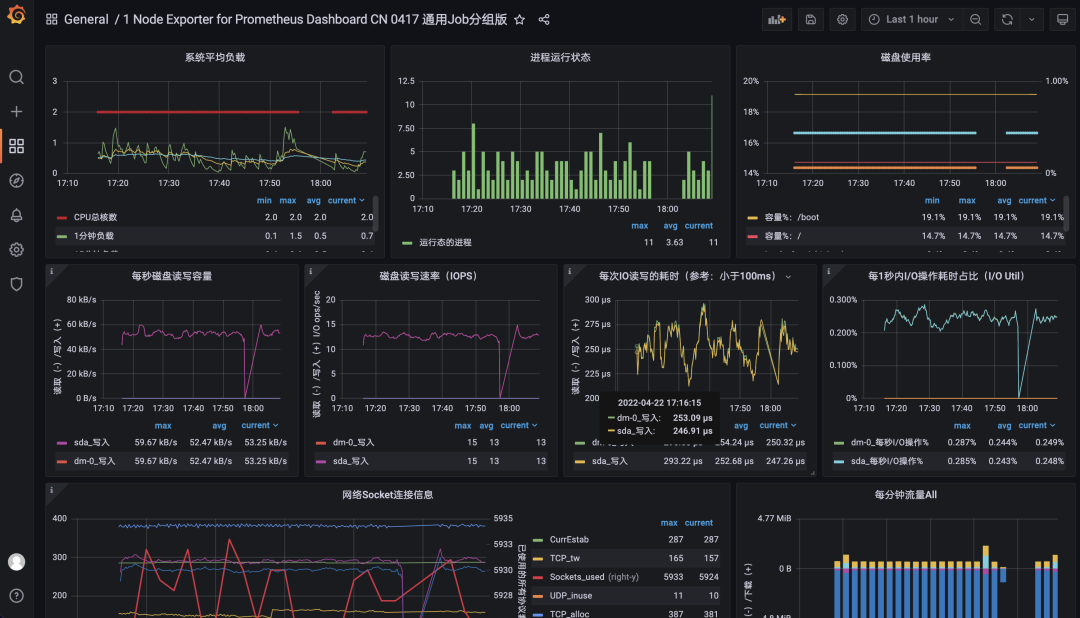
Then import the Dashboard 16098, the effect after import is shown below.
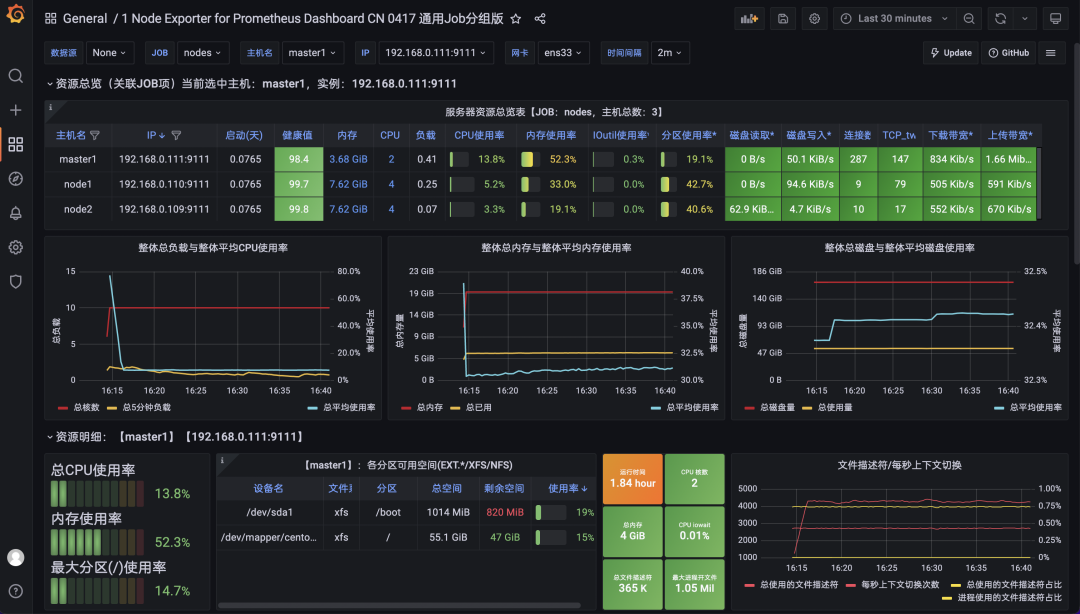
This completes the use of Prometheus to collect node monitoring metrics, so let’s use VM to retrofit the existing solution.
Remote Storage VictoriaMetrics
The first thing you need is a VM in single-node mode. Running the VM is easy, either by downloading the corresponding binary directly to start it or by using a docker image to start it with one click, which we also deploy here to a Kubernetes cluster. The resource list file is shown below.
 1
 2
 3
 4
 5
 6
 7
 8
 9
10
11
12
13
14
15
16
17
18
19
20
21
22
23
24
25
26
27
28
29
30
31
32
33
34
35
36
37
38
39
40
41
42
43
44
45
46
47
48
49
50
51
52
53
54
55
56
57
58
59
60
61
62
63
64
65
66
67
68
69
70
71
72
73
74
75
76
77
78
79
|
# vm-grafana.yaml
apiVersion: apps/v1
kind: Deployment
metadata:
  name: victoria-metrics
  namespace: kube-vm
spec:
  selector:
    matchLabels:
      app: victoria-metrics
  template:
    metadata:
      labels:
        app: victoria-metrics
    spec:
      volumes:
        - name: storage
          persistentVolumeClaim:
            claimName: victoria-metrics-data
      containers:
        - name: vm
          image: victoriametrics/victoria-metrics:v1.76.1
          imagePullPolicy: IfNotPresent
          args:
            - -storageDataPath=/var/lib/victoria-metrics-data
            - -retentionPeriod=1w
          ports:
            - containerPort: 8428
              name: http
          volumeMounts:
            - mountPath: /var/lib/victoria-metrics-data
              name: storage
---
apiVersion: v1
kind: Service
metadata:
  name: victoria-metrics
  namespace: kube-vm
spec:
  type: NodePort
  ports:
    - port: 8428
  selector:
    app: victoria-metrics
---
apiVersion: v1
kind: PersistentVolume
metadata:
  name: victoria-metrics-data
spec:
  accessModes:
    - ReadWriteOnce
  capacity:
    storage: 20Gi
  storageClassName: local-storage
  local:
    path: /data/k8s/vm
  persistentVolumeReclaimPolicy: Retain
  nodeAffinity:
    required:
      nodeSelectorTerms:
        - matchExpressions:
            - key: kubernetes.io/hostname
              operator: In
              values:
                - node2
---
apiVersion: v1
kind: PersistentVolumeClaim
metadata:
  name: victoria-metrics-data
  namespace: kube-vm
spec:
  accessModes:
    - ReadWriteOnce
  resources:
    requests:
      storage: 20Gi
  storageClassName: local-storage
|
Here we specify the data storage directory using the -storageDataPath parameter, which is then also persisted, and the -retentionPeriod parameter can be used to configure the data retention period. Just apply the resource list above directly.
 1
 2
 3
 4
 5
 6
 7
 8
 9
10
11
12
13
14
15
16
17
|
☸ ➜ kubectl apply -f vm-single-node-deploy.yaml
☸ ➜ kubectl get svc victoria-metrics -n kube-vm
NAME               TYPE       CLUSTER-IP       EXTERNAL-IP   PORT(S)          AGE
victoria-metrics   NodePort   10.106.216.248   <none>        8428:31953/TCP   75m
☸ ➜ kubectl get pods -n kube-vm -l app=victoria-metrics
NAME                                READY   STATUS    RESTARTS   AGE
victoria-metrics-57d47f4587-htb88   1/1     Running   0          3m12s
☸ ➜ kubectl logs -f victoria-metrics-57d47f4587-htb88 -n kube-vm
2022-04-22T08:59:14.431Z        info    VictoriaMetrics/lib/logger/flag.go:12   build version: victoria-metrics-20220412-134346-tags-v1.76.1-0-gf8de318bf
2022-04-22T08:59:14.431Z        info    VictoriaMetrics/lib/logger/flag.go:13   command line flags
2022-04-22T08:59:14.431Z        info    VictoriaMetrics/lib/logger/flag.go:20   flag "retentionPeriod"="1w"
2022-04-22T08:59:14.431Z        info    VictoriaMetrics/lib/logger/flag.go:20   flag "storageDataPath"="/var/lib/victoria-metrics-data"
2022-04-22T08:59:14.431Z        info    VictoriaMetrics/app/victoria-metrics/main.go:52 starting VictoriaMetrics at ":8428"...
2022-04-22T08:59:14.432Z        info    VictoriaMetrics/app/vmstorage/main.go:97        opening storage at "/var/lib/victoria-metrics-data" with -retentionPeriod=1w
......
2022-04-22T08:59:14.449Z        info    VictoriaMetrics/app/victoria-metrics/main.go:61 started VictoriaMetrics in 0.017 seconds
2022-04-22T08:59:14.449Z        info    VictoriaMetrics/lib/httpserver/httpserver.go:91 starting http server at http://127.0.0.1:8428/
|
At this point we have a single node VictoriaMetrics deployment. Next we just need to configure the remote write to our VM in Prometheus and change the Prometheus configuration.
 1
 2
 3
 4
 5
 6
 7
 8
 9
10
11
12
13
14
15
16
17
18
19
20
21
22
23
|
# vm-prom-config2.yaml
apiVersion: v1
kind: ConfigMap
metadata:
  name: prometheus-config
  namespace: kube-vm
data:
  prometheus.yaml: |
    global:
      scrape_interval: 15s
      scrape_timeout: 15s
    remote_write:    # 远程写入到远程 VM 存储
    - url: http://victoria-metrics:8428/api/v1/write
    scrape_configs:
    - job_name: "nodes"
      static_configs:
      - targets: ['192.168.0.109:9111', '192.168.0.110:9111', '192.168.0.111:9111']
      relabel_configs: # 通过 relabeling 从 __address__ 中提取 IP 信息,为了后面验证 VM 是否兼容 relabeling
      - source_labels: [__address__]
        regex: "(.*):(.*)"
        replacement: "${1}"
        target_label: 'ip'
        action: replace
|
Re-update the configuration resource object for Prometheus.
1
2
3
|
☸ ➜ kubectl apply -f vm-prom-config2.yaml
# 更新后执行 reload 操作重新加载 prometheus 配置
☸ ➜ curl -X POST "http://192.168.0.111:31890/-/reload"
|
Once the configuration takes effect, Prometheus will start writing data to the VM remotely, and we can verify this by checking the VM’s persistent data directory to see if any data is being generated.
1
2
3
4
5
6
|
☸ ➜ ll /data/k8s/vm/data/
total 0
drwxr-xr-x 4 root root 38 Apr 22 17:15 big
-rw-r--r-- 1 root root  0 Apr 22 16:59 flock.lock
drwxr-xr-x 4 root root 38 Apr 22 17:15 small
|
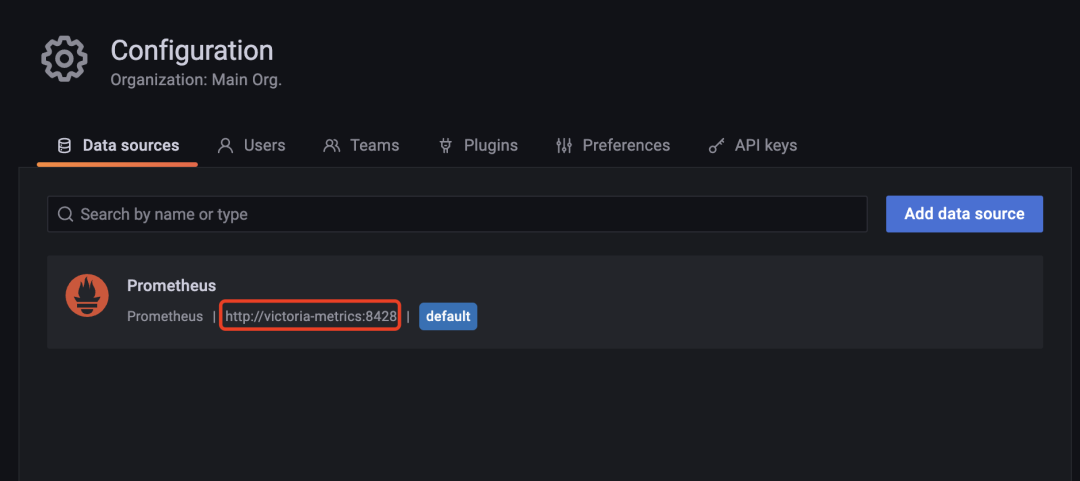
Now let’s go ahead and change the address of the data source in Grafana directly to the address of the VM.
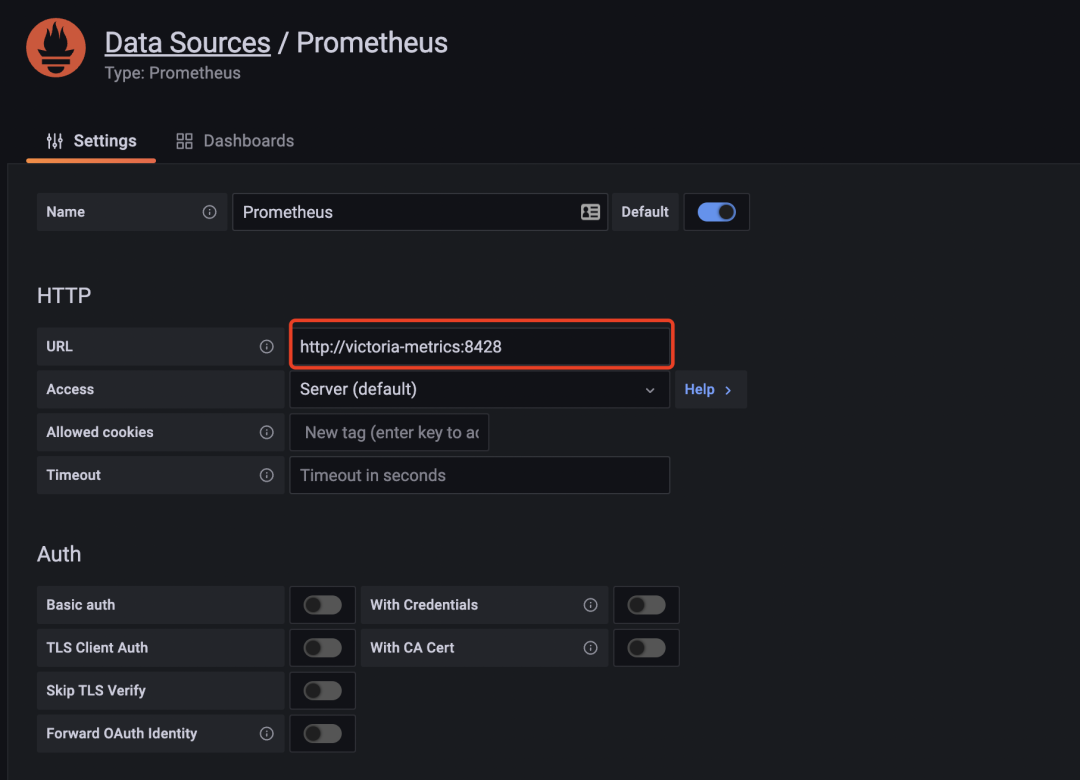
After the changes are made, you can revisit the node-exporter dashboard and it will display normally, proving that the VM is compatible.
Replacing Prometheus
Above we have written the Prometheus data remotely to the VM, but the remote write feature of Prometheus will increase its own resource usage, so theoretically we can replace Prometheus completely with the VM, so we don’t need to write remotely, and the VM itself takes less resources than Prometheus. The VM itself uses fewer resources than Prometheus.
Now let’s stop the Prometheus service.
1
|
☸ ➜ kubectl scale deploy prometheus --replicas=0 -n kube-vm
|
Then mount the Prometheus configuration file into the VM container, using the parameter -promscrape.config to specify the Prometheus configuration file path, as shown below.
 1
 2
 3
 4
 5
 6
 7
 8
 9
10
11
12
13
14
15
16
17
18
19
20
21
22
23
24
25
26
27
28
29
30
31
32
33
34
35
36
37
38
|
# vm-single-node-deploy2.yaml
apiVersion: apps/v1
kind: Deployment
metadata:
  name: victoria-metrics
  namespace: kube-vm
spec:
  selector:
    matchLabels:
      app: victoria-metrics
  template:
    metadata:
      labels:
        app: victoria-metrics
    spec:
      volumes:
        - name: storage
          persistentVolumeClaim:
            claimName: victoria-metrics-data
        - name: prometheus-config
          configMap:
            name: prometheus-config
      containers:
        - name: vm
          image: victoriametrics/victoria-metrics:v1.76.1
          imagePullPolicy: IfNotPresent
          args:
            - -storageDataPath=/var/lib/victoria-metrics-data
            - -retentionPeriod=1w
            - -promscrape.config=/etc/prometheus/prometheus.yaml
          ports:
            - containerPort: 8428
              name: http
          volumeMounts:
            - mountPath: /var/lib/victoria-metrics-data
              name: storage
            - mountPath: /etc/prometheus
              name: prometheus-config
|
Remember to remove the remote_write module from the Prometheus configuration file first, and then just update the VM again.
 1
 2
 3
 4
 5
 6
 7
 8
 9
10
11
12
13
14
|
☸ ➜ kubectl apply -f vm-prom-config.yaml
☸ ➜ kubectl apply -f vm-single-node-deploy2.yaml
☸ ➜ kubectl get pods -n kube-vm -l app=victoria-metrics
NAME                                READY   STATUS    RESTARTS       AGE
victoria-metrics-8466844968-ncfnp   1/1     Running   2 (3m3s ago)   3m45s
☸ ➜ kubectl logs -f victoria-metrics-8466844968-ncfnp -n kube-vm
......
2022-04-22T10:01:59.837Z        info    VictoriaMetrics/app/victoria-metrics/main.go:61 started VictoriaMetrics in 0.022 seconds
2022-04-22T10:01:59.837Z        info    VictoriaMetrics/lib/httpserver/httpserver.go:91 starting http server at http://127.0.0.1:8428/
2022-04-22T10:01:59.837Z        info    VictoriaMetrics/lib/httpserver/httpserver.go:92 pprof handlers are exposed at http://127.0.0.1:8428/debug/pprof/
2022-04-22T10:01:59.838Z        info    VictoriaMetrics/lib/promscrape/scraper.go:103   reading Prometheus configs from "/etc/prometheus/prometheus.yaml"
2022-04-22T10:01:59.838Z        info    VictoriaMetrics/lib/promscrape/config.go:96     starting service discovery routines...
2022-04-22T10:01:59.839Z        info    VictoriaMetrics/lib/promscrape/config.go:102    started service discovery routines in 0.000 seconds
2022-04-22T10:01:59.840Z        info    VictoriaMetrics/lib/promscrape/scraper.go:395   static_configs: added targets: 3, removed targets: 0; total targets: 3
|
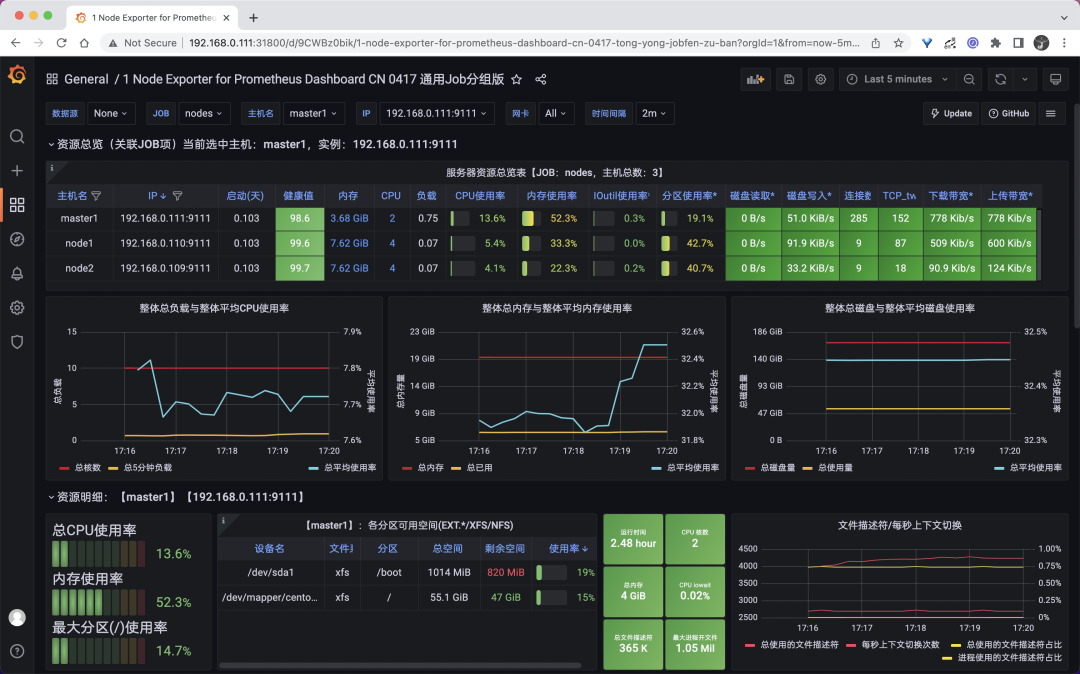
The VM logs show that the Prometheus configuration was successfully read and 3 metrics (node-exporter) were grabbed. Now let’s go back to Grafana and see if the Dashboard for the node-exporter is displaying properly. First, make sure the data source is the VM’s address.
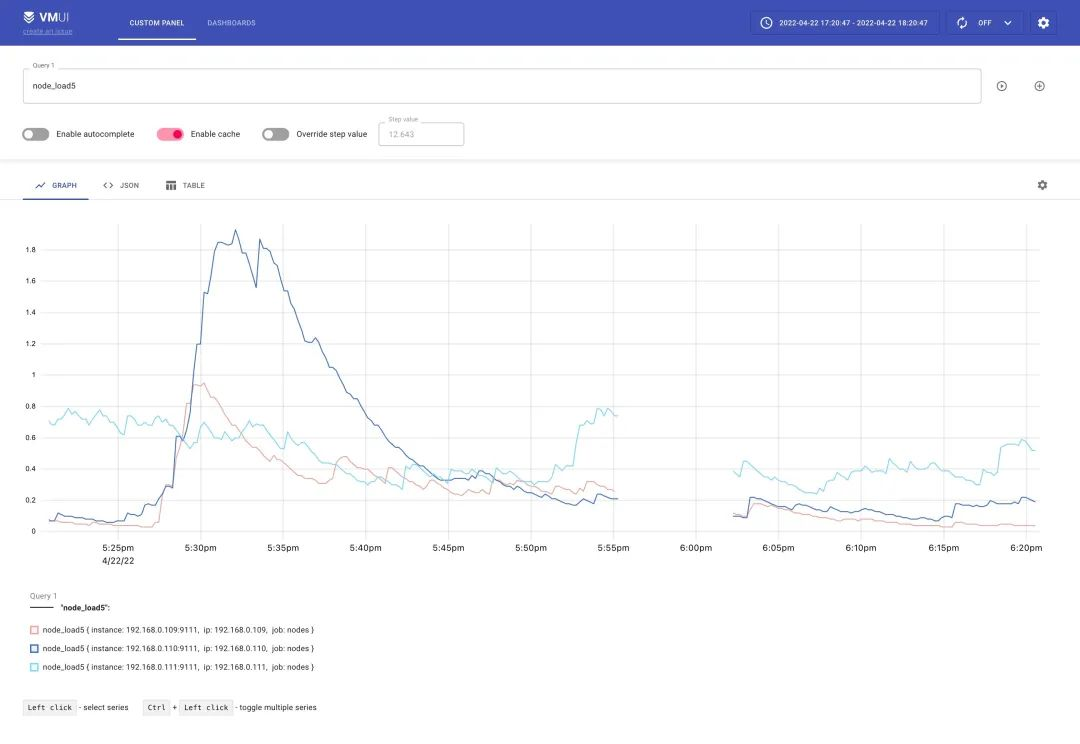
This replaces Prometheus with VM, and we can also explore the collected metrics on Grafana’s Explore page.
UI Interface
The single-node version of the VM itself comes with a web UI interface - vmui - but it is currently relatively simple and can be accessed directly through the VM’s NodePort.
1
2
3
|
☸ ➜ kubectl get svc victoria-metrics -n kube-vm
NAME               TYPE       CLUSTER-IP       EXTERNAL-IP   PORT(S)          AGE
victoria-metrics   NodePort   10.106.216.248   <none>        8428:31953/TCP   75m
|
We can access vmui here via http://<node-ip>:31953.
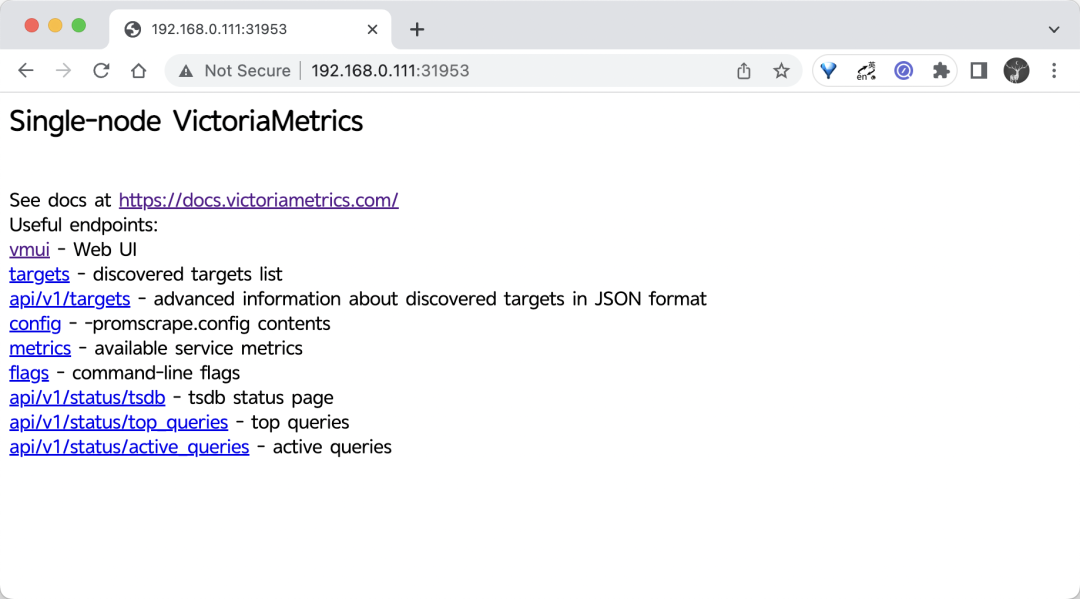
The UI interface can be accessed through the /vmui endpoint.
If you want to see the collected metrics targets, then you can get them through the /targets endpoint.
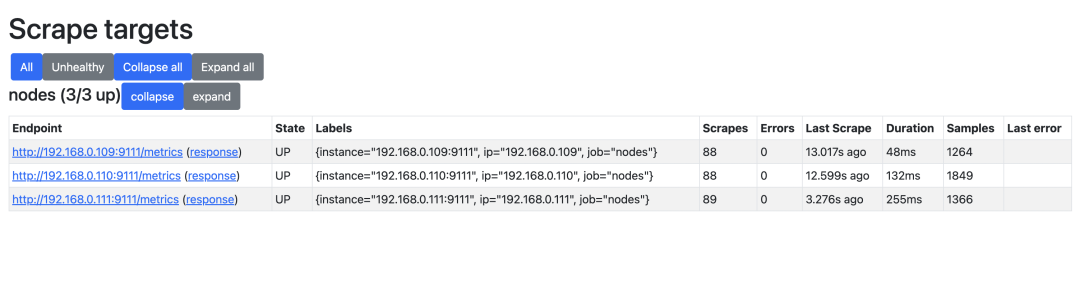
These functions can basically meet some of our needs, but they are still too simple. If you are used to the UI interface of Prometheus, then we can use promxy instead of vmui, and promxy can also perform data aggregation of multiple VM single nodes, as well as targets viewing, etc. The corresponding resource list file is shown below.
 1
 2
 3
 4
 5
 6
 7
 8
 9
10
11
12
13
14
15
16
17
18
19
20
21
22
23
24
25
26
27
28
29
30
31
32
33
34
35
36
37
38
39
40
41
42
43
44
45
46
47
48
49
50
51
52
53
54
55
56
57
58
59
60
61
62
63
64
65
66
67
68
69
70
71
72
73
|
# vm-promxy.yaml
apiVersion: v1
kind: ConfigMap
metadata:
  name: promxy-config
  namespace: kube-vm
data:
  config.yaml: |
    promxy:
      server_groups:
      - static_configs:
        - targets: [victoria-metrics:8428]  # 指定vm地址,有多个则往后追加即可
        path_prefix: /prometheus  # 配置前缀
---
apiVersion: apps/v1
kind: Deployment
metadata:
  name: promxy
  namespace: kube-vm
spec:
  selector:
    matchLabels:
      app: promxy
  template:
    metadata:
      labels:
        app: promxy
    spec:
      containers:
        - args:
            - "--config=/etc/promxy/config.yaml"
            - "--web.enable-lifecycle"
            - "--log-level=trace"
          env:
            - name: ROLE
              value: "1"
          command:
            - "/bin/promxy"
          image: quay.io/jacksontj/promxy
          imagePullPolicy: Always
          name: promxy
          ports:
            - containerPort: 8082
              name: web
          volumeMounts:
            - mountPath: "/etc/promxy/"
              name: promxy-config
              readOnly: true
        - args: # container to reload configs on configmap change
            - "--volume-dir=/etc/promxy"
            - "--webhook-url=http://localhost:8082/-/reload"
          image: jimmidyson/configmap-reload:v0.1
          name: promxy-server-configmap-reload
          volumeMounts:
            - mountPath: "/etc/promxy/"
              name: promxy-config
              readOnly: true
      volumes:
        - configMap:
            name: promxy-config
          name: promxy-config
---
apiVersion: v1
kind: Service
metadata:
  name: promxy
  namespace: kube-vm
spec:
  type: NodePort
  ports:
    - port: 8082
  selector:
    app: promxy
|
It is sufficient to apply the resource object above directly.
1
2
3
4
5
6
7
|
☸ ➜ kubectl apply -f vm-promxy.yaml
☸ ➜ kubectl get pods -n kube-vm -l app=promxy
NAME                      READY   STATUS    RESTARTS   AGE
promxy-5f7dfdbc64-l4kjq   2/2     Running   0          6m45s
☸ ➜ kubectl get svc promxy -n kube-vm
NAME               TYPE       CLUSTER-IP       EXTERNAL-IP   PORT(S)          AGE
promxy             NodePort   10.110.19.254    <none>        8082:30618/TCP   6m12s
|
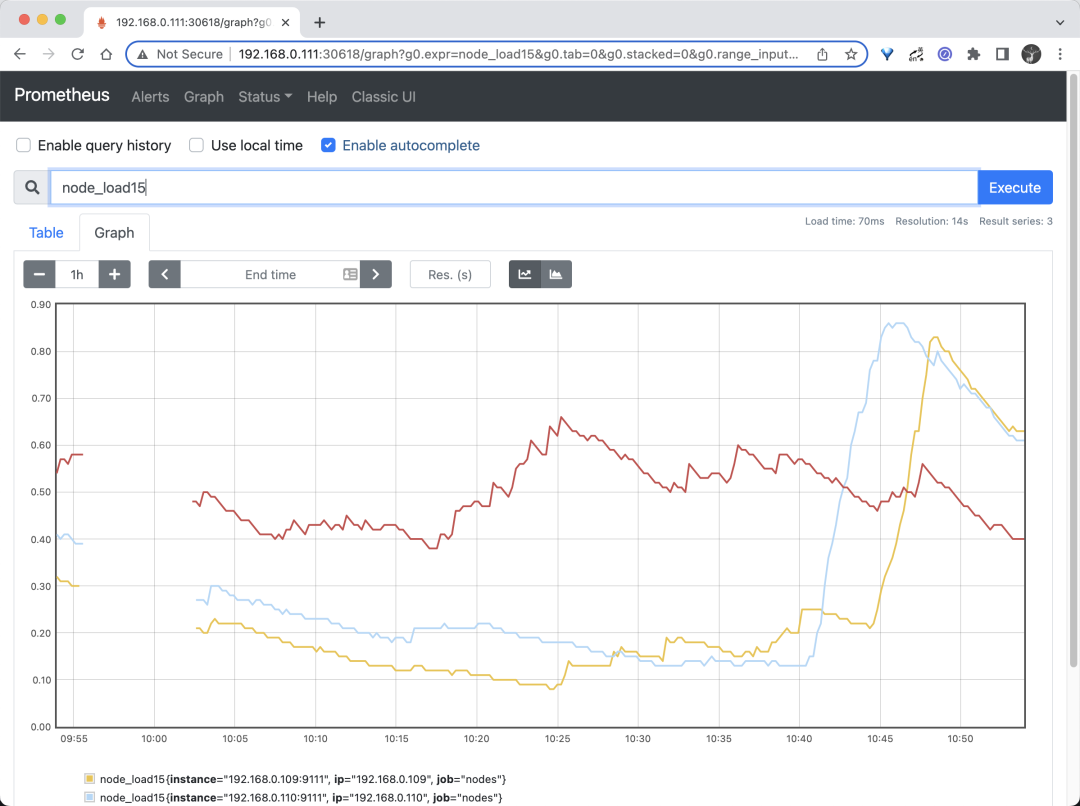
The effect of accessing the Promxy page is basically the same as the Web UI that comes with Prometheus.
Here we briefly introduce the basic use of the standalone version of victoriametrics. Stay tuned for a follow-up article on the use of the cluster version.