Prometheus is one of the most popular monitoring platforms in the cloud-native era as a temporal database. Although its overall architecture has not changed much, the underlying storage engine has evolved over several versions. This article focuses on the details of the storage format of Prometheus V2 version (which is mainly used now) and how queries locate the eligible data, aiming to have a deeper understanding of the storage engine of Prometheus through the analysis in this article.
Note: This article does not cover the query parsing and function evaluation process. The code analysis is based on version v2.25.2.
Background knowledge
Timing characteristics
The characteristics of chronological data can be summarized in one sentence: write vertically (latest data) and check horizontally.
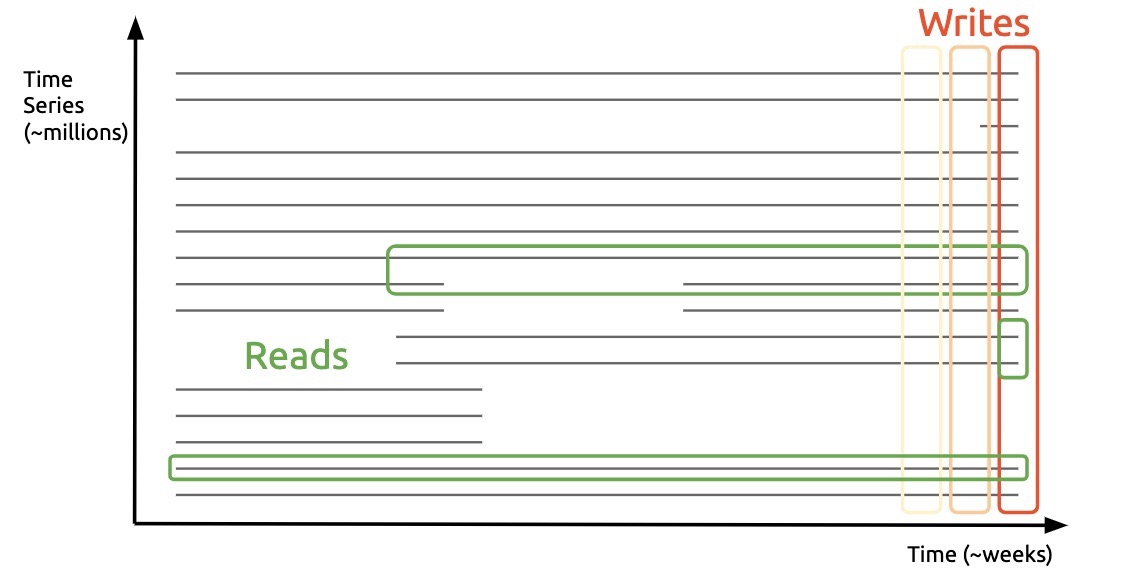
Another characteristic for cloud-native scenarios is the short data lifecycle, where a single container expansion or contraction can cause the timeline to double in size. Understanding these two characteristics, let’s take a look at how Prometheus stores data to cater to the above patterns.
As you can see, the data directory has the following main parts.
- block, all data within a time period (default 2 hours), read-only, named with ULID. Each block contains mainly.
- chunks, fixed size (max 128M) chunks file
- index index file, which mainly contains information about the inverted index
- meta.json meta-information, mainly including minTime/maxTime of the block, which is convenient for filtering when querying
- chunks_head, the chunks file corresponding to the block currently being written, read-only, up to 120 data points, time span up to 2 hours.
- wal, Prometheus uses batching to asynchronously swipe the disk, so WAL is needed to ensure data reliability
With the above directory structure, it is easy to see the design idea of Prometheus.
- The problem of short data life cycle is solved by slicing data by time
- The scenario of writing only the latest data by saving batches in memory
Data Patterns
The schema supported by Prometheus is relatively simple, supporting only single-value schema, as follows.
Inverted index
Index is the main means to support multi-dimensional search, the index structure in the time sequence is similar to the search engine, it is an inverted index, you can refer to the following figure
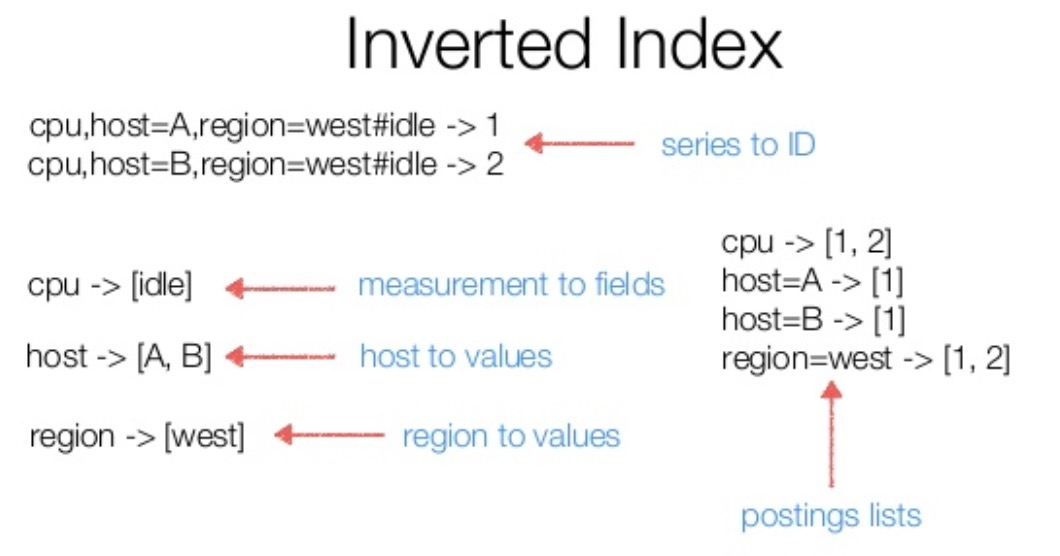
In a query, we will find the corresponding postings lists (i.e. timeline collection) for the labels involved, and then do the collection operation according to the filter type, and finally check the corresponding data according to the timeline derived from the operation result.
Disk storage format
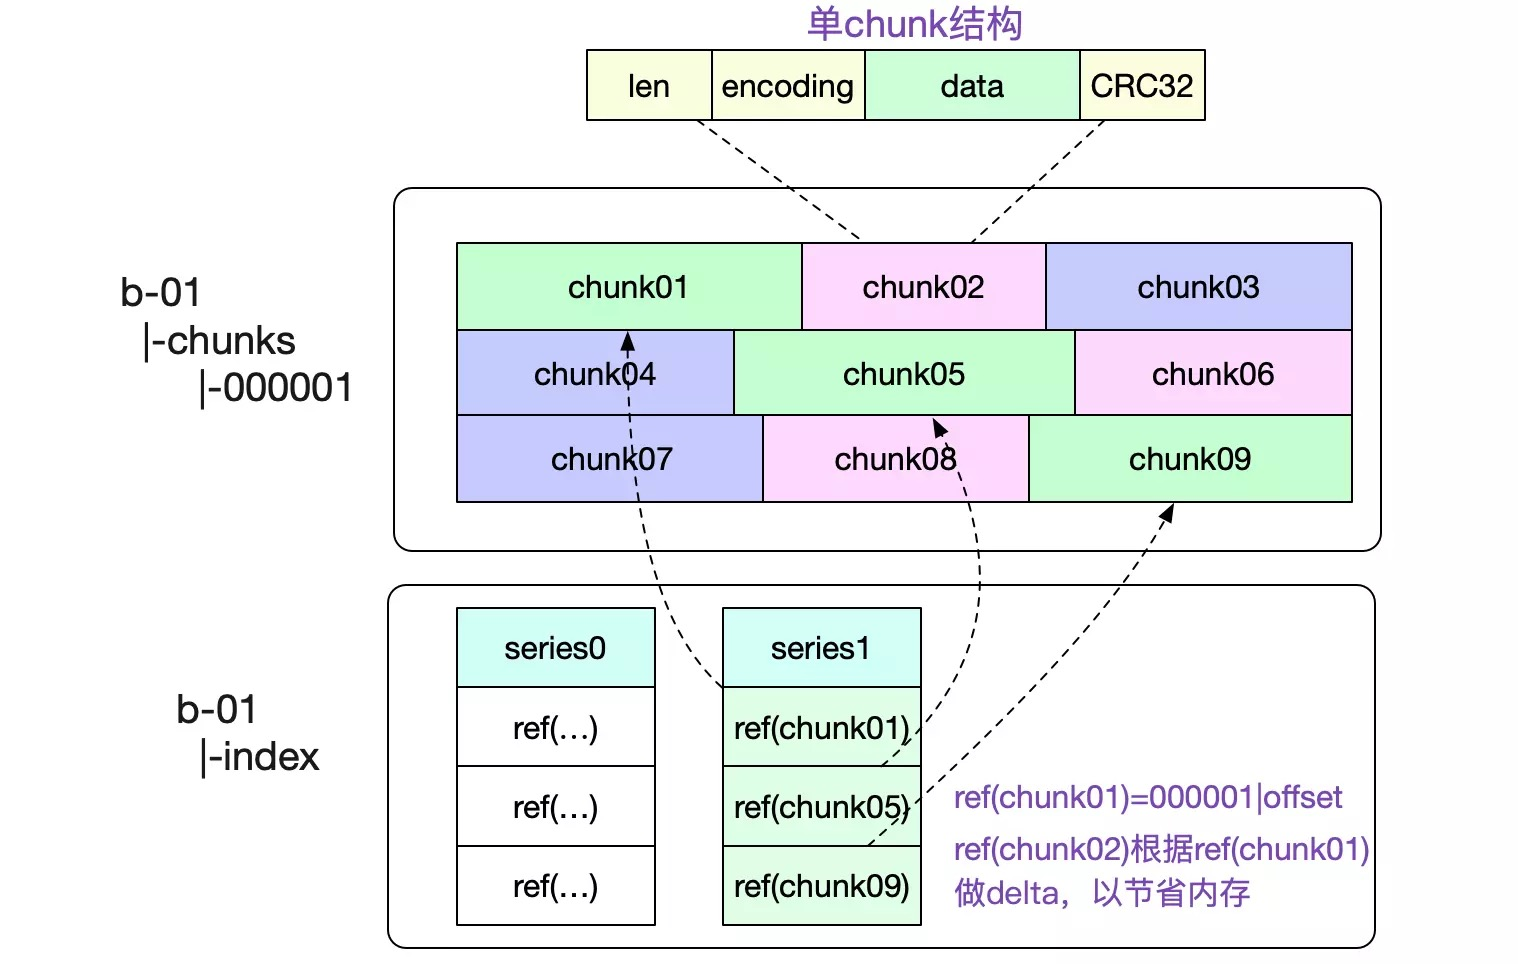
Data format
|
|
A chunk is the smallest organizational unit of data on disk, and the following two points need to be clarified:
- the default time span of a single chunk is 2 hours, Prometheus will have a merge operation in the background to merge blocks with adjacent times together
- series ref is a unique marker for the timeline, consisting of 8 bytes, the first 4 represent the file id, the last 4 represent the offset in the file, which needs to be combined with the index structure later to achieve data positioning
Index format
|
|
In an index file, the most important parts are the following (from bottom to top).
- TOC stores the offset of the other parts
- Postings Offset Table, used to store the inverted index, Key is the label name/value sequence, Value is the offset of Postings in the file.
- Postings N, which stores the specific timeline sequence
- Series, which stores the current timeline, corresponding to the chunk file information
- Label Offset Table and Label Index are not used in the query, so we will not talk about them here.
The specific encoding format of each part can be found in the official document Index Disk Format, which focuses on how a query finds The following is a description of how a query finds the eligible data.
-
First, in the Posting Offset Table, find the location of the Postings corresponding to the label
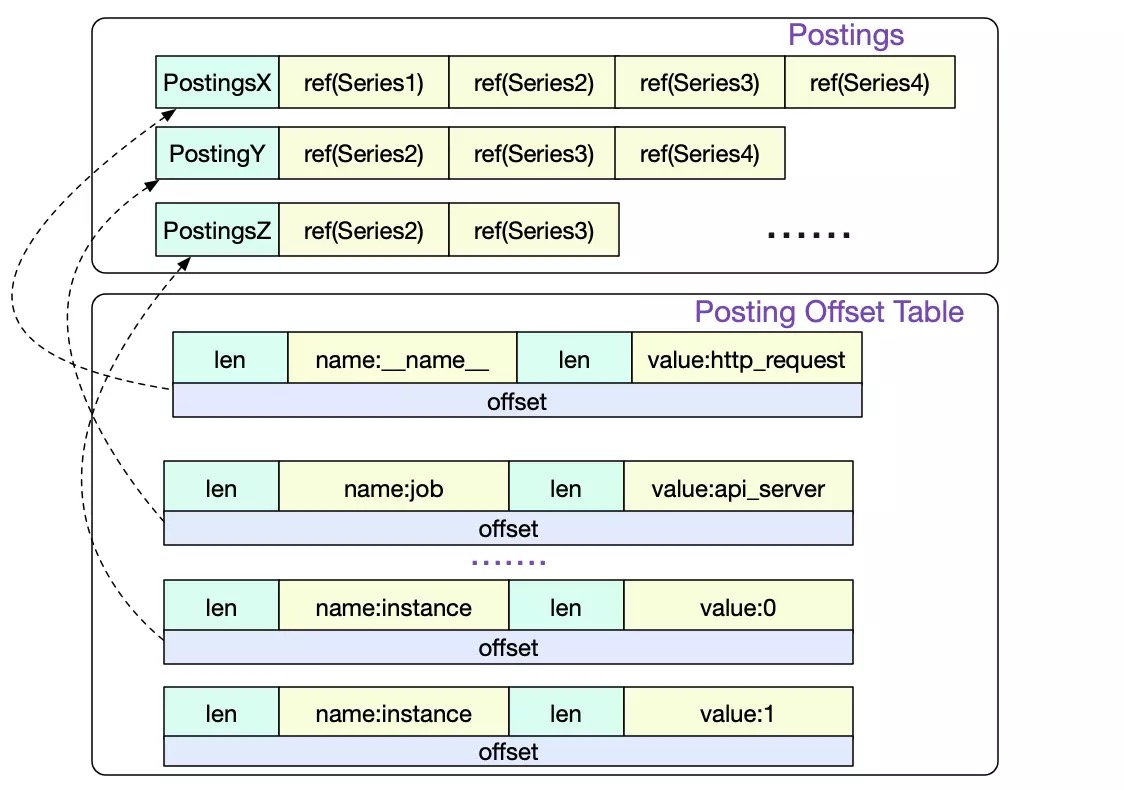
-
Then, according to the series information in Postings, we find the corresponding chunk location, i.e., the series ref above.
Usage
Prometheus goes to load data meta-information into memory when it starts. There are two main parts.
-
meta information about the block, most notably mint/maxt, which is used to determine if a query needs to see the current block file, and later to open the chunks file as mmap
1 2 3 4 5 6 7 8 9 10 11 12 13 14 15 16 17 18 19 20 21 22 23 24 25 26 27// open all blocks bDirs, err := blockDirs(dir) for _, bDir := range bDirs { meta, _, err := readMetaFile(bDir) // See if we already have the block in memory or open it otherwise. block, open := getBlock(loaded, meta.ULID) if !open { block, err = OpenBlock(l, bDir, chunkPool) if err != nil { corrupted[meta.ULID] = err continue } } blocks = append(blocks, block) } // open chunk files for _, fn := range files { f, err := fileutil.OpenMmapFile(fn) if err != nil { return nil, tsdb_errors.NewMulti( errors.Wrap(err, "mmap files"), tsdb_errors.CloseAll(cs), ).Err() } cs = append(cs, f) bs = append(bs, realByteSlice(f.Bytes())) } -
The indexing information corresponding to the block is mainly inverted indexing. Since the postings corresponding to a single label can be very large, Prometheus does not load the full number of postings, but every 32, to reduce memory pressure. And make sure that the first and last one must be loaded, and use a similar way to jump table for posting location when querying.
-
The following code is the logic to read in the postings when the DB is started.
1 2 3 4 5 6 7 8 9 10 11 12 13 14 15 16 17 18 19 20 21 22 23 24 25 26// For the postings offset table we keep every label name but only every nth // label value (plus the first and last one), to save memory. ReadOffsetTable(r.b, r.toc.PostingsTable, func(key []string, _ uint64, off int) error { if _, ok := r.postings[key[0]]; !ok { // Next label name. r.postings[key[0]] = []postingOffset{} if lastKey != nil { // Always include last value for each label name. r.postings[lastKey[0]] = append(r.postings[lastKey[0]], postingOffset{value: lastKey[1], off: lastOff}) } lastKey = nil valueCount = 0 } if valueCount%32 == 0 { r.postings[key[0]] = append(r.postings[key[0]], postingOffset{value: key[1], off: off}) lastKey = nil } else { lastKey = key lastOff = off } valueCount++ } if lastKey != nil { r.postings[lastKey[0]] = append(r.postings[lastKey[0]], postingOffset{value: lastKey[1], off: lastOff}) } -
The following code is the logic for querying postings based on label, the full [Postings method] of index can be seen (https://github.com/prometheus/prometheus/blob/bda05a23ada314a0b9806a362da39b7a1a4e04c3/tsdb/index/index.go#L1555).
1 2 3 4 5 6 7 8 9 10 11 12 13 14 15 16 17 18 19 20 21 22 23 24 25 26 27 28 29 30 31 32 33 34 35 36 37 38 39 40 41 42 43 44 45 46 47 48 49 50 51 52 53 54 55e, ok := r.postings[name] // name 为 label key if !ok || len(values) == 0 { // values 为当前需要查询的 label values return EmptyPostings(), nil } res := make([]Postings, 0, len(values)) skip := 0 valueIndex := 0 for valueIndex < len(values) && values[valueIndex] < e[0].value { // Discard values before the start. valueIndex++ } for valueIndex < len(values) { value := values[valueIndex] // 用二分查找,找到当前 value 在 postings 中的位置 i := sort.Search(len(e), func(i int) bool { return e[i].value >= value }) if i == len(e) { // We're past the end. break } if i > 0 && e[i].value != value { // postings 中没有该 value,需要用前面一个来在文件中搜索 // Need to look from previous entry. i-- } // Don't Crc32 the entire postings offset table, this is very slow // so hope any issues were caught at startup. d := encoding.NewDecbufAt(r.b, int(r.toc.PostingsTable), nil) d.Skip(e[i].off) // Iterate on the offset table. var postingsOff uint64 // The offset into the postings table. for d.Err() == nil { // ... skip 逻辑省略 v := d.UvarintBytes() // Label value. postingsOff = d.Uvarint64() // Offset. for string(v) >= value { if string(v) == value { // Read from the postings table. d2 := encoding.NewDecbufAt(r.b, int(postingsOff), castagnoliTable) _, p, err := r.dec.Postings(d2.Get()) res = append(res, p) } valueIndex++ if valueIndex == len(values) { break } value = values[valueIndex] } if i+1 == len(e) || value >= e[i+1].value || valueIndex == len(values) { // Need to go to a later postings offset entry, if there is one. break } } }
-
Memory Structures
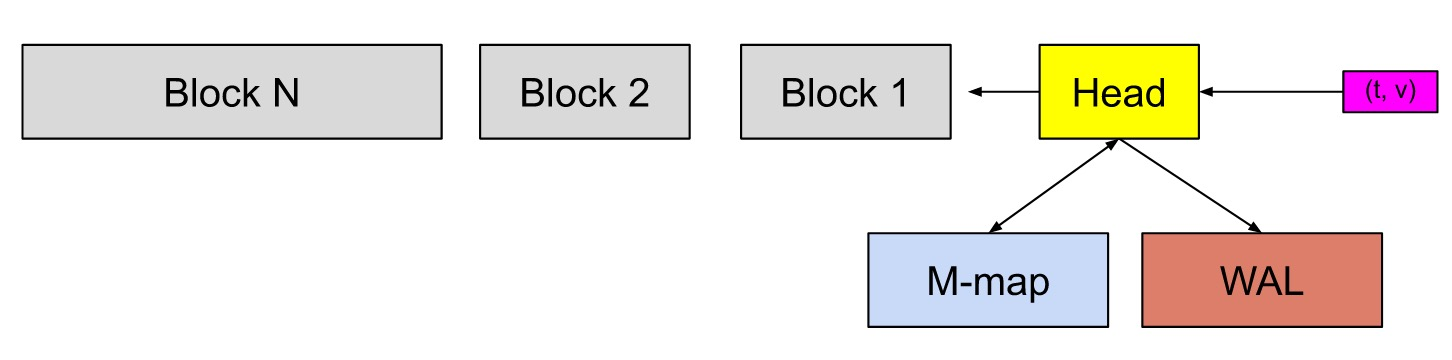
Blocks are divided into two main categories in the Prometheus implementation.
-
The one currently being written, called head. when more than 2 hours or more than 120 points have elapsed, head writes the chunk to local disk and uses mmap to map it to memory, where it is stored in mmappedChunk below.
-
History is read-only, stored in an array
1 2 3 4 5 6 7 8 9 10 11 12 13 14 15type DB struct { blocks []*Block head *Head // ... 忽略其他字段 } // Block 内的主要字段是 IndexReader,其内部主要是 postings,即倒排索引 // Map of LabelName to a list of some LabelValues's position in the offset table. // The first and last values for each name are always present. postings map[string][]postingOffset type postingOffset struct { value string // label value off int // posting 在对于文件中的 offset }As described in the disk structure above, the postingOffset is not loaded in full, but every 32nd.
Head
|
|
-
MemPostings are index structures in Head, unlike Block’s postingOffset, posting is loaded in full, after all, Head holds smaller data and puts less pressure on memory.
1 2 3 4 5 6 7 8 9 10 11 12 13 14 15 16 17 18 19 20type stripeSeries struct { size int series []map[uint64]*memSeries hashes []seriesHashmap locks []stripeLock seriesLifecycleCallback SeriesLifecycleCallback } type memSeries struct { sync.RWMutex mmappedChunks []*mmappedChunk // 只读 headChunk *memChunk // 读写 ...... // 省略其他字段 } type mmappedChunk struct { // 数据文件在磁盘上的位置,即上文中的 series ref ref uint64 numSamples uint16 minTime, maxTime int64 } -
stripeSeries is the core structure of the comparison The key of the series field is the timeline, which is generated by self-incrementing. The value is memSeries, which has chunks for storing specific data, and uses segmented locking to reduce lock competition.
Usage
For a query, the approximate steps involved are
- find out the timeline involved according to the label, and then perform a set operation to find the timeline that matches the requirements according to the filter type
- according to the timeline information and time range information, go to the block to query the data that meet the conditions
In the first step it is mainly done in the PostingsForMatchers function, there are several optimization points.
-
For the filter that takes the inverse (
! =! ~), convert it to the equal form, so that the timeline corresponding to the equal form will often be less than the effect of the inverse, and finally, when merging, subtract the inverse timeline. See: Be smarter in how we look at matchers. #572 -
When merging the timelines of different labels, we take advantage of the ordered nature of the timelines and use a mergesort-like approach to inert merge, roughly as follows.
1 2 3 4 5 6 7 8 9 10 11 12 13 14 15 16 17 18 19 20 21 22 23 24 25 26 27 28 29 30 31 32type intersectPostings struct { arr []Postings // 需要合并的时间线数组 cur uint64 // 当前的时间线 } func (it *intersectPostings) doNext() bool { Loop: for { for _, p := range it.arr { if !p.Seek(it.cur) { return false } if p.At() > it.cur { it.cur = p.At() continue Loop } } return true } } func (it *intersectPostings) Next() bool { for _, p := range it.arr { if !p.Next() { return false } if p.At() > it.cur { it.cur = p.At() } } return it.doNext() }
After finding out the chunk file and offset information in the first step, the second step of fetching data is relatively simple, just use mmap to read data directly, which indirectly uses the OS page cache to do caching, and does not need to implement data structures such as Buffer Pool itself.
Summary
The above analysis has generally analyzed the storage structure and query process of Prometheus, but there are some details that have not been introduced, such as the use of dictionary compression in order to save memory usage, but this does not prevent the reader from understanding the principle.
In addition, Prometheus default 2 hours a Block is not friendly to large time range queries, so the background will compaction of regular chunk files, the merged file size is min(31d, retention_time * 0.1), related details will be introduced separately later when there is a chance.