Earlier we described the use of the single-node version of VictoriaMetrics. For ingestion rates below one million data points per second, it is recommended that the single-node version be used instead of the clustered version. The single-node version scales with the number of CPU cores, RAM, and available storage space. The single-node version is easier to configure and operate than the clustered version, so think twice before using the clustered version. We covered the basic use of the single-node version of the VM above, so let’s move on to how to use the clustered version.
Cluster version main features.
- Supports all features of the single-node version.
- Performance and capacity level scaling.
- Support for multiple independent namespaces for time series data (multi-tenancy).
- Support for multiple copies.
Components
Earlier we learned about the basic architecture of VMs, for the clustered mode the main services include the following.
vmstorage: stores raw data and returns query data for the given time range for the specified tag filter. When the directory pointed to by-storageDataPathcontains less than-storage.minFreeDiskSpaceBytes, thevmstoragenode will automatically switch to read-only mode and thevminsertnode will also stop sending data to such nodes and start rerouting data to the remainingvmstoragenodes.vminsert: accepts the ingested data and stores it scattered to thevmstoragenode based on a consistent hash of the metric name and all its labels.vmselect: Executes a query by fetching the required data from all configuredvmstoragenodes.
Each service can scale independently, and the vmstorage nodes do not know or communicate with each other and do not share any data. This increases the availability of the cluster and simplifies cluster maintenance and scaling. The minimum cluster must contain the following nodes.
- A single
vmstoragenode with-retentionPeriodand-storageDataPatharguments - A single
vminsertnode with-storageNode=<vmstorage_host> - single
vmselectnode with-storageNode=<vmstorage_host>
However, we recommend running at least two nodes for each service component for high availability, so that the cluster will continue to work when a single node is temporarily unavailable and the remaining nodes can still handle the increased workload. If you have a larger cluster, then you can run multiple smaller vmstorage nodes, as this will reduce the increased workload on the remaining vmstorage nodes when some vmstorage nodes are temporarily unavailable.
The individual services can be configured by means of environment variables in addition to the parameter flags as follows.
- The
-envflag.enableflag must be set - The
.must be replaced with_, for example-insert.maxQueueDuration <duration>can be converted toinsert_maxQueueDuration=<duration> - For duplicate flags, another syntax can be used to concatenate different values into one by using
,as a separator, e.g.-storageNode <nodeA> -storageNode <nodeB>would be converted to-storageNode=<nodeA>,<nodeB> - You can use
-envflag.prefixto prefix environment variables, e.g. if you set-envflag.prefix=VM*, then the environment variable parameter must start withVM*
Multi-tenancy
VM clusters also support multiple independent tenants (also called namespaces), which are identified by accountID or accountID:projectID, which are placed in the requested urls.
- Each
accountIDandprojectIDis identified by an arbitrary value in the range [0 … Additional information about the tenant, such as authentication tokens, tenant name, limits, billing, etc., is stored in a separate relational database. This database must be managed by a separate service located in front of the VictoriaMetrics cluster, such asvmauthorvmgateway. - Tenants are created automatically when the first data point is written to the specified tenant.
- Data for all tenants is evenly distributed across the available
vmstoragenodes, which ensures even load acrossvmstoragenodes when different tenants have different amounts of data and different query loads. - Database performance and resource usage does not depend on the number of tenants, it depends mainly on the total number of active time series in all tenants. A time series is considered active if it has received at least one sample in the past hour or has been queried in the past hour.
- VictoriaMetrics does not support querying multiple tenants in a single request.
Cluster Scaling
The performance and capacity of a VM cluster can be scaled in two ways.
- By adding more resources (CPU, RAM, disk IO, disk space, network bandwidth) to the existing nodes in the cluster, also called vertical scalability.
- By adding more nodes to the cluster, also called horizontal scalability.
There are some general recommendations for cluster scaling.
- Adding more CPU and memory to existing
vmselectnodes can improve the performance of complex queries that can handle a large number of time series and a large number of raw samples. - Adding more
vmstoragenodes increases the number of active time series that the cluster can handle, which also improves query performance for time series with high churn rate (churn rate). Cluster stability also increases with the number ofvmstoragenodes, and when somevmstoragenodes are unavailable, the activevmstoragenodes need to handle a lower additional workload. - Adding more CPU and memory to existing
vmstoragenodes increases the number of active time series that the cluster can handle. Adding morevmstoragenodes is preferable to adding more CPUs and memory to existingvmstoragenodes because morevmstoragenodes can improve cluster stability and query performance for time series with high churn rates. - Adding more
vminsertnodes will improve the maximum speed of data ingestion because the ingested data can be split between morevminsertnodes. - Adding more
vmselectnodes will improve the maximum speed of querying, as incoming concurrent requests may be split between morevmselectnodes.
Cluster Availability
- The HTTP load balancer needs to stop routing requests to unavailable
vminsertandvmselectnodes. - If at least one
vmstoragenode exists, the cluster is still available.vminsertreroutes incoming data from an unavailablevmstoragenode to a healthyvmstoragenode- If at least one
vmstoragenode is available, thenvmselectcontinues to provide partial responses. Pass the-search.denyPartialResponseflag tovmselector thedeny_partial_response=1query parameter in the request tovmselectif consistency of availability is a priority.
De-duplication
If the -dedup.minScrapeInterval command line flag is set to a time greater than 0, VictoriaMetrics will remove duplicate data points. For example, -dedup.minScrapeInterval=60s will deduplicate data points on the same time series, and if they are in the same discrete 60-second storage bucket, the earliest data point will be retained. In the case of equal timestamps, any data point will be retained.
The recommended value for -dedup.minScrapeInterval is equal to the value of scrape_interval in the Prometheus configuration and it is recommended to use one scrape_interval configuration for all crawl targets.
Deduplication reduces disk space usage if multiple identically configured vmagent or Prometheus instances in HA write data to the same VictoriaMetrics instance. These vmagent or Prometheus instances must have the same external_labels section in their configurations, so they write data to the same time series.
Capacity Planning
Cluster capacity scales linearly with available resources, and the amount of CPU and memory required per node type depends heavily on the workload - number of active time series, series churn rate, query type, query QPS, etc. It is recommended to deploy a test VictoriaMetrics cluster for your production workload and iteratively tune the resources per node and the number of nodes per node type until the cluster becomes stable. It is also recommended to set up monitoring for the cluster to help identify bottlenecks in the cluster setup.
Specifying the required storage space to be reserved (which can be set via the -retentionPeriod command line flag in vmstorage) can be inferred from the disk space usage in a test run. For example, if the storage usage after a day’s run on a production workload is 10GB, it will require at least 10GB*100=1TB of disk space for -retentionPeriod=100d (100-day retention period). Storage usage can be monitored using the official Grafana dashboard for VictoriaMetrics clusters (https://grafana.com/grafana/dashboards/11176).
It is recommended that the following amount of spare resources be set aside.
- 50% of free memory in all node types to reduce the probability of crashing due to OOM during temporary spikes in workload.
- 50% free CPU across all node types to reduce the probability of slowdowns during temporary spikes in workload.
- At least 30% of free storage in the directory pointed to by the
-storageDataPathcommand line flag on the-vmstoragenode.
Some capacity planning tips for VictoriaMetrics clusters.
- Copy sets increase the amount of resources required by the cluster by up to N times, where N is the replication factor.
- Cluster capacity can be increased by adding more
vmstoragenodes and/or by increasing the memory and CPU resources pervmstoragenode for active time series. - Query latency can be reduced by increasing the number of
vmstoragenodes and/or by increasing the memory and CPU resources pervmselectnode. - The total number of CPU cores required for all
vminsertnodes can be calculated by the ingestion rate:CPUs = ingestion_rate / 100K. - The
-rpc.disableCompressioncommand line flag on thevminsertnode increases the ingestion capacity at the cost of higher network bandwidth usage betweenvminsertandvmstorage.
Copy and data security
By default, VictoriaMetrics data replication relies on the underlying storage pointed to by -storageDataPath for this purpose.
However, we can also manually enable replication by passing the -replicationFactor=N command parameter to vminsert, which ensures that if up to N-1 vmstorage nodes are unavailable, all data is still available for querying. The cluster must contain at least 2*N-1 vmstorage nodes, where N is the replication factor to maintain the specified replication factor for newly ingested data in the event that N-1 storage nodes are lost.
For example, when -replicationFactor=3 is passed to vminsert, it copies all ingested data to 3 different vmstorage nodes, so up to 2 vmstorage nodes can be lost without losing data. The minimum number of vmstorage nodes should be equal to 2*3-1 = 5, so when 2 vmstorage nodes are lost, the remaining 3 vmstorage nodes can serve the newly ingested data.
When replication is enabled, the -dedup.minScrapeInterval=1ms command line flag must be passed to the vmselect node. When up to N-1 vmstorage nodes are slow and/or temporarily unavailable, the optional -replicationFactor=N parameter can be passed to vmselect to improve query performance.
This is because vmselect does not wait for responses from up to N-1 vmstorage nodes. Sometimes the -replicationFactor on a vmselect node may result in a partial response. -dedup.minScrapeInterval=1ms Duplicate replicated data is removed during a query.
If deduplicated data is pushed to VictoriaMetrics from identically configured vmagent instances or Prometheus instances, -dedup.minScrapeInterval must be set to a larger value based on the deduplication documentation.
Please note that replication does not save from disaster, so it is recommended to perform regular backups. Also replication increases resource usage - CPU, memory, disk space, network bandwidth - by up to -replicationFactor times. So it can be guaranteed by moving replication to the underlying storage pointed to by -storageDataPath, such as Google Compute Engine permanent disks, which protect against data loss and data corruption, and which also provide consistently high performance and can be resized without downtime. For most use cases, HDD-based persistent disks should be sufficient.
Backups
It is recommended to perform regular backups from instant snapshots to prevent errors such as accidental data deletion. The following steps must be performed for each vmstorage node to create a backup.
- An instant snapshot can be created by accessing the
/snapshot/createHTTP handler, which will create the snapshot and return its name. - Use the
vmbackupcomponent to archive the created snapshot from the<-storageDataPath>/snapshots/<snapshot_name>folder. The archiving process does not interfere withvmstoragework, so it can be performed at any suitable time. - Delete unused snapshots via
/snapshot/delete?snapshot=<snapshot_name>or/snapshot/delete_allto free up occupied storage space. - No need to synchronize backups between all
vmstoragenodes.
To restore from a backup.
- Stop the
vmstoragenode usingkill -INT. - Use the
vmrestorecomponent to restore data from the backup to the-storageDataPathdirectory. - Start the
vmstoragenode.
After understanding some configuration details of VM clustering, let’s start deploying the VM cluster next.
Deployment
If you already know the VM components well, then a one-click installation using Helm Chart is recommended.
|
|
The reason we choose to deploy manually here is to get more details about each component.
Since the vmstorage component is stateless, we first deploy it using StatefulSet, and since the component is also scalable, we first deploy two copies, with the following list of resources.
|
|
First of all, you need to create a Headless Service, because the later components need to access to each specific Pod. In the vmstorage startup parameters, you specify the indicator data retention duration through the --retentionPeriod parameter, 1 means one month, which is also the default duration, and then you specify the data storage path through the -- storageDataPath parameter specifies the data storage path, remember to persist the directory.
Again, just apply this resource directly.
|
|
Next, we can deploy the vmselect component, which is stateless and can be managed directly using Deployment, with the corresponding resource list file shown below.
|
|
The most important part of this is to specify all vmstorage node addresses via the --storageNode parameter, which we used above for the StatefulSet deployment, so it can be accessed directly using the FQDN form. To apply the above object directly.
|
|
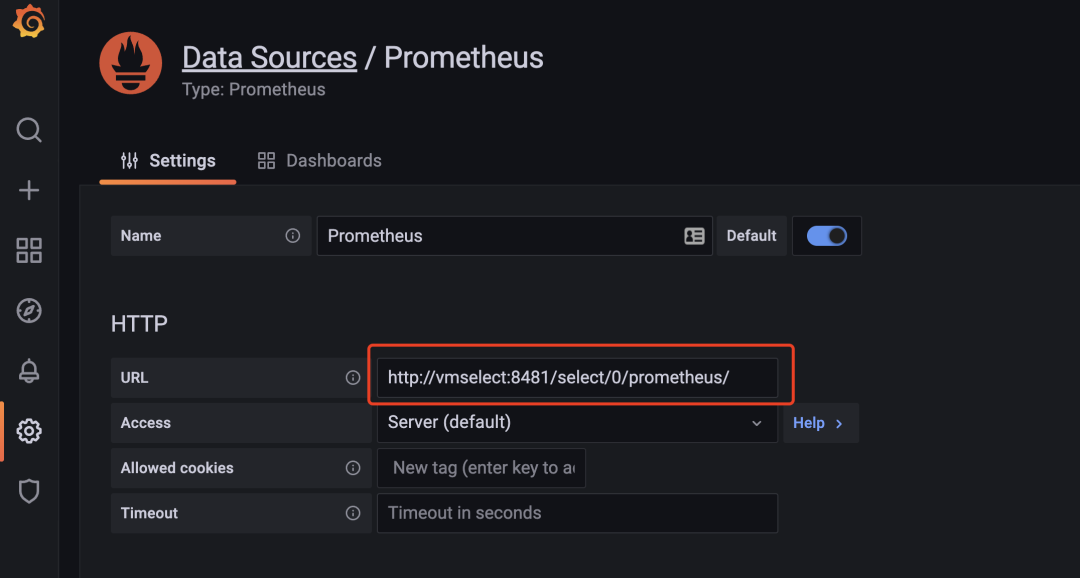
If we want to do a query, then we can just expose the vmselect service directly to the public by modifying the Grafana data source address to http://<select-service>/select/0/prometheus/ .
Then you need to deploy the vminsert component to receive the indicator data inserts, which is also stateless, and most importantly, you need to specify all vmstorage nodes with the --storageNode parameter.
|
|
Since it is inherently stateless, the number of replicas can be increased as needed, and the HPA can be configured for automatic expansion and contraction. Apply the resource list above directly.
|
|
After the deployment of the cluster mode components, we can also configure Prometheus in front of us to write its data to the VM remotely by modifying the address of remote_write to http://vminsert:8480/insert/0/prometheus/, which is different from the API of single-node mode. The path is different from the single-node mode API, as shown below.
|
|
Update the Prometheus configuration and start Prometheus, the previous VMs in standalone mode can be stopped first.
After successful configuration, normal data can start to be written to vmstorage. Checking the vmstorage logs, you can see that the partition was successfully created, which proves that the data is now being received.
|
|
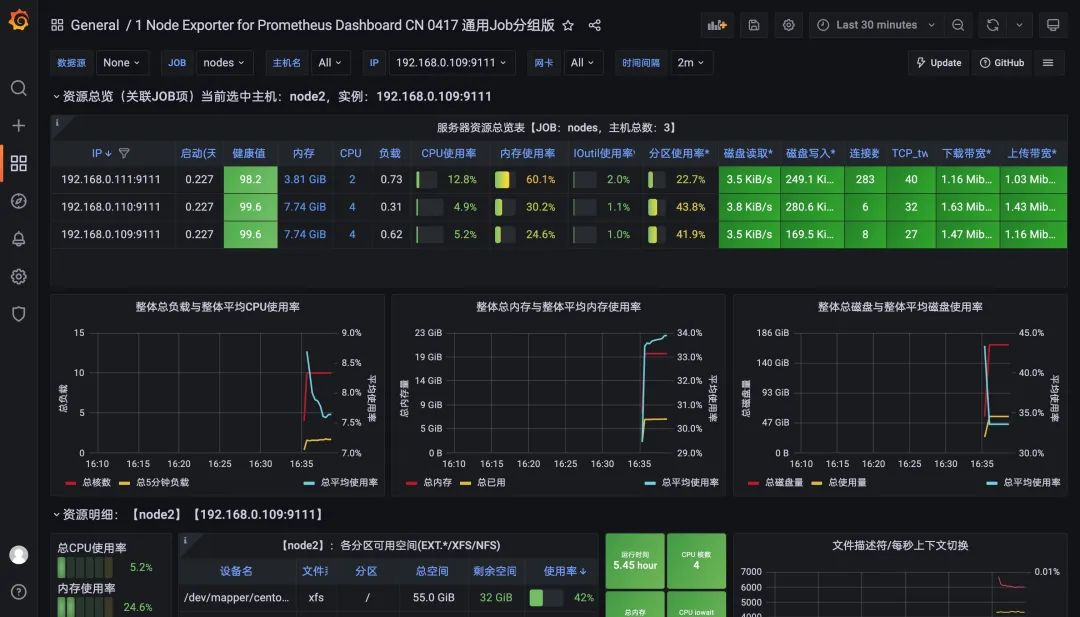
Then you can go to Grafana and recheck if the Dashboard is working.
If you need to add a new vmstorage node now, then you need to follow these steps.
- Start the new
vmstoragenode using the same-retentionPeriodconfiguration as the existing nodes in the cluster. - Restart all
vmselectnodes incrementally, adding a new-storageNodeparameter containing<new_vmstorage_host>. - Restart all
vminsertnodes incrementally, adding new-storageNodearguments containing<new_vmstorage_host>.