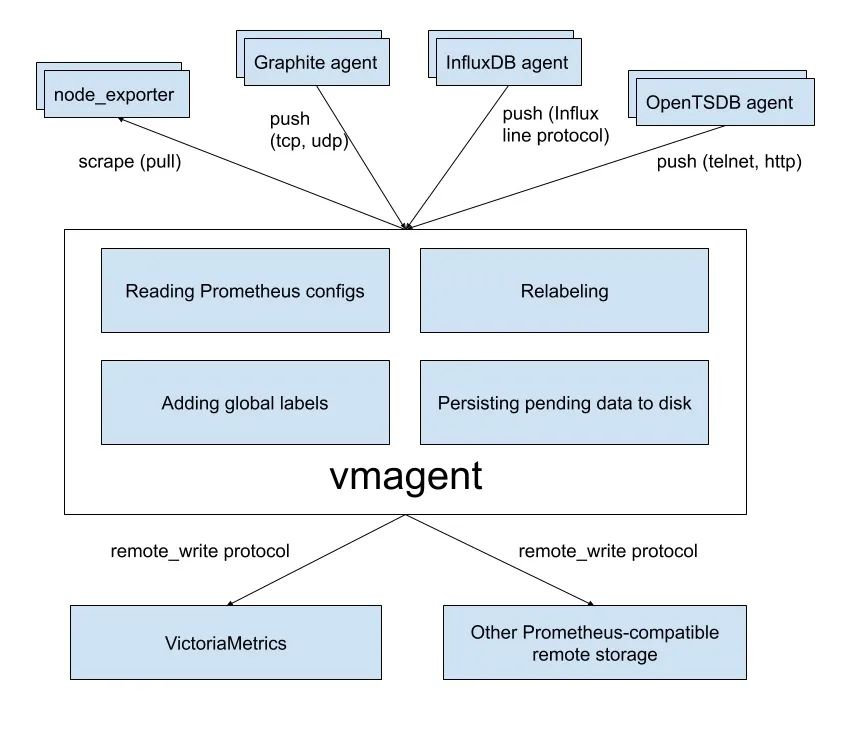
vmagent can help us collect metrics from various sources and store them in VMs or any other Prometheus-compatible storage system that supports the remote write protocol.
Features
vmagent has more flexibility than Prometheus for scraping metrics, such as the ability to push metrics in addition to pull metrics, and many other features.
- Can replace the scraping target of prometheus
- Support for reading and writing data from Kafka
- Supports adding, removing, and modifying labels based on prometheus relabeling patterns, and filtering data before it is sent to remote storage.
- Supports multiple data protocols, including influx line protocol, graphite text protocol, opentsdb protocol, prometheus remote write protocol, json lines protocol, csv data, etc.
- Support for data collection and replication to multiple remote storage systems at the same time
- Support unreliable remote storage, if remote storage is not available, the collected metrics will be buffered in
-remoteWrite.tmpDataPath, once the connection to remote storage is repaired, the buffered metrics will be sent to remote storage, the maximum disk usage of the buffer can be specified with -remoteWrite. maxDiskUsagePerURL to limit it.
- Uses less memory, cpu, disk io, and network bandwidth than prometheus
- When a large number of targets need to be crawled, the crawl targets can be spread across multiple vmagent instances
- High base and churn can be handled by limiting the number of unique time series before crawling time and sending them to remote storage systems
- scrape configuration can be loaded from multiple files
Deployment
Next, we’ll use the example of grabbing Kubernetes cluster metrics to illustrate how to use vmagent, which we’ll configure here using auto-discovery. vmagent is compatible with the kubernetes_sd_configs configuration in prometheus, so we can use that as well.
To make vmagent auto-discover monitored resource objects, you need to access the APIServer to get the resource objects, so first you need to configure the rbac permissions and create the resource list as shown below.
 1
 2
 3
 4
 5
 6
 7
 8
 9
10
11
12
13
14
15
16
17
18
19
20
21
22
23
24
25
26
27
28
29
30
31
32
33
34
35
36
37
38
39
40
41
42
43
|
# vmagent-rbac.yaml
apiVersion: v1
kind: ServiceAccount
metadata:
  name: vmagent
  namespace: kube-vm
---
apiVersion: rbac.authorization.k8s.io/v1
kind: ClusterRole
metadata:
  name: vmagent
rules:
  - apiGroups: ["", "networking.k8s.io", "extensions"]
    resources:
      - nodes
      - nodes/metrics
      - services
      - endpoints
      - endpointslices
      - pods
      - app
      - ingresses
    verbs: ["get", "list", "watch"]
  - apiGroups: [""]
    resources:
      - namespaces
      - configmaps
    verbs: ["get"]
  - nonResourceURLs: ["/metrics", "/metrics/resources"]
    verbs: ["get"]
---
apiVersion: rbac.authorization.k8s.io/v1
kind: ClusterRoleBinding
metadata:
  name: vmagent
roleRef:
  apiGroup: rbac.authorization.k8s.io
  kind: ClusterRole
  name: vmagent
subjects:
  - kind: ServiceAccount
    name: vmagent
    namespace: kube-vm
|
Then to add the vmagent configuration, we first configure only the task of auto-discovering Kubernetes nodes, creating the ConfigMap object as shown below.
 1
 2
 3
 4
 5
 6
 7
 8
 9
10
11
12
13
14
15
16
17
18
19
20
21
22
23
24
|
# vmagent-config.yaml
apiVersion: v1
kind: ConfigMap
metadata:
  name: vmagent-config
  namespace: kube-vm
data:
  scrape.yml: |
    global:
      scrape_interval: 15s
      scrape_timeout: 15s

    scrape_configs:
    - job_name: nodes
      kubernetes_sd_configs:
        - role: node
      relabel_configs:
      - source_labels: [__address__]
        regex: "(.*):10250"
        replacement: "${1}:9111"
        target_label: __address__
        action: replace
      - action: labelmap
        regex: __meta_kubernetes_node_label_(.+)
|
Here we get the node monitoring metrics by auto-discovering the Kubernetes node. Note that the default auto-discovery for the node role is to get the node’s 10250 port, here we need to replace it to 9111 via relabel.
Then add the vmagent deployment resource list as follows.
 1
 2
 3
 4
 5
 6
 7
 8
 9
10
11
12
13
14
15
16
17
18
19
20
21
22
23
24
25
26
27
28
29
30
31
32
33
34
35
36
37
38
39
40
41
42
43
44
45
46
47
48
49
50
51
52
53
54
55
56
57
|
# vmagent-deploy.yaml
apiVersion: v1
kind: PersistentVolumeClaim
metadata:
  name: vmagent-pvc
  namespace: kube-vm
spec:
  accessModes:
    - ReadWriteOnce
  resources:
    requests:
      storage: 1Gi
  storageClassName: nfs-client
---
apiVersion: apps/v1
kind: Deployment
metadata:
  name: vmagent
  namespace: kube-vm
  labels:
    app: vmagent
spec:
  selector:
    matchLabels:
      app: vmagent
  template:
    metadata:
      labels:
        app: vmagent
    spec:
      serviceAccountName: vmagent
      containers:
        - name: agent
          image: "victoriametrics/vmagent:v1.77.0"
          imagePullPolicy: IfNotPresent
          args:
            - -promscrape.config=/config/scrape.yml
            - -remoteWrite.tmpDataPath=/tmpData
            - -remoteWrite.url=http://vminsert:8480/insert/0/prometheus
            - -envflag.enable=true
            - -envflag.prefix=VM_
            - -loggerFormat=json
          ports:
            - name: http
              containerPort: 8429
          volumeMounts:
            - name: tmpdata
              mountPath: /tmpData
            - name: config
              mountPath: /config
      volumes:
        - name: tmpdata
          persistentVolumeClaim:
            claimName: vmagent-pvc
        - name: config
          configMap:
            name: vmagent-config
|
We mount the vmagent configuration to the container /config/scrape.yml via ConfigMap, and specify the remote write address via -remoteWrite.url=http://vminsert:8480/insert/0/prometheus, where we write to the previous There is another parameter -remoteWrite.tmpDataPath which will be used to cache the collected metrics when the remote storage is not available, and when the remote storage is repaired, the cached metrics will be sent to the remote write normally, so it is better to persist the directory.
Clustered mode
A single vmagent instance can crawl tens of thousands of crawl targets, but sometimes this is not enough due to CPU, network, memory, etc. limitations. In this case, the crawl targets can be split between multiple vmagent instances. Each vmagent instance in the cluster must use the same -promscrape.config profile with a different -promscrape.cluster.memberNum value, which must be in the 0 ... N-1 range, where N is the number of vmagent instances in the cluster. The number of vmagent instances in the cluster must be passed to the -promscrape.cluster.membersCount command line flag. For example, the following command propagates crawl targets across a cluster of two vmagent instances.
1
2
|
vmagent -promscrape.cluster.membersCount=2 -promscrape.cluster.memberNum=0 -promscrape.config=/path/config.yml ...
vmagent -promscrape.cluster.membersCount=2 -promscrape.cluster.memberNum=1 -promscrape.config=/path/config.yml ...
|
When the vmagent is running in Kubernetes, you can set -promscrape.cluster.memberNum to the StatefulSet pod name, and the pod name must end with 0 ... promscrape.cluster.memberNum-1, for example, -promscrape.cluster.memberNum=vmagent-0.
By default, each crawl target is only crawled by a single vmagent instance in the cluster. If you need to replicate the crawl target between multiple vmagent instances, you can set the -promscrape.cluster.replicationFactor parameter to the required number of replicas. For example, the following command starts a cluster with three vmagent instances, where each target is crawled by two vmagent instances.
1
2
3
|
vmagent -promscrape.cluster.membersCount=3 -promscrape.cluster.replicationFactor=2 -promscrape.cluster.memberNum=0 -promscrape.config=/path/to/config.yml ...
vmagent -promscrape.cluster.membersCount=3 -promscrape.cluster.replicationFactor=2 -promscrape.cluster.memberNum=1 -promscrape.config=/path/to/config.yml ...
vmagent -promscrape.cluster.membersCount=3 -promscrape.cluster.replicationFactor=2 -promscrape.cluster.memberNum=2 -promscrape.config=/path/to/config.yml ...
|
Note that if each target is crawled by multiple vmagent instances, deduplication must be enabled on the remote storage pointed to by -remoteWrite.url.
So if you are crawling very large monitoring targets, then we recommend using vmagent clustering mode, then you can use the StatefulSet method for deployment.
 1
 2
 3
 4
 5
 6
 7
 8
 9
10
11
12
13
14
15
16
17
18
19
20
21
22
23
24
25
26
27
28
29
30
31
32
33
34
35
36
37
38
39
40
41
42
43
44
45
46
47
48
49
50
51
52
53
54
55
56
57
58
59
60
61
62
63
64
65
66
67
68
69
70
71
72
73
74
75
76
77
78
|
# vmagent-sts.yaml
apiVersion: v1
kind: Service
metadata:
  name: vmagent
  namespace: kube-vm
  annotations:
    prometheus.io/scrape: "true"
    prometheus.io/port: "8429"
spec:
  selector:
    app: vmagent
  clusterIP: None
  ports:
    - name: http
      port: 8429
      targetPort: http
---
apiVersion: apps/v1
kind: StatefulSet
metadata:
  name: vmagent
  namespace: kube-vm
  labels:
    app: vmagent
spec:
  replicas: 2
  serviceName: vmagent
  selector:
    matchLabels:
      app: vmagent
  template:
    metadata:
      labels:
        app: vmagent
    spec:
      serviceAccountName: vmagent
      containers:
        - name: agent
          image: victoriametrics/vmagent:v1.77.0
          imagePullPolicy: IfNotPresent
          args:
            - -promscrape.config=/config/scrape.yml
            - -remoteWrite.tmpDataPath=/tmpData
            - -promscrape.cluster.membersCount=2
            # - -promscrape.cluster.replicationFactor=2 # 可以配置副本数
            - -promscrape.cluster.memberNum=$(POD_NAME)
            - -remoteWrite.url=http://vminsert:8480/insert/0/prometheus
            - -envflag.enable=true
            - -envflag.prefix=VM_
            - -loggerFormat=json
          ports:
            - name: http
              containerPort: 8429
          env:
            - name: POD_NAME
              valueFrom:
                fieldRef:
                  fieldPath: metadata.name
          volumeMounts:
            - name: tmpdata
              mountPath: /tmpData
            - name: config
              mountPath: /config
      volumes:
        - name: config
          configMap:
            name: vmagent-config
  volumeClaimTemplates:
    - metadata:
        name: tmpdata
      spec:
        accessModes:
          - ReadWriteOnce
        storageClassName: nfs-client
        resources:
          requests:
            storage: 1Gi
|
We’ll manage the vmagent here in the form of a StatefulSet, applying the above resources directly.
1
2
3
4
5
6
7
8
9
|
# First stop the prometheus in the previous example
☸ ➜ kubectl scale deploy prometheus --replicas=0 -n kube-vm
☸ ➜ kubectl apply -f vmagent-rbac.yaml
☸ ➜ kubectl apply -f vmagent-config.yaml
☸ ➜ kubectl apply -f vmagent-sts.yaml
☸ ➜ kubectl get pods -n kube-vm -l app=vmagent
NAME        READY   STATUS    RESTARTS   AGE
vmagent-0   1/1     Running   0          3m43s
vmagent-1   1/1     Running   0          2m9s
|
Here we have deployed two instances of vmagent to capture monitoring metrics, we have 3 nodes in total.
1
2
3
4
5
|
☸ ➜ kubectl get nodes
NAME      STATUS   ROLES                  AGE   VERSION
master1   Ready    control-plane,master   44d   v1.22.8
node1     Ready    <none>                 44d   v1.22.8
node2     Ready    <none>                 44d   v1.22.8
|
So the two vmagent instances will collect some of the metrics separately, and we can verify it by checking the logs.
1
2
3
4
5
6
7
|
☸ ➜ kubectl logs -f vmagent-0 -n kube-vm
# ......
{"ts":"2022-05-10T04:44:44.004Z","level":"info","caller":"VictoriaMetrics/lib/promscrape/scraper.go:393","msg":"static_configs: added targets: 1, removed targets: 0; total targets: 1"}
{"ts":"2022-05-10T04:44:44.006Z","level":"info","caller":"VictoriaMetrics/lib/promscrape/scraper.go:393","msg":"kubernetes_sd_configs: added targets: 2, removed targets: 0; total targets: 2"}
☸ ➜ kubectl logs -f vmagent-1 -n kube-vm
# ......
{"ts":"2022-05-10T04:46:17.893Z","level":"info","caller":"VictoriaMetrics/lib/promscrape/scraper.go:393","msg":"kubernetes_sd_configs: added targets: 1, removed targets: 0; total targets: 1"}
|
From the logs, we can see that the vmagent-0 instance found 2 targets and the vmagent-1 instance found 1 target, which is what we expected.
Next, we will add other content monitoring, such as APIServer, containers, etc. The configuration is shown below.
  1
  2
  3
  4
  5
  6
  7
  8
  9
 10
 11
 12
 13
 14
 15
 16
 17
 18
 19
 20
 21
 22
 23
 24
 25
 26
 27
 28
 29
 30
 31
 32
 33
 34
 35
 36
 37
 38
 39
 40
 41
 42
 43
 44
 45
 46
 47
 48
 49
 50
 51
 52
 53
 54
 55
 56
 57
 58
 59
 60
 61
 62
 63
 64
 65
 66
 67
 68
 69
 70
 71
 72
 73
 74
 75
 76
 77
 78
 79
 80
 81
 82
 83
 84
 85
 86
 87
 88
 89
 90
 91
 92
 93
 94
 95
 96
 97
 98
 99
100
101
102
103
104
105
106
107
108
|
# vmagent-config2.yaml
apiVersion: v1
kind: ConfigMap
metadata:
  name: vmagent-config
  namespace: kube-vm
data:
  scrape.yml: |
    global:
      scrape_interval: 15s
      scrape_timeout: 15s

    scrape_configs:

    - job_name: nodes
      kubernetes_sd_configs:
        - role: node
      relabel_configs:
      - source_labels: [__address__]
        regex: "(.*):10250"
        replacement: "${1}:9111"
        target_label: __address__
        action: replace
      - action: labelmap
        regex: __meta_kubernetes_node_label_(.+)

    - job_name: apiserver
      scheme: https
      bearer_token_file: /var/run/secrets/kubernetes.io/serviceaccount/token
      tls_config:
        ca_file: /var/run/secrets/kubernetes.io/serviceaccount/ca.crt
        insecure_skip_verify: true
      kubernetes_sd_configs:
      - role: endpoints
      relabel_configs:
      - action: keep
        regex: default;kubernetes;https
        source_labels:
        - __meta_kubernetes_namespace
        - __meta_kubernetes_service_name
        - __meta_kubernetes_endpoint_port_name

    - job_name: cadvisor
      bearer_token_file: /var/run/secrets/kubernetes.io/serviceaccount/token
      scheme: https
      tls_config:
        ca_file: /var/run/secrets/kubernetes.io/serviceaccount/ca.crt
        insecure_skip_verify: true
      kubernetes_sd_configs:
      - role: node
      relabel_configs:
      - action: labelmap
        regex: __meta_kubernetes_node_label_(.+)
      - replacement: /metrics/cadvisor
        target_label: __metrics_path__

    - job_name: endpoints
      kubernetes_sd_configs:
      - role: endpoints
      relabel_configs:
      - action: drop
        regex: true
        source_labels:
        - __meta_kubernetes_pod_container_init
      - action: keep_if_equal
        source_labels:
        - __meta_kubernetes_service_annotation_prometheus_io_port
        - __meta_kubernetes_pod_container_port_number
      - action: keep
        regex: true
        source_labels:
        - __meta_kubernetes_service_annotation_prometheus_io_scrape
      - action: replace
        regex: (https?)
        source_labels:
        - __meta_kubernetes_service_annotation_prometheus_io_scheme
        target_label: __scheme__
      - action: replace
        regex: (.+)
        source_labels:
        - __meta_kubernetes_service_annotation_prometheus_io_path
        target_label: __metrics_path__
      - action: replace
        regex: ([^:]+)(?::\d+)?;(\d+)
        replacement: $1:$2
        source_labels:
        - __address__
        - __meta_kubernetes_service_annotation_prometheus_io_port
        target_label: __address__
      - action: labelmap
        regex: __meta_kubernetes_service_label_(.+)
      - source_labels:
        - __meta_kubernetes_pod_name
        target_label: pod
      - source_labels:
        - __meta_kubernetes_namespace
        target_label: namespace
      - source_labels:
        - __meta_kubernetes_service_name
        target_label: service
      - replacement: ${1}
        source_labels:
        - __meta_kubernetes_service_name
        target_label: job
      - action: replace
        source_labels:
        - __meta_kubernetes_pod_node_name
        target_label: node
|
Most of the configurations are described in the previous Prometheus chapters, and the core is to control the task of crawling through relabel_configs. vmagent is compatible with the traditional prometheus relabeling rules, but there are some unique actions, for example, in the above configuration we use a keep_if_ equal action, which means that if the specified tag values are equal, the data will be kept.
Sometimes, if an indicator contains two tags with the same value, it needs to be deleted. This can be done with the drop_if_equal operation supported by vmagent. For example, if the following relabel rule contains the same label value for real_port and required_port, it will delete the indicator.
1
2
|
- action: drop_if_equal
  source_labels: [real_port, needed_port]
|
This rule will remove the following indicator: foo{real_port="123",needed_port="123"}, but will keep the following indicator: foo{real_port="123",needed_port="456"}.
Sometimes it may be necessary to apply relabel to only a subset of indicators, in which case the if option can be added to the relabel_configs rule. For example, the following rule adds the {foo="bar"} label only to indicators that match the metric{label=~"x|y"} sequence selector.
1
2
3
|
- if: 'metric{label=~"x|y"}'
  target_label: "foo"
  replacement: "bar"
|
The if option simplifies traditional relabel_configs rules, for example, the following rule removes indicators that match the foo{bar="baz"} sequential selector.
1
2
|
- if: 'foo{bar="baz"}'
  action: drop
|
This corresponds to the following traditional rules.
1
2
3
|
- action: drop
  source_labels: [__name__, bar]
  regex: "foo;baz"
|
However, note that Prometheus does not yet support the if option and now only supports VictoriaMetrics.
Now update the vmagent configuration.
1
|
☸ ➜ kubectl apply -f vmagent-config2.yaml
|
There are two ways to configure a refresh.
- Sending a SUGHUP signal to the vmagent process
- send an http request to
http://vmagent:8429/-/reload
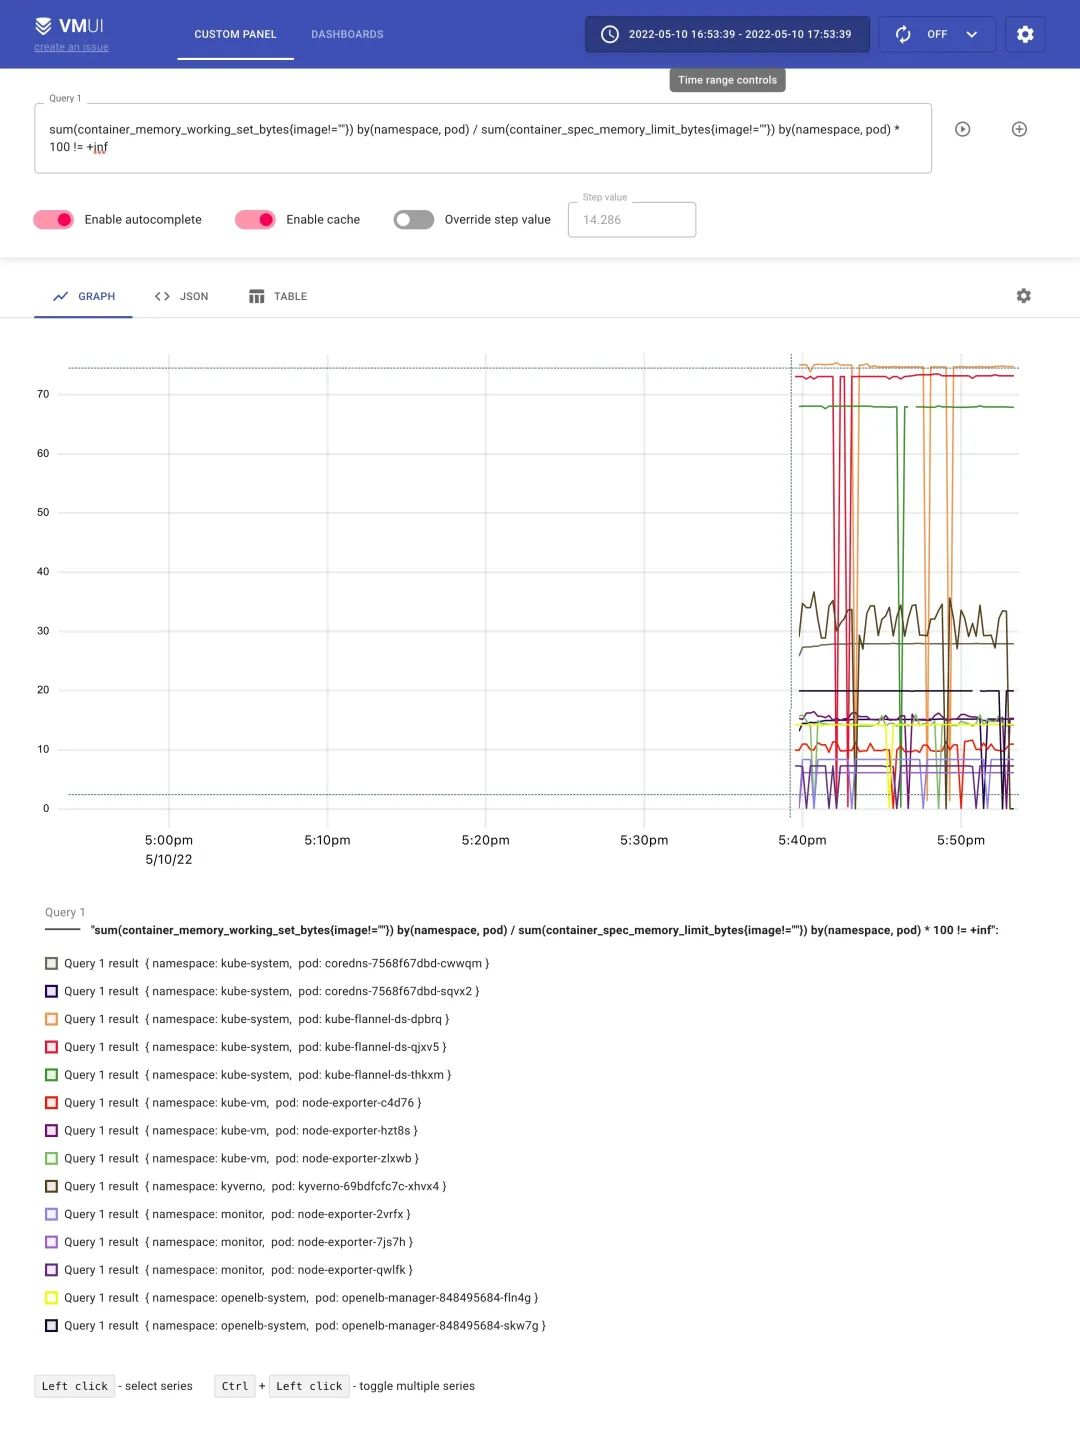
After refreshing, we can start collecting the above metrics, and we can also access vmui via http://vmselect/select/0/vmui/. For example, if we want to query the memory usage of the pod, we can use the following query statement.
1
|
sum(container_memory_working_set_bytes{image!=""}) by(namespace, pod) / sum(container_spec_memory_limit_bytes{image!=""}) by(namespace, pod) * 100 != +inf
|
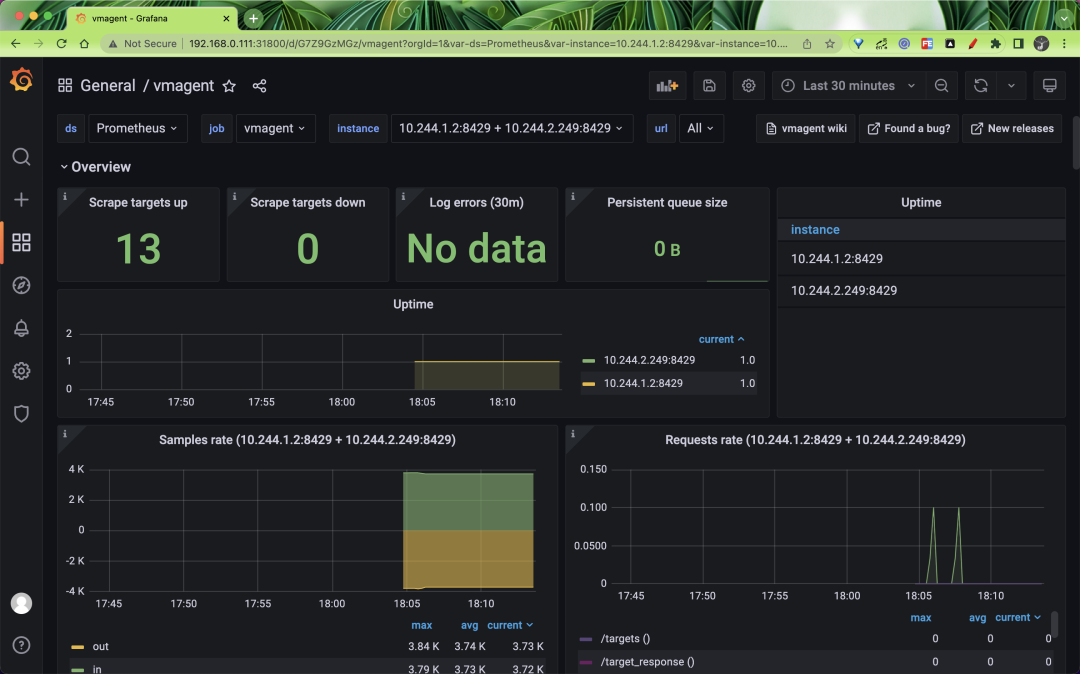
vmagent is an important part of collecting metrics, and of course, monitoring it is indispensable. vmagent exposes many metrics through http://vmagent:8429/metrics, such as vmagent_remotewrite_conns remote storage connections, vm_allowed_memory _bytes the amount of memory that can be used. We have collected some important metrics and presented them through Grafana to better help us analyze the state of vmagent.
We can use Vmagentby DASHBOARD to show the status of the vmagent.