If you need to monitor the network status between two hosts, hosts and external services, then try the Blackbox Exporter mentioned in this article.
1. Install Blackbox
-
Download the binary package
1
2
3
4
5
|
wget https://github.com/prometheus/blackbox_exporter/releases/download/v0.21.0/blackbox_exporter-0.21.0.linux-amd64.tar.gz
tar -xzvf blackbox_exporter-0.21.0.linux-amd64.tar.gz
mv blackbox_exporter-0.21.0.linux-amd64/blackbox_exporter /usr/bin/
mkdir /etc/prometheus
mv blackbox_exporter-0.21.0.linux-amd64/blackbox.yml /etc/prometheus/
|
-
Clean up the installation package
1
|
rm -rf blackbox_exporter-0.21.0.linux-amd64*
|
-
Create a new Systemd service
1
|
vim /usr/lib/systemd/system/blackbox_exporter.service
|
Add the following content:
 1
 2
 3
 4
 5
 6
 7
 8
 9
10
11
12
|
[Unit]
Description=blackbox_exporter
After=network.target

[Service]
Restart=on-failure
ExecStart=/usr/bin/blackbox_exporter \
    --config.file=/etc/prometheus/blackbox.yml
Restart=on-failure

[Install]
WantedBy=multi-user.target
|
-
Start Service
1
2
|
systemctl enable blackbox_exporter
systemctl start blackbox_exporter
|
-
Check the running status
1
|
systemctl status blackbox_exporter
|
2. Test host external access connectivity
blackbox_exporter exposes the service on local port 9115 by default.
In fact, by splicing URLs, we can test the connectivity of a host to any service, here is an example, we only need to provide target and module parameters, where target means the target of the test, and module means the module for testing:
To access http://BLACKBOX_HOST_IP:9115/probe?target=google.com&module=http_2xx, you need to replace BLACKBOX_HOST_IP with the host IP.
 1
 2
 3
 4
 5
 6
 7
 8
 9
10
11
12
13
14
15
16
17
18
19
20
21
22
23
24
25
26
27
28
29
30
31
32
33
34
35
36
37
38
39
40
41
42
43
|
# HELP probe_dns_lookup_time_seconds Returns the time taken for probe dns lookup in seconds
# TYPE probe_dns_lookup_time_seconds gauge
probe_dns_lookup_time_seconds 0.030818323
# HELP probe_duration_seconds Returns how long the probe took to complete in seconds
# TYPE probe_duration_seconds gauge
probe_duration_seconds 0.353982702
# HELP probe_failed_due_to_regex Indicates if probe failed due to regex
# TYPE probe_failed_due_to_regex gauge
probe_failed_due_to_regex 0
# HELP probe_http_content_length Length of http content response
# TYPE probe_http_content_length gauge
probe_http_content_length -1
# HELP probe_http_duration_seconds Duration of http request by phase, summed over all redirects
# TYPE probe_http_duration_seconds gauge
probe_http_duration_seconds{phase="connect"} 0.08580119300000001
probe_http_duration_seconds{phase="processing"} 0.201979714
probe_http_duration_seconds{phase="resolve"} 0.060847821999999996
probe_http_duration_seconds{phase="tls"} 0
probe_http_duration_seconds{phase="transfer"} 0.003931112
# HELP probe_http_redirects The number of redirects
# TYPE probe_http_redirects gauge
probe_http_redirects 3
# HELP probe_http_ssl Indicates if SSL was used for the final redirect
# TYPE probe_http_ssl gauge
probe_http_ssl 0
# HELP probe_http_status_code Response HTTP status code
# TYPE probe_http_status_code gauge
probe_http_status_code 200
# HELP probe_http_uncompressed_body_length Length of uncompressed response body
# TYPE probe_http_uncompressed_body_length gauge
probe_http_uncompressed_body_length 13645
# HELP probe_http_version Returns the version of HTTP of the probe response
# TYPE probe_http_version gauge
probe_http_version 1.1
# HELP probe_ip_addr_hash Specifies the hash of IP address. It's useful to detect if the IP address changes.
# TYPE probe_ip_addr_hash gauge
probe_ip_addr_hash 4.032438981e+09
# HELP probe_ip_protocol Specifies whether probe ip protocol is IP4 or IP6
# TYPE probe_ip_protocol gauge
probe_ip_protocol 4
# HELP probe_success Displays whether or not the probe was a success
# TYPE probe_success gauge
probe_success 1
|
There is a very detailed description of these metrics in the annotations, DNS latency, response, protocol, etc.
3. Prometheus Configuration
Next, we can have Prometheus capture blackbox metrics on a regular basis. Here is the relevant configuration file, you need to replace BLACKBOX_HOST_IP with the IP address of the blackbox_exporter deployment host.
 1
 2
 3
 4
 5
 6
 7
 8
 9
10
11
12
13
14
15
16
17
18
19
20
21
22
23
24
25
26
27
28
29
30
31
32
33
|
    scrape_configs:
    - job_name: 'blackbox_http'
      metrics_path: /probe
      params:
        module: [http_2xx]
      static_configs:
      - targets: ['github.com']
        labels:
          url: 'github.com'
      - targets: ['dl-cdn.alpinelinux.org']
        labels:
          url: 'dl-cdn.alpinelinux.org'
      relabel_configs:
      - source_labels: [__address__]
        target_label: __param_target
      - target_label: __address__
        replacement: BLACKBOX_HOST_IP:9115
    - job_name: 'blackbox_icmp'
      metrics_path: /probe
      params:
        module: [icmp]
      static_configs:
      - targets: ['github.com']
        labels:
          url: 'github.com'
      - targets: ['dl-cdn.alpinelinux.org']
        labels:
          url: 'dl-cdn.alpinelinux.org'
      relabel_configs:
      - source_labels: [__address__]
        target_label: __param_target
      - target_label: __address__
        replacement: BLACKBOX_HOST_IP:9115
|
4. Configuring the Grafana Panel
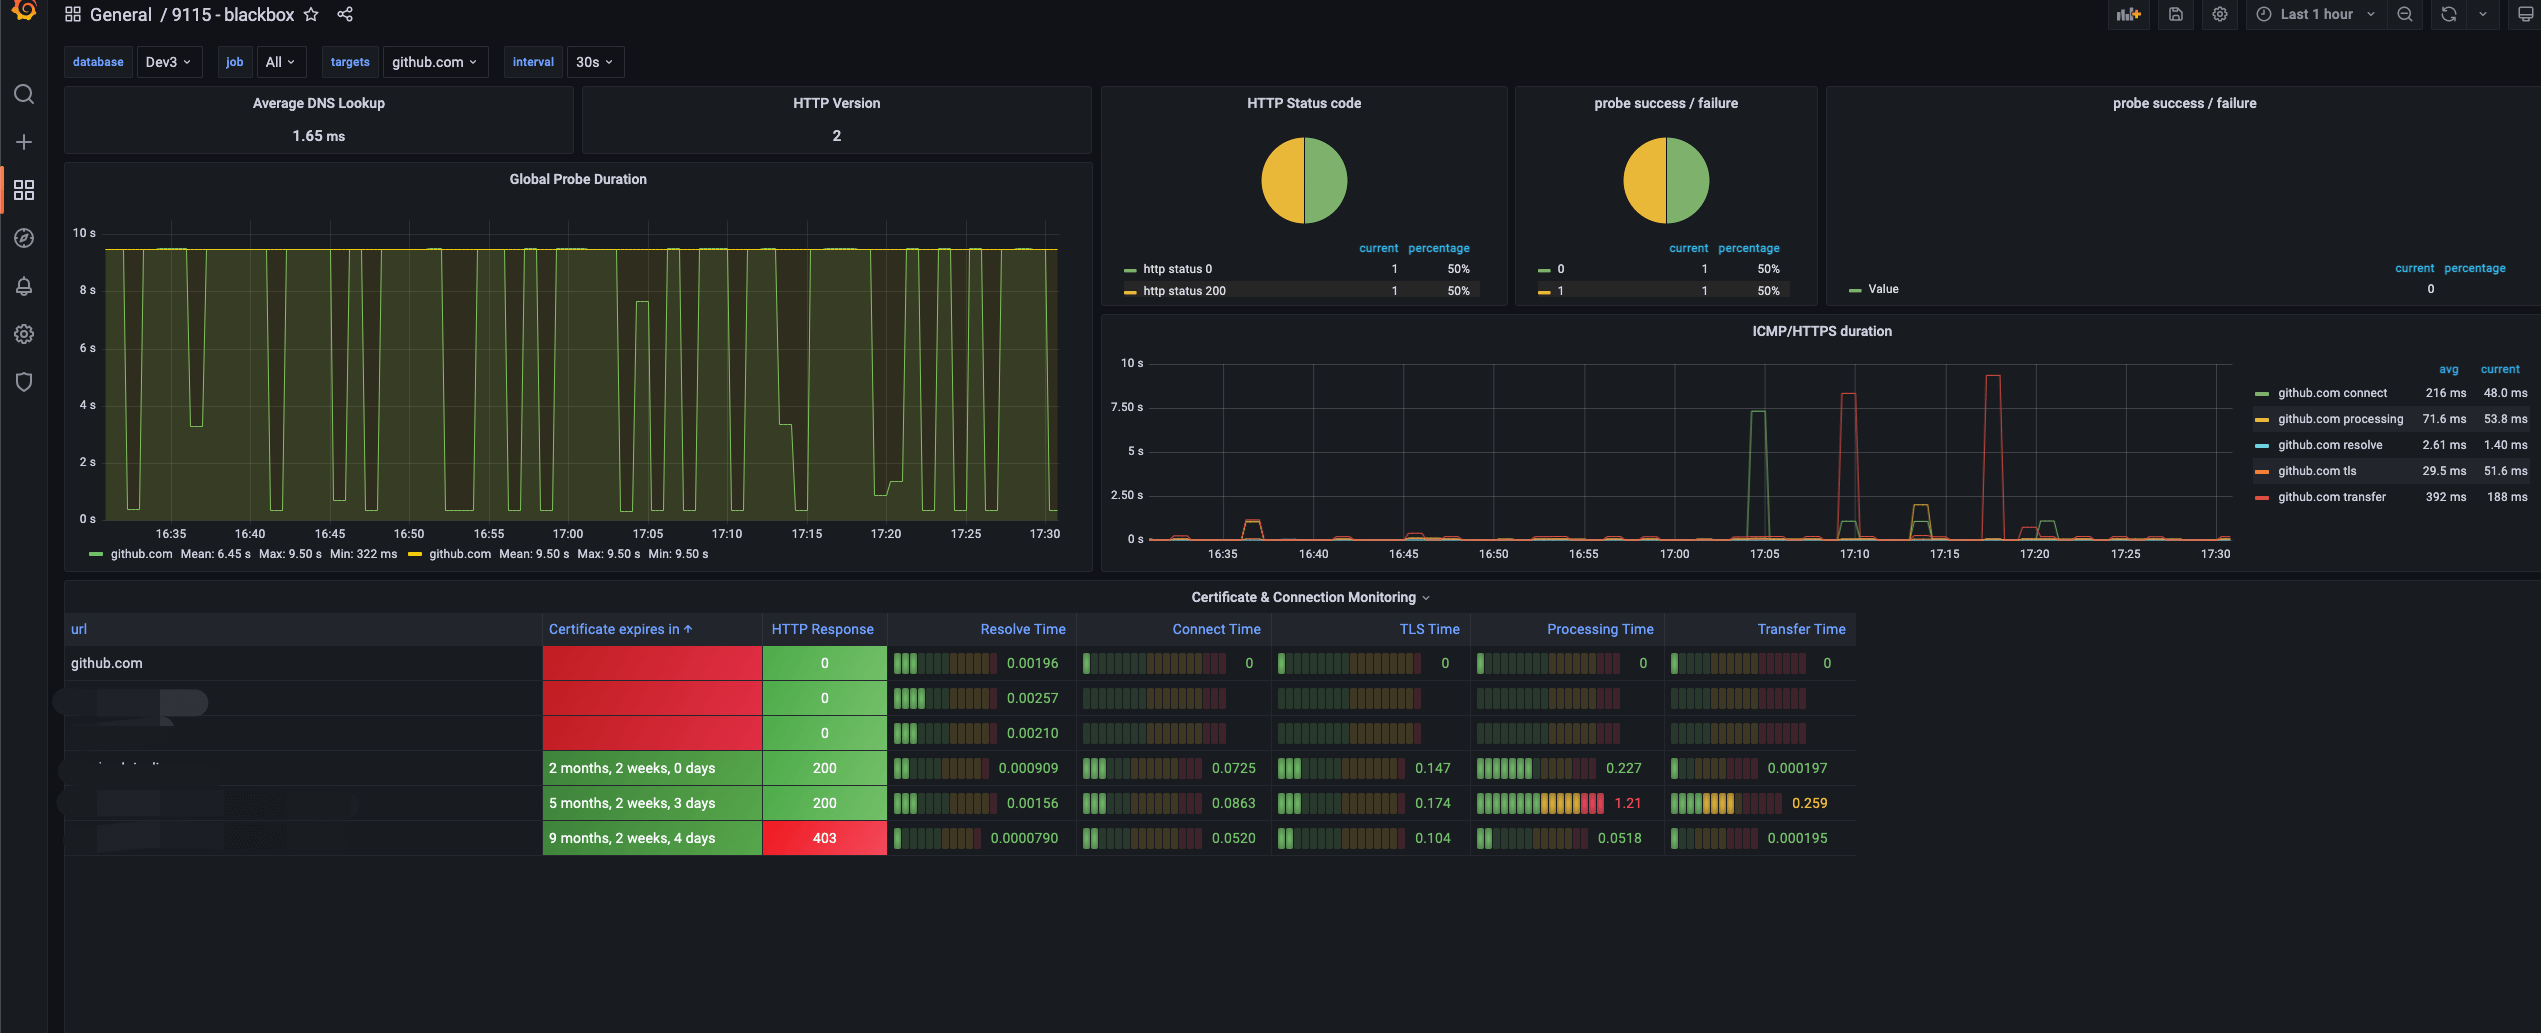
The panel used here is https://grafana.com/grafana/dashboards/13587.
With a few tweaks, the final look is as follows:
Slight adjustments were made and the final look is as follows.
5. Possible problems encountered
5.1 probe_http_status_code status code is always 0
blackbox_exporter is using the ipv6 stack by default, and needs to be manually specified as ipv4.
Edit the configuration file /etc/prometheus/blackbox.yml to specify the ipv4 stack.
1
2
3
4
5
|
modules:
  http_2xx:
    prober: http
    http:
      preferred_ip_protocol: "ipv4"
|
Then, restart the service.
1
|
systemctl restart blackbox_exporter
|
5.2 Grafana cannot find grafana-piechart-panel