cLoki is a more flexible Loki-compatible LogQL API built on top of ClickHouse.
- Built-in Explore UI and LogQL CLI for querying and extracting data.
- Native Grafana and LogQL API for querying, processing, ingesting, tracking, and alerting.
- Powerful pipeline to dynamically search, filter, and extract data from logs, events, and more.
- Ingestion and push APIs compatible with LogQL, PromQL, InfluxDB, Elastic, etc.
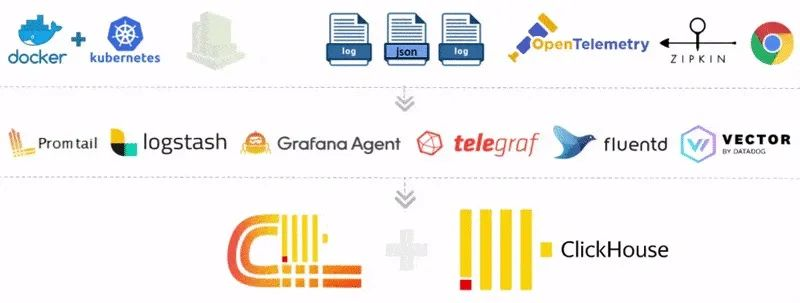
- Works with agents such as Promtail, Grafana-Agent, Vector, Logstash, Telegraf, etc.
- Cloud-native, stateless design.
The Loki API and its native Grafana integration are excellent and easy to use - but we prefer ClickHouse.
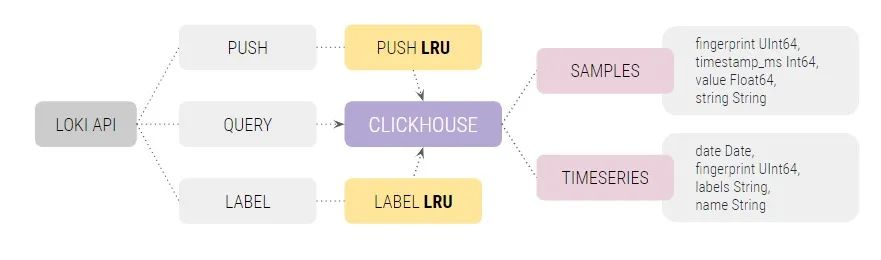
cLoki implements a full LogQL API that is cached by a fast bulk LUR on top of ClickHouse tables and relies on its columnar search and insert performance and reliable distribution and clustering capabilities for stored data. Like Loki, cLoki does not parse or index incoming logs, but instead groups log streams using the same tagging system as Prometheus.
Features
🔥 LogQL support
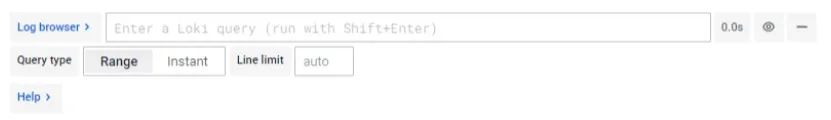
cLoki implements LogQL queries to provide compatibility with the Loki API. grafana Loki data source can be used to query logs and display extracted time series locally, no additional plugins are required.
⛽ Log Streaming
cLoki supports Push API input through the use of JSON or Protobuf, which is compatible with Promtail and any other Loki agent. In addition to this, cLoki can accept and convert logs and metrics inserts using Influx, Elastic, Tempo and other common API formats.
Our preferred tool for parsing and sending log streams to cLoki is paStash, which has extensive interpolation capabilities, can create labels and prune any log, and is recommended for sending logs in JSON format when working with metrics.
Tempo Support
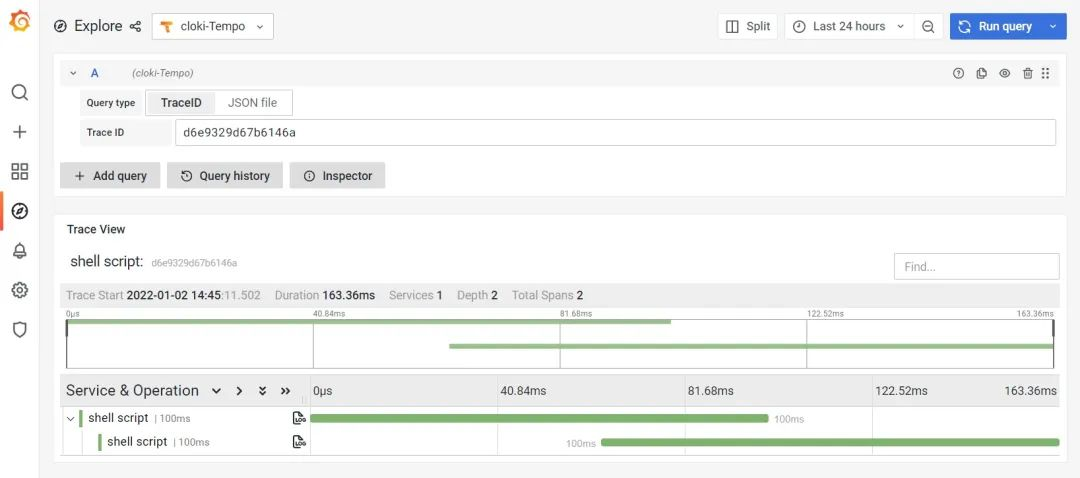
cLoki Pulse provides experimental support for the Grafana Tempo API, providing cross-degree ingestion and querying.
At the database level, Tempo Spans/Traces are stored as tagged logs and can be accessed from LogQL and Tempo APIs.
Installation
Docker
If you use Docker, just add our container to your Stack to send traffic. cLoki instances are stateless and load balancer friendly.
Manual Installation
Before doing a manual installation, the following requirements must be in place.
- The
clickhouse-serverservice must come with HTTP+ authentication. nodejs14.x or 16.x, withnpminstalled.
Then install cloki and pm2.
|
|
Start cloki with pm2 and use your clickhouse-server instance to connect.
In addition, cloki instances can also be started and managed using the pm2 configuration file.
|
|
Check service status.
|
|
If there are no errors, then you can save your service and start it.
Of course, you can also deploy to Kubernetes. For more information on how to use cLoki, go to the official documentation page at https://github.com/lmangani/cLoki/wiki.