In a production environment, Go programs may occasionally experience CPU spikes, and the monitoring panel can’t see what’s causing the spike, except in cases of high concurrency at certain times. The Go language natively provides the tool pprof, which is explained by Google as a tool for visualizing and analyzing data.
By using Go pprof, you can profile the CPU performance, memory usage, Goroutine wait share resource, and mutex lock of your program. We can use this tool to collect runtime performance metrics to analyze whether the program has unreasonable resource usage due to poorly written code, so we can optimize the program to improve its performance.
Features
Go pprof provides the following five different dimensions for observing its programs.
- CPU Profiling: CPU performance analysis, which listens to the CPU usage of its Go programs according to the specified time collection, and can determine in which program segment the Go program is consuming the CPU for a long time.
- Memory Profiling: Memory performance analysis, which is used to analyze the memory stack area usage of a program, and to detect the presence of memory leaks.
- Block Profiling : Goroutine waiting for shared resource blocking analysis.
- Mutex Profiling : Mutex lock analysis, used to report on the contention of shared resources using mutex locks.
- Goroutine Profiling : Concurrent performance analysis, used to report on Goroutine operations and their number for the current runtime.
Usage
Go pprof tool is also relatively simple and fast, you can use the runtime/pprof package to generate a profile file, there are many tutorials on the Internet, here is not too much description, you can look in detail at the package provided by the function, which describes The usage is described above.
Currently we mainly use the net/http/pprof package to start a separate port number http program for Go program analysis, with the graphviz component to visualize the program to analyze the data, it is also relatively easy to use.
The first step is to reference the net/http/pprof package to the program, which is recommended to be placed directly under the main.go file at the program entry.
The second step is not necessary if the application itself is an http application. If you are not an http web application or do not want to expose the corresponding information to the extranet, you can start a separate http web application to listen exclusively to the service.
Step 3: Run the main program and access the pprof interface.
|
|
Add the query parameter ?debug=1 to the URL to visualize the corresponding description, or download it as a profile file without adding it and use the pprof command to visualize the corresponding data.
Step 4: Use the go tool pprof -http=:6001 profile command to view the analyzer.
Analysis
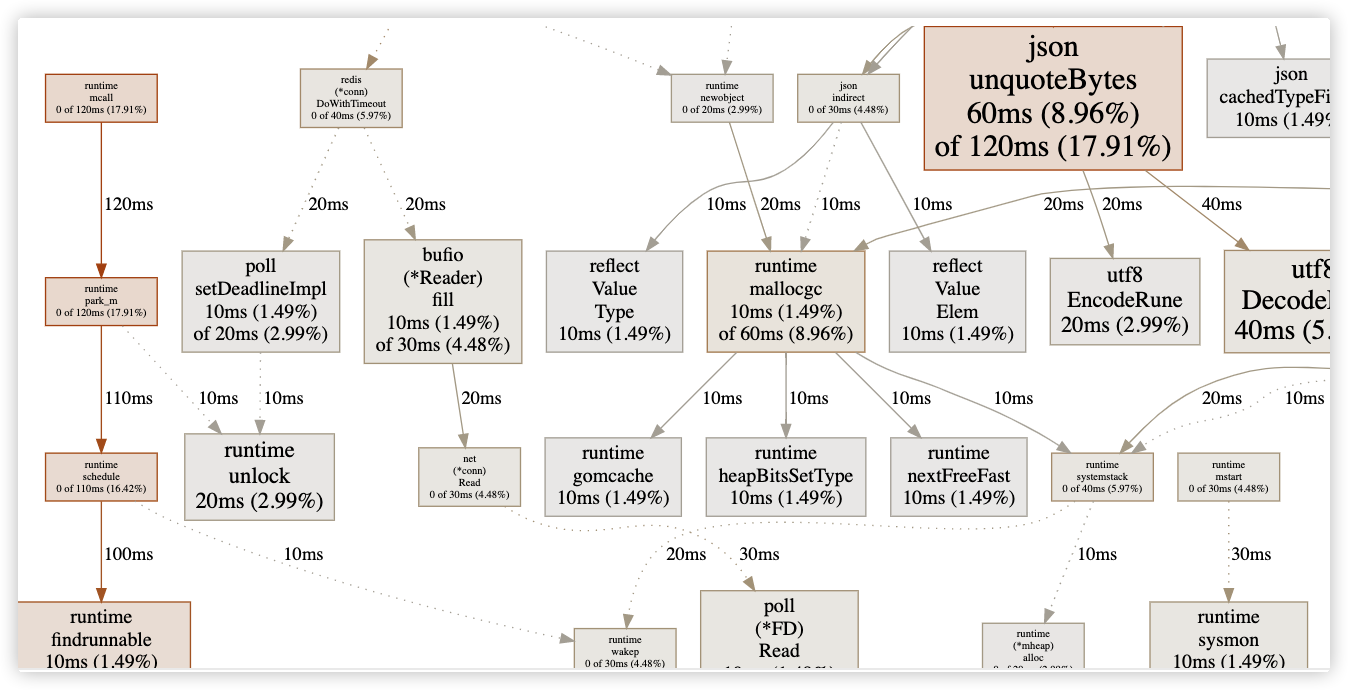
The above figure is a visualization of CPU usage, the thicker the arrow and the bigger the square means the corresponding operation consumes more CPU, we can see that the operation that consumes the most CPU is the serialization and deserialization of json.
Similarly, the corresponding memory performance and Goroutine blocking can be seen in the analysis of the corresponding operations.
Summary
Using the go pprof tool, you can analyze and dissect program performance issues, quickly locate problems in production environments, and make optimizations or fix bugs.