For a production environment and an aspiring ops person, even millisecond level downtime is not tolerated. Proper logging and monitoring of infrastructure and applications is very helpful in solving problems, and can also help optimize costs and resources, as well as help detect some problems that may occur later. Earlier we learned to use Prometheus for monitoring alerts, but if we use Loki to collect logs can alerts be made based on the logs collected? The answer is yes, and there are two ways to do this: the metrics phase in Prometheus and Loki’s ruler component.
Applications for testing
For example, we now have an nginx application for Loki logging alerts as follows.
 1
 2
 3
 4
 5
 6
 7
 8
 9
10
11
12
13
14
15
16
17
18
19
20
21
22
23
24
25
26
27
28
29
30
31
32
33
34
|
# nginx-deploy.yaml
apiVersion: apps/v1
kind: Deployment
metadata:
  name: nginx
spec:
  selector:
    matchLabels:
      app: nginx
  template:
    metadata:
      labels:
        app: nginx
    spec:
      containers:
      - name: nginx
        image: nginx:1.7.9
        ports:
        - containerPort: 80
---
apiVersion: v1
kind: Service
metadata:
  name: nginx
  labels:
    app: nginx
spec:
  ports:
  - name: nginx
    port: 80
    protocol: TCP
  selector:
    app: nginx
  type: NodePort
|
For testing purposes, we use a NodePort type service here to expose the application. Just install it directly.
1
2
3
4
5
6
7
8
|
$ kubectl apply -f nginx-deploy.yaml
$  kubectl get pods
NAME                           READY   STATUS    RESTARTS      AGE
nginx-5d59d67564-ll9xf         1/1     Running   0             16s
$ kubectl get svc
NAME         TYPE        CLUSTER-IP     EXTERNAL-IP   PORT(S)        AGE
kubernetes   ClusterIP   10.96.0.1      <none>        443/TCP        91d
nginx        NodePort    10.99.153.32   <none>        80:31313/TCP   22s
|
We can simulate accessing the Nginx application every 10s with the following command.
1
2
3
|
$ while true; do curl --silent --output /dev/null --write-out '%{http_code}' http://192.168.0.106:31313; sleep 10; echo; done
200
200
|
The metrics phase
We mentioned earlier that in Promtail we process logs through a series of Pipelines, which includes a metrics phase to add a monitoring metric according to our needs, which is the core point of the log-based monitoring and alerting we need to implement, by structuring the logs, adding monitoring metrics, and then using Prometheus in combination with Alertmanager to complete the monitoring and alerting that we were familiar with before.
First we need to install Prometheus and Alertmanager, either manually or by using Prometheus Operator, see the chapter on monitoring and alerting, for example, here we choose to use Prometheus Operator.
We have introduced several Loki deployment methods, here we will keep the Loki cluster in microservice mode from the previous section, next we need to reconfigure Promtail, add a metrics processing phase to it and reinstall it using the values file shown below.
 1
 2
 3
 4
 5
 6
 7
 8
 9
10
11
12
13
14
15
16
17
18
19
20
21
22
23
24
25
26
|
# ci/metrics-values.yaml
rbac:
  pspEnabled: false
config:
  clients:
    - url: http://loki-loki-distributed-gateway/loki/api/v1/push
  snippets:
    pipelineStages:
    - cri: {}
    - match:
        selector: '{app="nginx"}'
        stages:
        - regex:
            expression: '.*(?P<hits>GET /.*)'
        - metrics:
            nginx_hits:
              type: Counter
              description: "Total nginx requests"
              source: hits
              config:
                action: inc
serviceMonitor:
  enabled: true
  additionalLabels:
    app: prometheus-operator
    release: prometheus
|
The most important part above is the pipelineStages configuration added to Promtail for transforming log lines, where we add a match phase that will match log stream data with app=nginx and then the next phase is to filter out log lines that contain GET keywords using regular expressions.
In the metrics metrics phase, we define a nginx_hits metric and Promtail exposes this custom metrics data through its /metrics endpoint. Here we define a Counter type metric that is incremented when matched from the regex phase.
To enable this metric in Prometheus, we enable a ServiceMonitor with promtail.serviceMonitor.enable=true. Next, we update the Loki application again, using the command shown below.
1
|
$ helm upgrade --install loki -n logging -f ci/metrics-values.yaml .
|
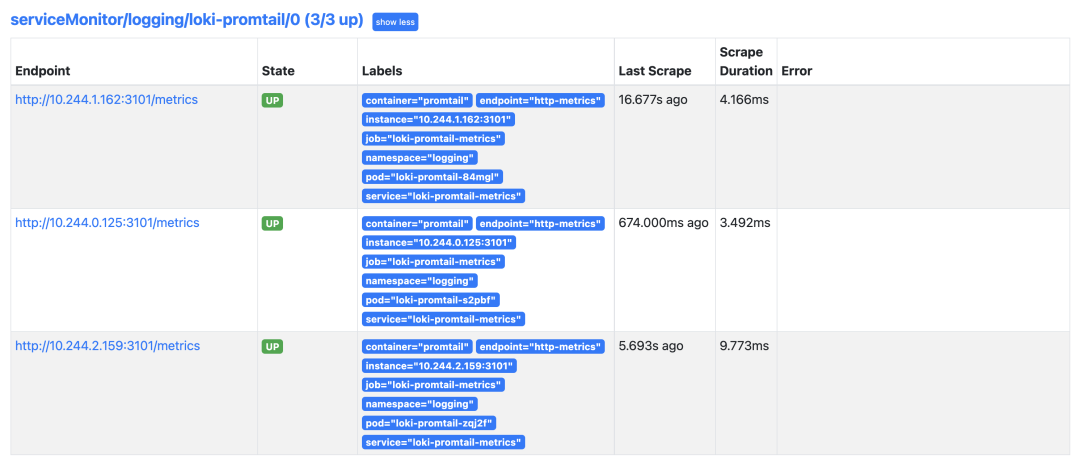
When the update is complete, a ServiceMonitor object is created to discover Promtail’s metrics data.
1
2
3
|
$ kubectl get servicemonitor -n logging
NAME            AGE
loki-promtail   10s
|
If you are using a Prometheus-Operator that cannot discover data under the logging namespace by default, you will need to create a Role permission as follows.
 1
 2
 3
 4
 5
 6
 7
 8
 9
10
11
12
13
14
15
16
17
18
19
20
21
22
23
24
25
26
27
28
29
30
31
32
33
34
35
36
37
38
39
40
41
42
43
44
45
46
47
48
49
50
51
|
apiVersion: rbac.authorization.k8s.io/v1
kind: Role
metadata:
  labels:
    app.kubernetes.io/component: prometheus
    app.kubernetes.io/name: prometheus
    app.kubernetes.io/part-of: kube-prometheus
    app.kubernetes.io/version: 2.26.0
  name: prometheus-k8s
  namespace: logging
rules:
- apiGroups:
  - ""
  resources:
  - services
  - endpoints
  - pods
  verbs:
  - get
  - list
  - watch
- apiGroups:
  - extensions
  resources:
  - ingresses
  verbs:
  - get
  - list
  - watch
- apiGroups:
  - networking.k8s.io
  resources:
  - ingresses
  verbs:
  - get
  - list
  - watch
---
apiVersion: rbac.authorization.k8s.io/v1
kind: RoleBinding
metadata:
  name: prometheus-k8s
  namespace: logging
roleRef:
  apiGroup: rbac.authorization.k8s.io
  kind: Role
  name: prometheus-k8s
subjects:
- kind: ServiceAccount
  name: prometheus-k8s
  namespace: monitoring
|
If normal, you can see Promtail’s crawl target inside Prometheus.
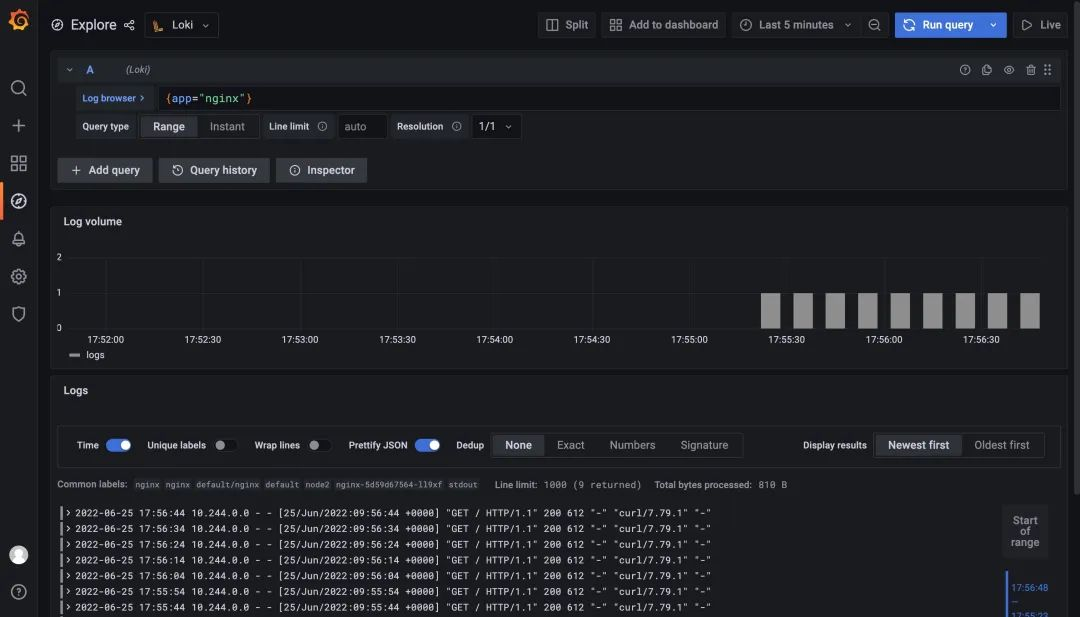
If you are using Grafana with Prometheus Operator, you need to add the Loki data source manually. We have already configured the Loki data source in Grafana in Microservice mode, and now when we access the test application, we can view the log data in Loki.
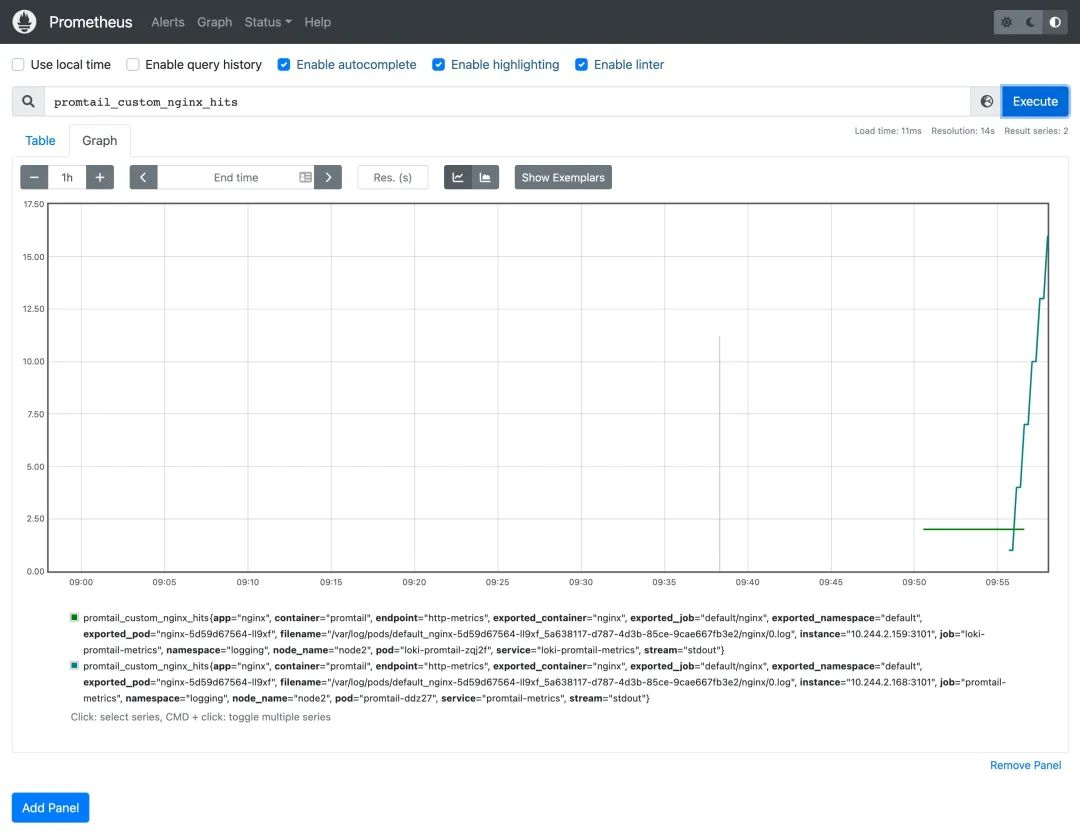
And the metrics we added to Promtail are now also available in Prometheus.
Since we now have monitoring indicators, we can create alarm rules according to our needs. We use the Prometheus Operator here, so we can just create a PrometheusRule resource object.
 1
 2
 3
 4
 5
 6
 7
 8
 9
10
11
12
13
14
15
16
17
18
19
20
21
22
|
# nginx-prometheus-rule.yaml
apiVersion: monitoring.coreos.com/v1
kind: PrometheusRule
metadata:
  labels:
    prometheus: k8s
    role: alert-rules
  name: promtail-nginx-hits
  namespace: logging
spec:
  groups:
    - name: nginx-hits
      rules:
        - alert: LokiNginxHits
          annotations:
            summary: nginx hits counter
            description: 'nginx_hits total insufficient count ({{ $value }}).'
          expr: |
                        sum(increase(promtail_custom_nginx_hits[1m])) > 2
          for: 2m
          labels:
            severity: critical
|
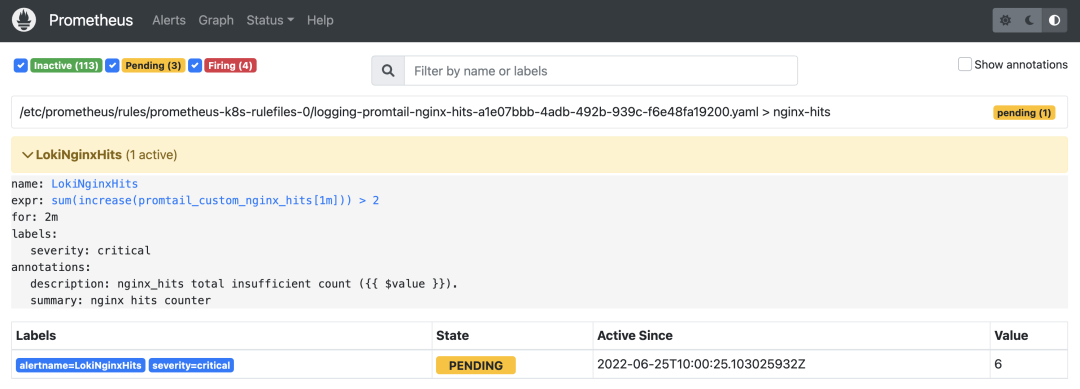
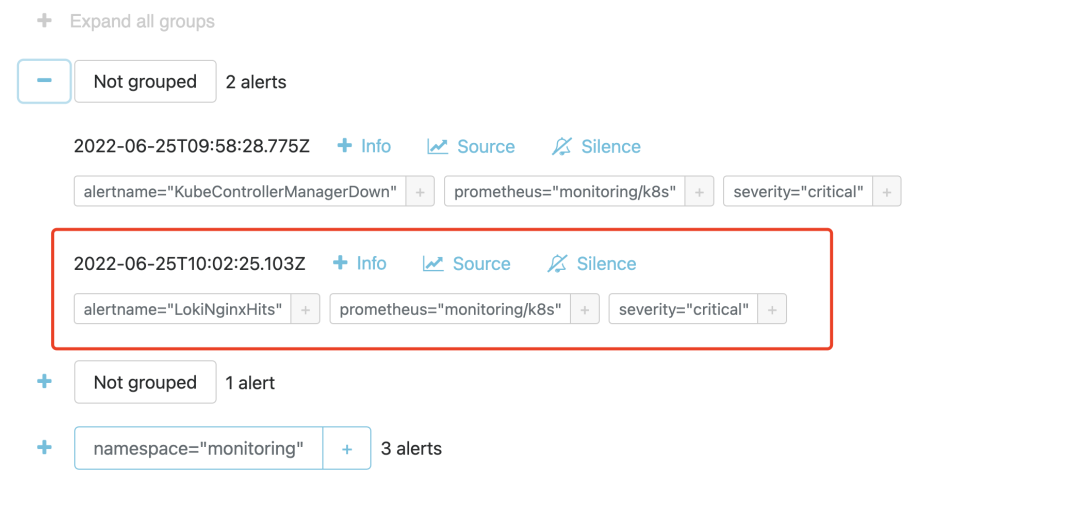
Here we configure alarm rules named nginx_hits that are executed sequentially at certain intervals in the same group. The threshold for triggering alarms is configured via the expr expression. Here we indicate whether the total number of additions within 1 minute is greater than 2. When the condition in the expor expression lasts for 2 minutes, the alarm is actually triggered, and the alarm remains in the Pending state until it is actually triggered.
Then you can configure the receiver according to the tag you want to send the alarm to, for example, through WebHook. We can also see the received alarm events in the AlertManager.
Ruler component
The above way can achieve our logging alarm function, but it is still not direct enough to be processed by Promtail, so can we achieve the alarm function directly through Loki? In fact, in Loki 2.0 version, there is a Ruler component that can continuously query a rules rule and push events that exceed the threshold to AlertManager or other Webhook services, which is Loki’s own alarm function and is compatible with AlertManager.
First we need to enable the Loki Ruler component, update the Values file of the loki-distributed installation, and add the ruler component configuration based on the previous microservice model.
 1
 2
 3
 4
 5
 6
 7
 8
 9
10
11
12
13
14
15
16
17
18
19
20
21
22
23
24
25
26
27
28
29
30
31
32
33
34
35
36
37
38
39
40
41
42
43
44
45
46
47
48
49
50
51
52
53
54
55
56
57
58
59
60
61
62
63
64
65
66
67
68
69
70
71
72
73
74
75
76
77
78
79
80
81
82
83
84
85
86
87
88
89
90
91
92
93
|
# ci/alert-values.yaml
loki:
  structuredConfig:
    ingester:
      max_transfer_retries: 0
      chunk_idle_period: 1h
      chunk_target_size: 1536000
      max_chunk_age: 1h
    storage_config: # 存储的配置,定义其他组件可能用到的存储
      aws: # s3 / s3 兼容的对象存储
        endpoint: minio.logging.svc.cluster.local:9000
        insecure: true
        bucketnames: loki-data
        access_key_id: myaccessKey
        secret_access_key: mysecretKey
        s3forcepathstyle: true
      boltdb_shipper:
        shared_store: s3
    schema_config:
      configs:
        - from: 2022-06-21
          store: boltdb-shipper # index
          object_store: s3  # chunks
          schema: v12
          index:
            prefix: loki_index_
            period: 24h
    ruler:
      storage:
        type: local
        local:
          directory: /etc/loki/rules
      ring:
        kvstore:
          store: memberlist
      rule_path: /tmp/loki/scratch
      alertmanager_url: http://alertmanager-main.monitoring.svc.cluster.local:9093
      external_url: http:/192.168.0.106:31918

distributor:
  replicas: 2

ingester: # WAL(replay)
  replicas: 2
  persistence:
    enabled: true
    size: 1Gi
    storageClass: local-path

querier:
  replicas: 2
  persistence:
    enabled: true
    size: 1Gi
    storageClass: local-path

queryFrontend:
  replicas: 2

gateway: # nginx容器 -> 路由日志写/读的请求
  nginxConfig:
    httpSnippet: |-
            client_max_body_size 100M;
    serverSnippet: |-
            client_max_body_size 100M;

# Configuration for the ruler
ruler:
  enabled: true
  kind: Deployment
  replicas: 1
  persistence:
    enabled: true
    size: 1Gi
    storageClass: local-path
  # -- Directories containing rules files
  directories:
    tenant_no:
      rules1.txt: |
        groups:
          - name: nginx-rate
            rules:
            - alert: LokiNginxRate
              expr: sum(rate({app="nginx"} |= "error" [1m])) by (job)
                    /
                  sum(rate({app="nginx"}[1m])) by (job)
                    > 0.01
              for: 1m
              labels:
                severity: critical
              annotations:
                summary: loki nginx rate
                description: high request latency
|
We first configure the Ruler component with loki.structuredConfig.ruler, such as specifying the address of the Alertmanager, how the rules are stored, etc. Then we configure the information about the component and the alarm rules with the ruler property, and re-install Loki using the values file above.
 1
 2
 3
 4
 5
 6
 7
 8
 9
10
11
12
13
14
15
16
17
18
|
$ helm upgrade --install loki -n logging -f ci/alert-values.yaml .
$ kubectl get pods -n logging
NAME                                                   READY   STATUS    RESTARTS      AGE
grafana-55d8779dc6-gkgpf                               1/1     Running   2 (66m ago)   3d21h
loki-loki-distributed-distributor-56959cc548-xpv6d     1/1     Running   0             3m36s
loki-loki-distributed-distributor-56959cc548-zjfsb     1/1     Running   0             2m52s
loki-loki-distributed-gateway-6f4cfd898c-p9xxf         1/1     Running   0             21m
loki-loki-distributed-ingester-0                       1/1     Running   0             2m32s
loki-loki-distributed-ingester-1                       1/1     Running   0             3m34s
loki-loki-distributed-querier-0                        1/1     Running   0             2m48s
loki-loki-distributed-querier-1                        1/1     Running   0             3m29s
loki-loki-distributed-query-frontend-5bcc7949d-brzg6   1/1     Running   0             3m30s
loki-loki-distributed-query-frontend-5bcc7949d-g2wwd   1/1     Running   0             3m35s
loki-loki-distributed-ruler-5d4b8cd889-m2vbd           1/1     Running   0             3m35s
minio-548656f786-mjd4c                                 1/1     Running   2 (66m ago)   3d21h
promtail-ddz27                                         1/1     Running   0             19m
promtail-lzr6v                                         1/1     Running   0             20m
promtail-nldqx
|
The rules and structure of Loki rulers are fully compatible with Prometheus, the only difference is in the query statement (LogQL), in Loki we use LogQL to query logs, a typical rules configuration file is shown below.
 1
 2
 3
 4
 5
 6
 7
 8
 9
10
11
12
13
14
15
16
|
groups:
  # 组名称
  - name: xxxx
    rules:
      # Alert名称
      - alert: xxxx
        # logQL查询语句
        expr: xxxx
        # 产生告警的持续时间 pending.
        [ for:  | default = 0s ]
        # 自定义告警事件的label
        labels:
        [ :  ]
        # 告警时间的注释
        annotations:
        [ :  ]
|
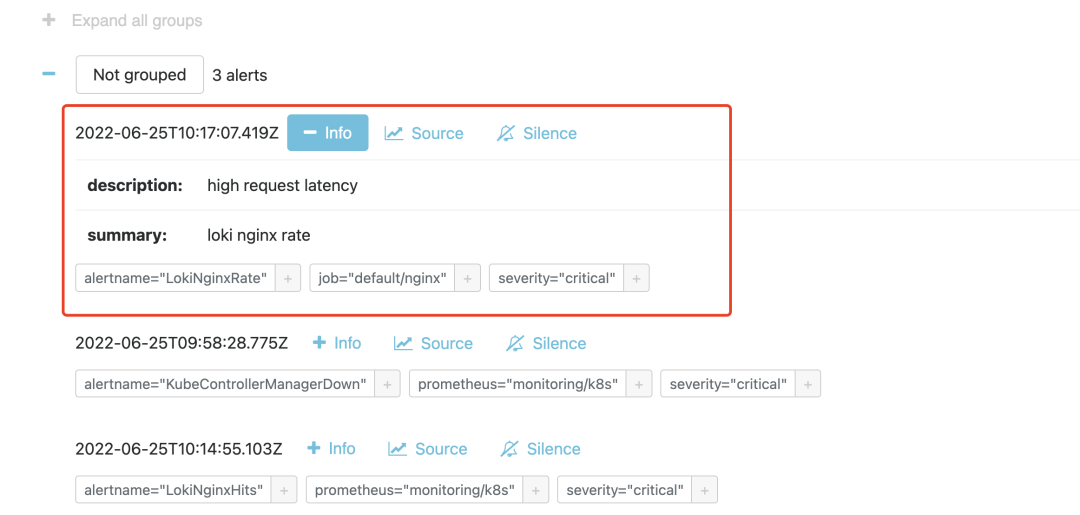
For example, the rule we configured here sum(rate({app="nginx"} |= "error" [1m])) by (job) / sum(rate({app="nginx"}[1m])) by (job) > 0.01 means that an alarm will be triggered if the error rate in the nginx log is greater than 1%, again Re-use the values file above to update Loki.

After the update is complete we look at the log of the Ruler component to see some information about the alarm rules we configured above.
1
2
3
4
5
|
$ kubectl logs -f loki-loki-distributed-ruler-5d4b8cd889-m2vbd -n logging
......
level=info ts=2022-06-25T10:10:07.445554993Z caller=metrics.go:122 component=ruler org_id=tenant_no latency=fast query="((sum by(job)(rate({app=\"nginx\"} |= \"error\"[1m])) / sum by(job)(rate({app=\"nginx\"}[1m]))) > 0.01)" query_type=metric range_type=instant length=0s step=0s duration=25.306079ms status=200 limit=0 returned_lines=0 throughput=0B total_bytes=0B queue_time=0s subqueries=1
level=info ts=2022-06-25T10:11:03.196836972Z caller=pool.go:171 msg="removing stale client" addr=10.244.2.165:9095
level=info ts=2022-06-25T10:11:07.423644116Z caller=metrics.go:122 component=ruler org_id=tenant_no latency=fast query="((sum by(job)(rate({app=\"nginx\"} |= \"error\"[1m])) / sum by(job)(rate({app=\"nginx\"}[1m]))) > 0.01)" query_type=metric range_type=instant length=0s step=0s duration=3.234499ms status=200 limit=0 returned_lines=0 throughput=0B total_bytes=0B queue_time=0s subqueries=1
|
If the threshold is exceeded within 1m, the alarm rule will be triggered, and we can see the corresponding alarm message in Alertmanager after the trigger.
Here we are done with monitoring alerts using Loki based on logs.