Inspired by PromQL, Loki also has its own query language, called LogQL, which is like a distributed grep that aggregates views of logs. Like PromQL, LogQL is filtered using tags and operators, and has two main types of query functions.
- Query to return log line contents
- Calculating relevant metrics in the log stream by filtering rules
Log queries
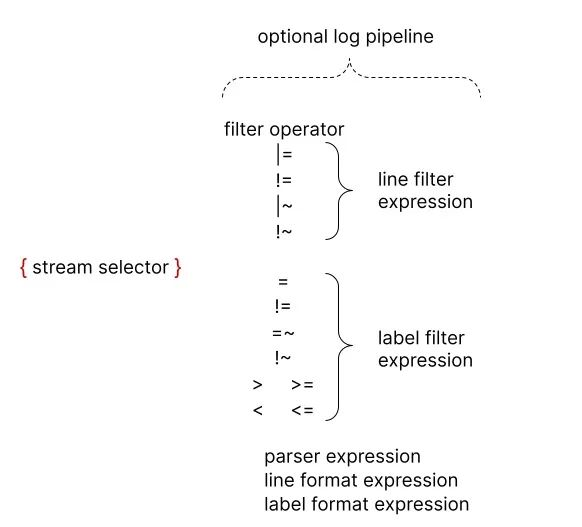
A basic log query consists of two parts.
log stream selectorlog pipeline
Due to the design of Loki, all LogQL queries must contain a Log Stream selector. A Log Stream represents log entries that have the same metadata (set of Labels).
A Log Stream Selector determines how many logs will be searched for. A more granular Log Stream Selector reduces the number of streams searched to a manageable number, which can significantly reduce resource consumption during queries by finely matching log streams.
The log stream selector is optionally followed by a log pipeline for further processing and filtering of log stream information, which consists of a set of expressions, each of which performs relevant filtering for each log line in left-to-right order, each of which can filter, parse and change the log line content and its respective label.
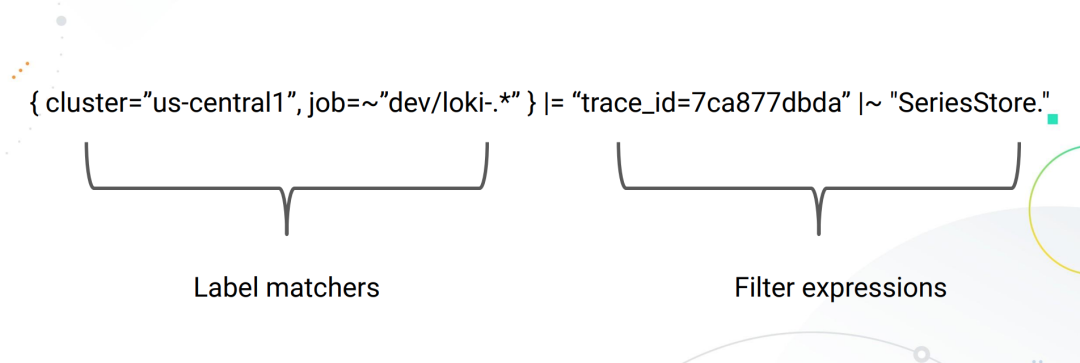
The following example shows the operation of a complete log query.
|
|
The query statement consists of the following parts.
- a log stream selector
{container="query-frontend",namespace="logi-dev"}that filters logs from thequery-frontendcontainer under theloki-devnamespace - then followed by a log pipeline
|= "metrics.go" | logfmt | duration > 10s and throughput_mb < 500that will filter out logs containing the wordmetrics.go, then parse each line to extract more expressions and filter
To avoid escaping the featured character, you can use single quotes instead of double quotes when quoting a string, for example
\w+1is the same as “\w+”.
Log Stream Selector
The log stream selector determines which log streams should be included in your query results. The selector consists of one or more key-value pairs, where each key is a log tag and each value is the value of that tag.
Log stream selectors are written by wrapping key-value pairs in a pair of curly brackets, e.g.
|
|
The above example means that all log streams with the tag app and the value mysql and the tag name and the value mysql-backup will be included in the query results.
The = operator after the tag name is a tag matching operator, and there are several tag matching operators supported in LogQL.
=: exact match! =: unequal=~: regular expression matching! ~: regular expression does not match
For example.
{name=~"mysql.+"}{name!~"mysql.+"}{name!~"mysql-\\d+"}
The same rules that apply to the Prometheus tag selector also apply to the Loki log stream selector.
Log Pipeline
A log pipeline can be attached to a log stream selector to further process and filter log streams. It typically consists of one or more expressions, each executed in turn for each log line. If a log line is filtered out by an expression, the pipeline will stop there and start processing the next line. Some expressions can change the log content and their respective labels, which can then be used to further filter and process subsequent expressions or metrics queries.
A log pipeline can consist of the following parts.
- Log line filtering expressions
- Parser expressions
- Tag filtering expressions
- Log line formatting expressions
- Tag formatting expressions
- Unwrap expression
where unwrap expression is a special expression that can only be used in metric queries.
Log line filtering expressions
Log line filtering expressions are used to perform a distributed grep on aggregated logs in a matching log stream.
After writing in the log stream selector, the resulting log data set can be further filtered using a search expression, which can be text or a regular expression, e.g.
{job="mysql"} |= "error"{name="kafka"} |~ "tsdb-ops.*io:2003"{name="cassandra"} |~ "error=\\w+"{instance=~"kafka-[23]",name="kafka"} ! = "kafka.server:type=ReplicaManager"
The |=, |~ and ! = are filter operators that support the following.
|=: the string contained in the log line! =: strings not included in the log line|~: log line matching regular expressions! ~: log line does not match a regular expression
The filter operators can be chained and will filter expressions in order, and the resulting log lines must satisfy each filter. When using |~ and ! ~, regular expressions with Golang’s RE2 syntax can be used. By default, the matching is case-sensitive and can be switched to be case-insensitive by prefixing the regular expression with (?i).
While log line filter expressions can be placed anywhere in the pipeline, it is best to place them at the beginning to improve the performance of the query and only do further follow-up when a line matches. For example, while the results are the same, the following query {job="mysql"} |= "error" |json | line_format "{{.err}}" will be faster than {job="mysql"} | json | line_format "{{.message}}" |= "error", Log line filter expressions are the fastest way to filter logs after log stream selectors .
Parser expressions
Parser expressions parse and extract tags from log content, and these extracted tags can be used in tag filtering expressions for filtering, or for metric aggregation.
The extracted tag keys are automatically formatted by the parser to follow the Prometheus metric name conventions (they can only contain ASCII letters and numbers, as well as underscores and colons, and cannot start with a number).
For example, the following log passing through the pipeline | json will produce the following Map data.
|
|
->
|
|
In the case of an error, for example, if the line is not in the expected format, the log line will not be filtered but a new __error__ tag will be added.
Note that if an extracted tag key name already exists in the original log stream, then the extracted tag key will be suffixed with _extracted to distinguish between the two tags. You can use a tag formatting expression to force an override of the original tag, but if an extracted key appears twice, then only the latest tag value will be retained.
The parsers json, logfmt, pattern, regexp and unpack are currently supported.
We should use predefined parsers like json and logfmt whenever possible, it will be easier, and when the log line structure is unusual, you can use regexp, which allows you to use multiple parsers in the same log pipeline, which is useful when you are parsing complex logs.
JSON
The json parser operates in two modes.
- If the log line is a valid json document, adding
| jsonto your pipeline will extract all json attributes as labels, and nested attributes will be tiled into the label key using the_separator.
Note: Arrays will be ignored.
For example, use the json parser to extract the tags from the contents of the following files.
|
|
A list of tags can be obtained as shown below.
- Using
|json label="expression", another="expression"in your pipeline will extract only the specified json field as a label, you can specify one or more expressions in this way, same aslabel_format, all expressions must be quoted.
Only field access (my.field, my["field"]) and array access (list[0]) are currently supported, as well as combinations of these in any level of nesting (my.list[0]["field"]).
For example, |json first_server="servers[0]", ua="request.headers[\"User-Agent\"] will extract tags from the following log files.
|
|
The list of extracted tags is.
If the expression returns an array or object, it will be assigned to the tag in json format. For example, |json server_list="services", headers="request.headers will extract to the following tags.
logfmt
The logfmt parser can be added by using | logfmt, which will advance all the keys and values from the logfmt formatted log lines.
For example, the following log line data.
|
|
The labels will be extracted as shown below.
regexp
Unlike logfmt and json (which extract all values implicitly and without arguments), the regexp parser takes a single argument | regexp "<re>" in the form of a regular expression using Golang RE2 syntax.
The regular expression must contain at least one named submatch (e.g. (?P<name>re)), with each submatch extracting a different tag.
For example, the parser | regexp "(?P<method>\\w+) (?P<path>[\\w|/]+) \\((?P<status>\\\d+?) \\\) (?P<duration>. *)" will extract tags from the following lines.
|
|
The extracted tags are.
pattern
The pattern parser allows fields to be extracted explicitly from log lines by defining a pattern expression (| pattern "<pattern-expression>") that matches the structure of the log line.
For example, let’s consider the following NGINX log line data.
|
|
The log line can be parsed with the following expression.
|
|
After parsing, these attributes can be extracted as follows.
The capture of a pattern expression is a field name separated by the < and > characters, for example <example> defines the field name as example, unnamed capture is displayed as <_>, and unnamed capture skips the match. By default, the pattern expression is anchored at the beginning of the log line, and you can use <_> at the beginning of the expression to anchor the expression at the beginning.
For example, let’s look at the following log line data.
|
|
If we wish to match only the contents of msg=", we can use the following expression to do so.
|
|
We don’t need most of the preceding log data, we just need to use <_> for placeholders, which is obviously much simpler than regular expressions.
unpack
The unpack parser will parse the json log lines and unpack all embedded tags through the packing phase, a special attribute _entry will also be used to replace the original log lines.
For example, using the | unpack parser, you can get tags as follows.
Allows extracting container and pod tags and raw log messages as new log lines.
If the original embedded log lines are in a specific format, you can use unpack in combination with a json parser (or other parser).
Tag filtering expressions
A tag filter expression allows to filter log lines using their original and extracted tags, and it can contain multiple predicates.
A predicate contains a tag identifier, operator and a value for comparing tags.
For example cluster="namespace" where cluster is the tag identifier, the operator is = and the value is "namespace".
LogQL supports a variety of value types that are automatically inferred from the query input.
String (string)is caused by double quotes or backquotes, such as"200"orus-central1.Duration (time)is a string of decimal numbers, each with an optional number and unit suffix, such as"300ms","1.5h"or"2h45m", and valid time units are"ns","us"(or"µs"),"ms","s","m","h".Numberis a floating point number (64 bits), e.g. 250, 89.923.Bytesis a string of decimal numbers, each with an optional number and unit suffix, such as"42MB","1.5Kib"or"20b", and valid byte units are"b","kib","kb","mib","mb","gib","gb","tib ","tb","pib","bb","eb".
The string type works exactly the same way as the Prometheus tag matcher is used in the log stream selector, which means you can use the same operators (=, ! =, =~, ! ~).
Using Duration, Number and Bytes will convert the tag values before comparing and supports the following comparators.
==or=equal comparison! =not equal comparison>and>=for greater-than or greater-than-equal comparisons<and<=for less-than or less-than-equal comparisons
For example, logfmt | duration > 1m and bytes_consumed > 20MB filters the expression.
If the conversion of the tag value fails, the log line is not filtered and a __error__ tag is added. You can use and and or to concatenate multiple predicates that represent and and or binary operations, respectively. and can be represented by commas, spaces, or other pipes, and tag filters can be placed anywhere in the log pipeline.
All of the following expressions are equivalent:
By default, multiple predicates are prioritized from right to left. You can wrap predicates in parentheses to force a different priority from left to right.
For example, the following is equivalent.
It will first evaluate duration>=20ms or method="GET" , to first evaluate method="GET" and size<=20KB , make sure to use the appropriate brackets as shown below.
|
|
Log line formatting expressions
Log line formatting expressions can be used to rewrite the contents of log lines by using Golang’s text/template template format, which takes a string parameter | line_format "{{.label_name}}" as the template format, and all labels are variables injected into the template and can be used with the {.label_name }} notation to be used.
For example, the following expression.
|
|
The log lines will be extracted and rewritten to contain only query and the requested duration. You can use double-quoted strings or backquotes {{.label_name}} for templates to avoid escaping special characters.
Also line_format supports mathematical functions, e.g.
If we have the following labels ip=1.1.1.1, status=200 and duration=3000(ms), we can divide duration by 1000 to get the value in seconds.
The above query will result in a log line of 1.1.1.1 200 3.
Label format expressions
The | label_format expression can rename, modify or add labels. It takes a comma-separated list of operations as arguments, and can perform multiple operations at once.
When both sides are label identifiers, for example dst=src, the operation will rename the src label to dst.
The left side can also be a template string, e.g. dst="{{.status}} {{.query}}", in which case the dst tag value will be replaced by the Golang template execution result, which is the same template engine as the | line_format expression, which means that the tag can be used as a variable, or the same function list.
In both cases above, if the target tag does not exist, then a new tag will be created.
The renamed form dst=src will remove the src tag after remapping it to the dst tag, however, the template form will retain the referenced tag, for example dst="{{.src}}" results in both dst and src having the same value.
A label name can only appear once in each expression, which means that
| label_format foo=bar,foo="new"is not allowed, but you can use two expressions to achieve the desired effect, such as| label_format foo=bar | label_format foo="new".
Logging Metrics
LogQL also supports metrics for log streams as a function, typically we can use it to calculate the error rate of messages or to sort the application log output Top N over time.
Interval vectors
LogQL also supports a limited number of interval vector metric statements, similar to PromQL, with the following 4 functions.
rate: counts log entries per secondcount_over_time: counts the entries of each log stream within the specified rangebytes_rate: calculates the number of bytes per second for a log streambytes_over_time: the number of bytes used for each log stream in the specified range
For example, to calculate the qps of nginx.
|
|
Calculate the number of times the kernel has experienced oom in the last 5 minutes.
|
|
Aggregation Functions
LogQL also supports aggregation, which can be used to aggregate the elements within a single vector to produce a new vector with fewer elements.
sum: summationmin: minimum valuemax: maximum valueavg: average valuestddev: standard deviationstdvar: standard variancecount: countbottomk: the smallest k elementstopk: the largest k elements
The aggregation function we can describe with the following expression.
|
|
For grouping tags, we can use without or by to distinguish them. For example, to calculate the qps of nginx and group it by pod.
|
|
Only when using the bottomk and topk functions, we can enter the relevant arguments to the functions. For example, to calculate the top 5 qps for nginx and group them by pod.
|
|
Binary operations
mathematical calculations
Loki stores logs, they are all text, how do you calculate them? Obviously the mathematical operations in LogQL are oriented towards interval vector operations, and the supported binary operators in LogQL are as follows
+: addition-: subtraction*: multiplication/: division%: modulo^: find the power
For example, if we want to find the error rate inside a certain business log, we can calculate it as follows.
|
|
Logical operations
Set operations are only valid in the interval vector range, and currently support
and: andor: orunless: exclude
For example.
|
|
Comparison Operators
LogQL supports the same comparison operators as PromQL, including
==: equal to! =: not equal>: greater than>=: greater than or equal to<: less than<=: less than or equal to
Usually we do a comparison of thresholds after using interval vector calculations, which is useful for alerting, e.g. to count error level log entries greater than 10 within 5 minutes.
|
|
We can also express this through a Boolean calculation, such as a statistic of error level log entries greater than 10 within 5 minutes is true. The opposite is false.
|
|
Comments
LogQL queries can be annotated with the # character, e.g.
|
|
For multi-row LogQL queries, you can use # to exclude whole or partial rows.
Query Example
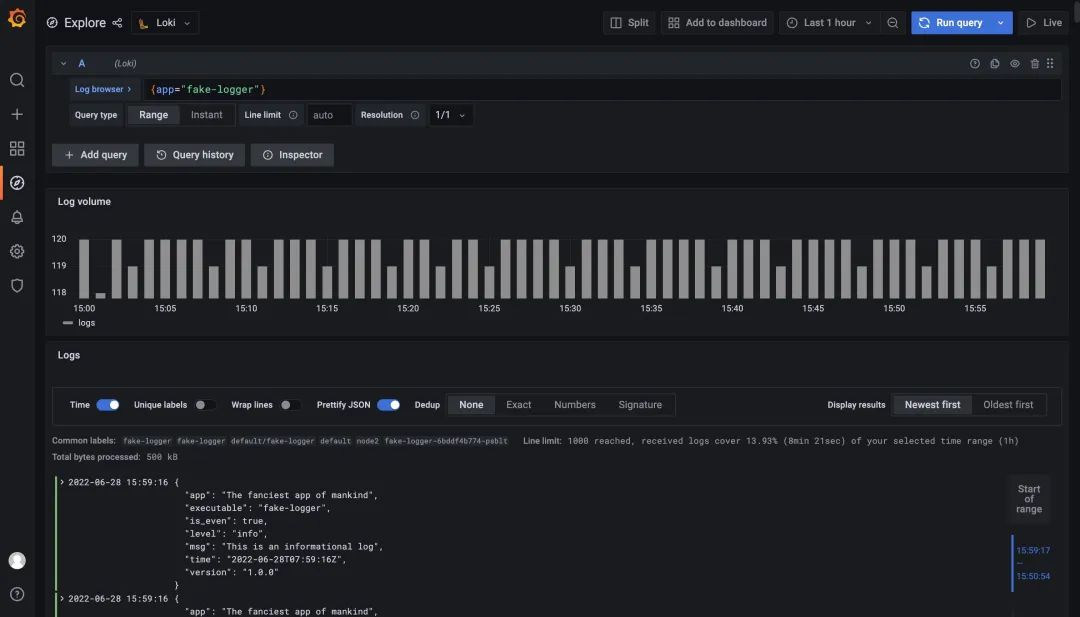
Here we deploy a sample application that is a fake logger with debug, info and warning logs output to stdout. error level logs will be written to stderr and the actual log messages are generated in JSON format and a new log message will be created every 500 milliseconds. The log message format is shown below.
Use the following command to create the sample application.
|
|
We can use {app="fake-logger"} to query the application’s log stream data in Grafana.
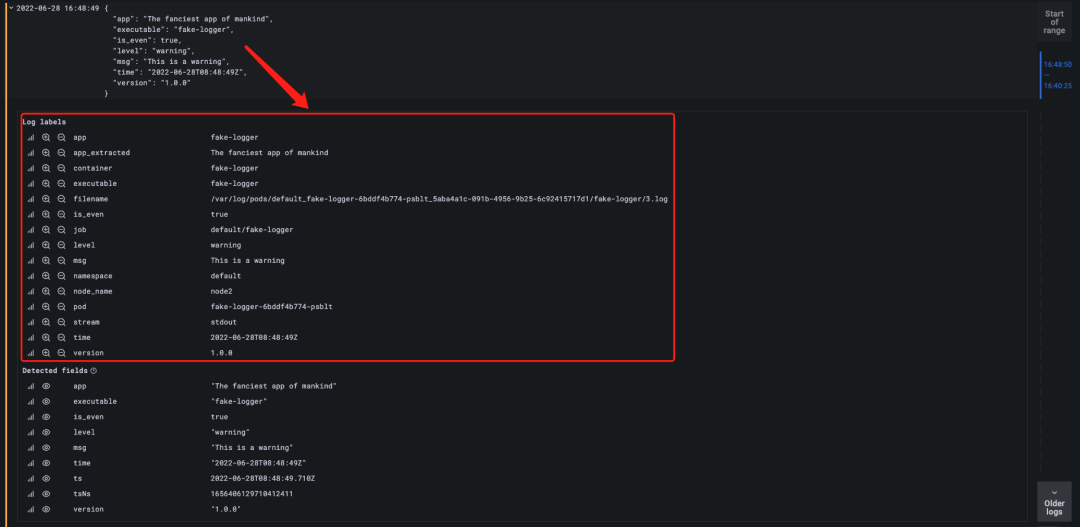
Since the logs of our sample application are in JSON form, we can use a JSON parser to parse the logs with the expression {app="fake-logger"} | json, as shown below.
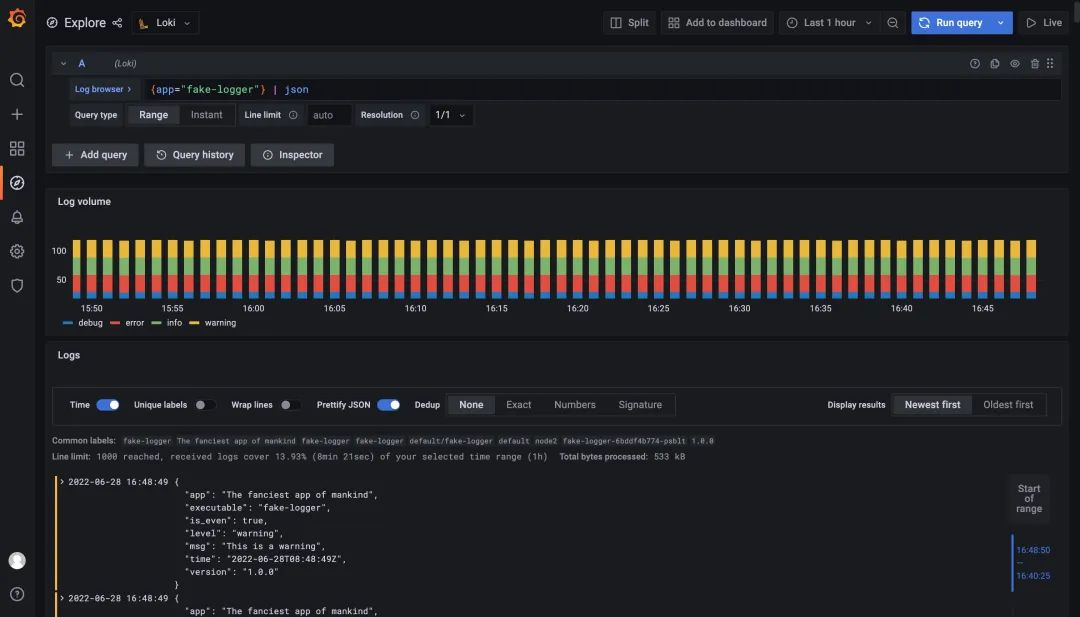
After parsing the log using the JSON parser, you can see that the Grafana-provided panel is differentiated using different colors depending on the value of level, and that the attributes of our log are now added to the Log tab.
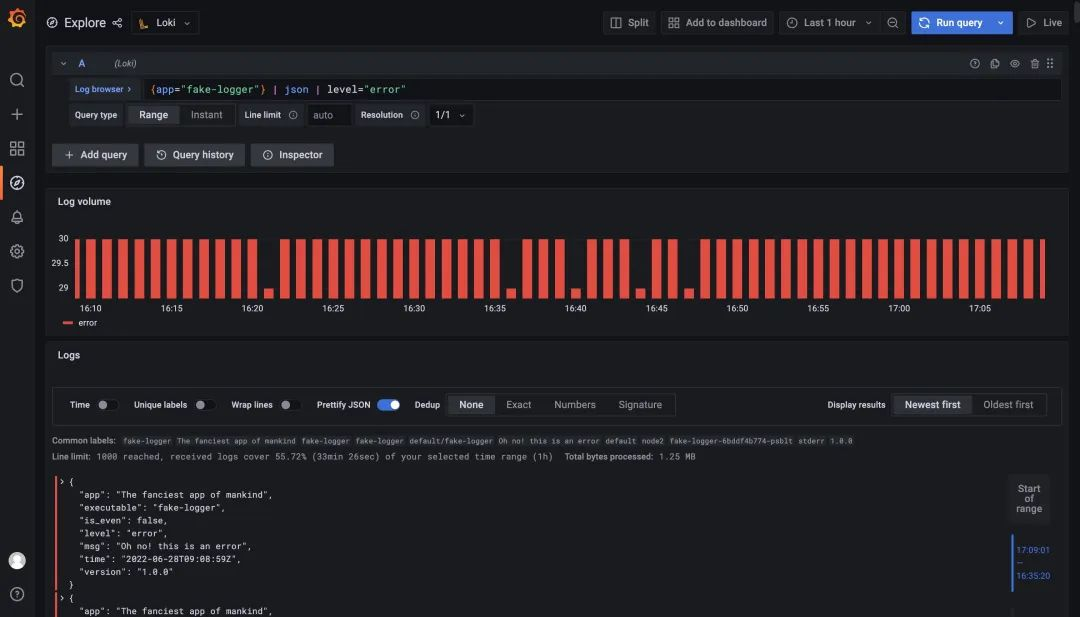
Now that the data in JSON is turned into log tags we can naturally use these tags to filter log data. For example, if we want to filter logs with level=error, we just use the expression {app="fake-logger"} | json | level="error" to do so.
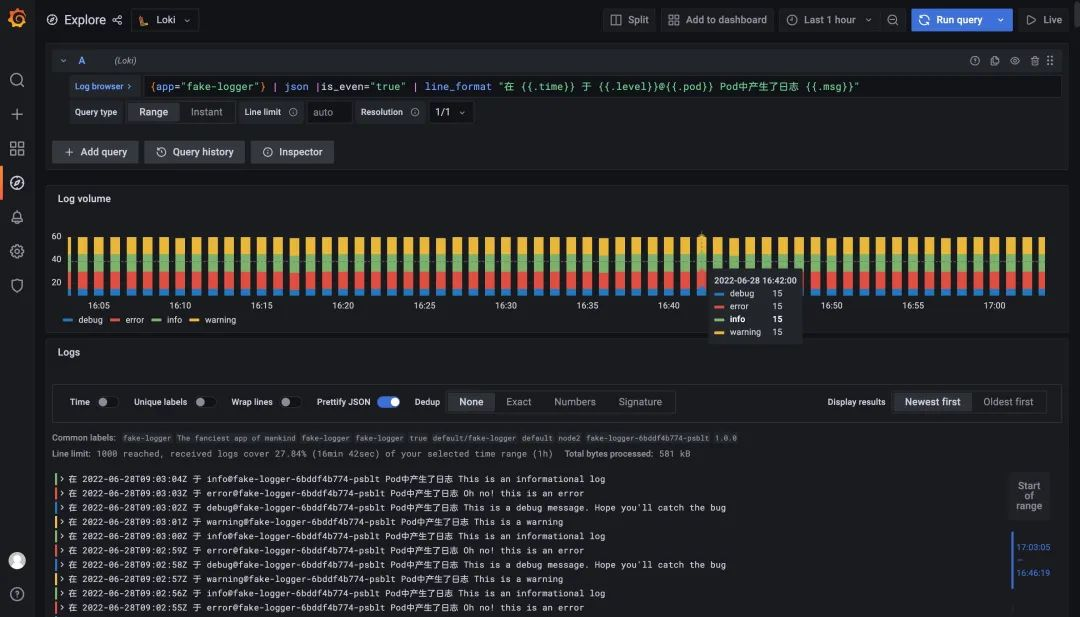
In addition, we can format the output logs according to our needs using line_format, for example, we use the query statement {app="fake-logger"} | json |is_even="true" | line_format "logs generated in {{.time}} on {{.level}}@ {{.pod}} Pod generated log {{.msg}}" to format the log output.
Monitoring Panel
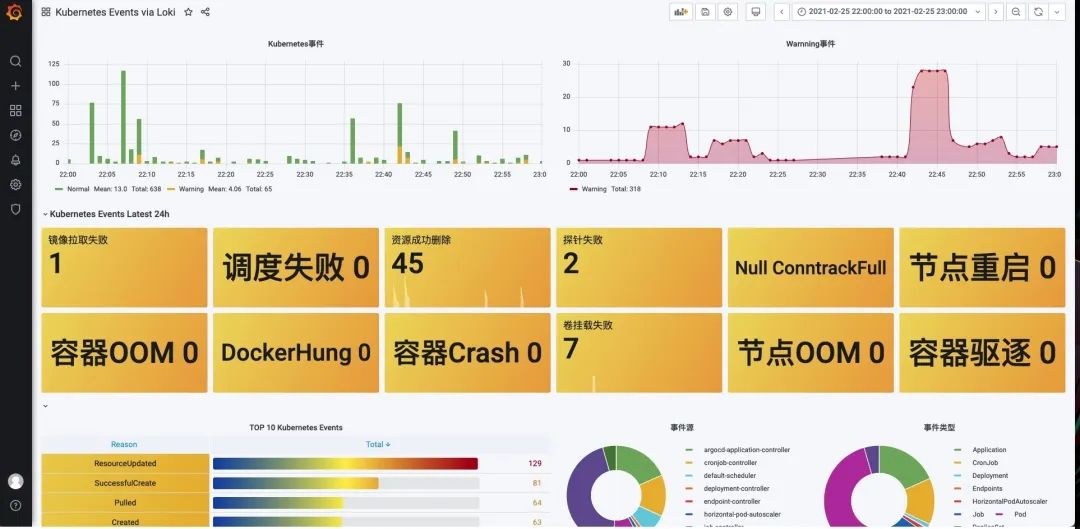
Here we illustrate monitoring Kubernetes events as an example. First you need to install [kubernetes-event-exporter] at https://github.com/opsgenie/kubernetes-event-exporter/tree/master/deploy and the kubernetes-event- exporter logs will be printed to stdout, and then our promtail will upload the logs to Loki.
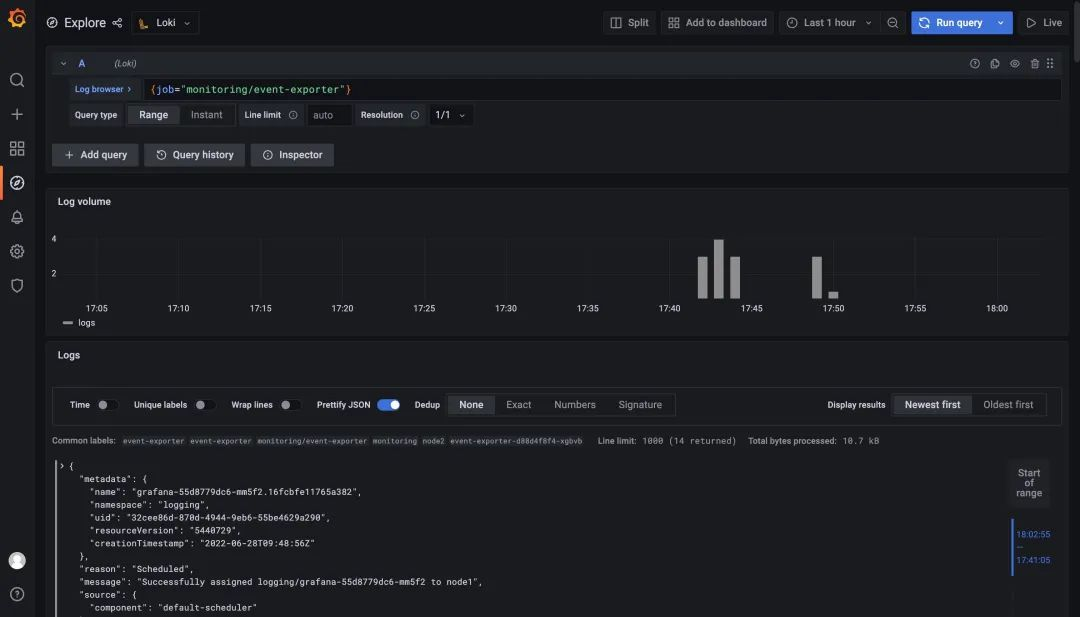
Then import the Dashboard at https://grafana.com/grafana/dashboards/14003, but be careful to change the filter tag in each chart to job="monitoring/event-exporter".
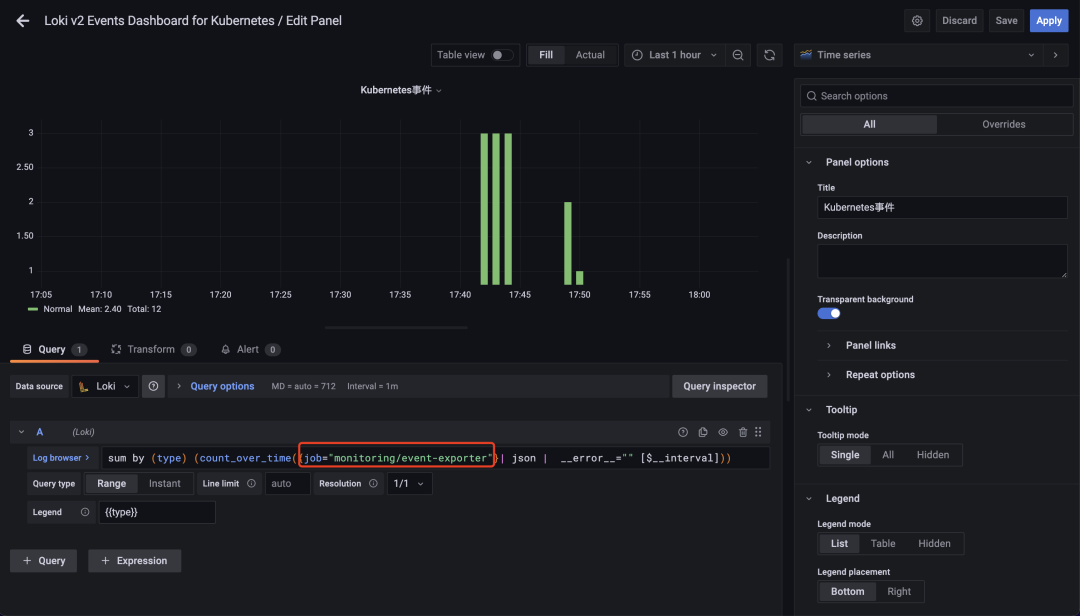
After the modification, you can normally see the relevant event information in the cluster in Dashboard, but it is recommended to replace the query statement in the panel with a record rule.
Recommendations
-
try to use static labels, the overhead is smaller, usually logs are injected into labels before they are sent to Loki, the recommended static labels contain
- Host: kubernetes/hosts
- Application name: kubernetes/labels/app_kubernetes_io/name
- component name: kubernetes/labels/name
- Namespace: kubernetes/namespace
- Other static tags, such as environment, version, etc.
-
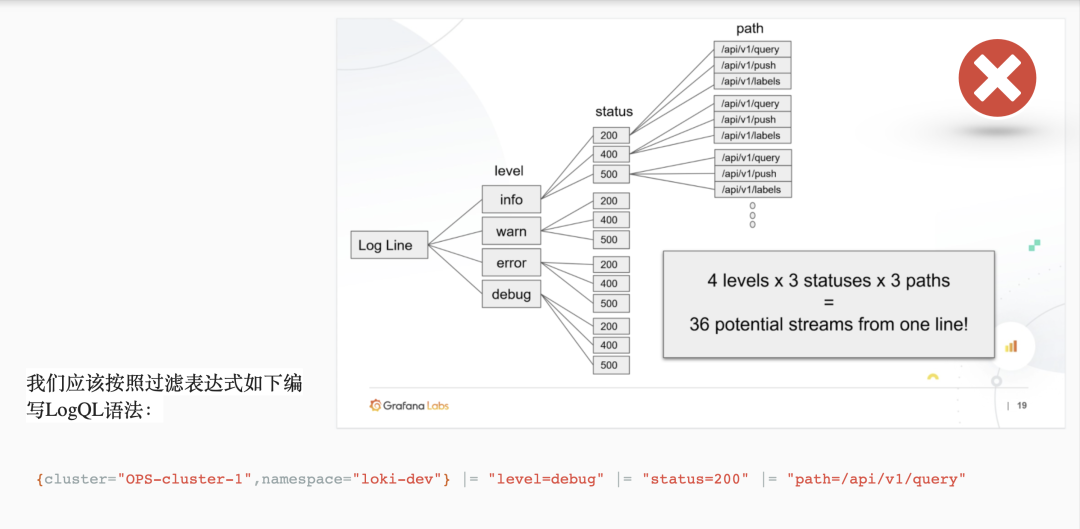
Use dynamic tags with caution. Too many tag combinations can create a lot of streams, and it can make Loki store a lot of indexes and small chunks of object files. These can significantly consume Loki’s query performance. To avoid these problems, don’t add labels until you know you need them. Loki’s strength lies in parallel querying, using filter expressions (label=“text”, |~ “regex”, …) to query the logs will be more efficient and fast.
-
bounded range of tag values, as Loki users or operators our goal should be to use as few tags as possible to store your logs. This means that fewer tags lead to smaller indexes, which leads to better performance, so we should always think twice before adding tags.
-
configure caching, Loki can configure caching for multiple components, either redis or memcached, which can significantly improve performance.
-
use LogQL syntax wisely to dramatically improve query efficiency. label matchers (label matchers) are your first line of defense and are the best way to dramatically reduce the number of logs you search (for example, from 100TB to 1TB). Of course, this means you need to have good label definition specifications on the log collection side.