Linux often needs to check the system resources or hardware resources, and there are many command lines corresponding to it.
In this article, we will summarize and list the common query methods based on our experience for reference.
The following commands use Ubuntu 1804 and CentOS7 as the test platform.
1. System resources
1.1. Linux distributions and kernels
The uname -r command outputs the distribution and kernel information. Most distributions basically come with this command, but the output may not contain the full name of the distribution.
CentOS7
1
2
|
[chancel@localhost ~]$ uname -a
Linux localhost.localdomain 3.10.0-1160.62.1.el7.x86_64 #1 SMP Tue Apr 5 16:57:59 UTC 2022 x86_64 x86_64 x86_64 GNU/Linux
|
Ubuntu1804
1
2
|
➜  ~ uname -a
Linux ubuntu1804 4.15.0-189-generic #200-Ubuntu SMP Wed Jun 22 19:53:37 UTC 2022 x86_64 x86_64 x86_64 GNU/Linux
|
The cat /proc/version command outputs the kernel version and the compiled gcc version.
CentOS7
1
2
|
[chancel@localhost ~]$ cat /proc/version
Linux version 3.10.0-1160.62.1.el7.x86_64 (mockbuild@kbuilder.bsys.centos.org) (gcc version 4.8.5 20150623 (Red Hat 4.8.5-44) (GCC) ) #1 SMP Tue Apr 5 16:57:59 UTC 2022
|
Ubuntu1804
1
2
|
➜  ~ cat /proc/version
Linux version 4.15.0-189-generic (buildd@lcy02-amd64-039) (gcc version 7.5.0 (Ubuntu 7.5.0-3ubuntu1~18.04)) #200-Ubuntu SMP Wed Jun 22 19:53:37 UTC 2022
|
The lsb_release -a command outputs release information, but Cent7OS does not include this command.
1
2
3
4
5
6
|
➜  ~ lsb_release -a
No LSB modules are available.
Distributor ID: Ubuntu
Description:    Ubuntu 18.04.6 LTS
Release:        18.04
Codename:       bionic
|
The cat /etc/redhat-release command is unique to the Redhat family.
1
2
|
[chancel@localhost ~]$ cat /etc/redhat-release
CentOS Linux release 7.9.2009 (Core)
|
The cat /etc/*release command is available in most Linux distributions and is the most convenient command to use.
CentOS7
 1
 2
 3
 4
 5
 6
 7
 8
 9
10
11
|
[chancel@localhost ~]$ cat /etc/*release
CentOS Linux release 7.9.2009 (Core)
NAME="CentOS Linux"
VERSION="7 (Core)"
ID="centos"
ID_LIKE="rhel fedora"
VERSION_ID="7"
PRETTY_NAME="CentOS Linux 7 (Core)"
...
CentOS Linux release 7.9.2009 (Core)
CentOS Linux release 7.9.2009 (Core)
|
1.2. CPU/Memory Usage Checking
The top command is the most common command used to check CPU usage, and is used as follows.
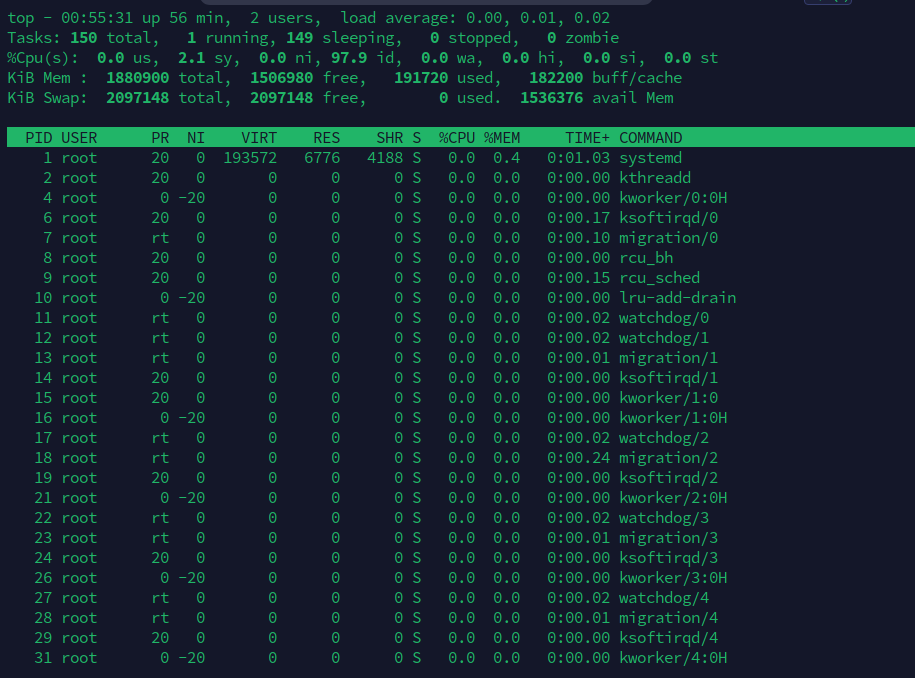
In this case, press P to sort by CPU usage, press M to sort by memory usage, press I to hide all idle processes, and press S to sort by runtime.
The htop command is a more concise display program than top. On some distributions, you need to install it yourself, and it works as follows.
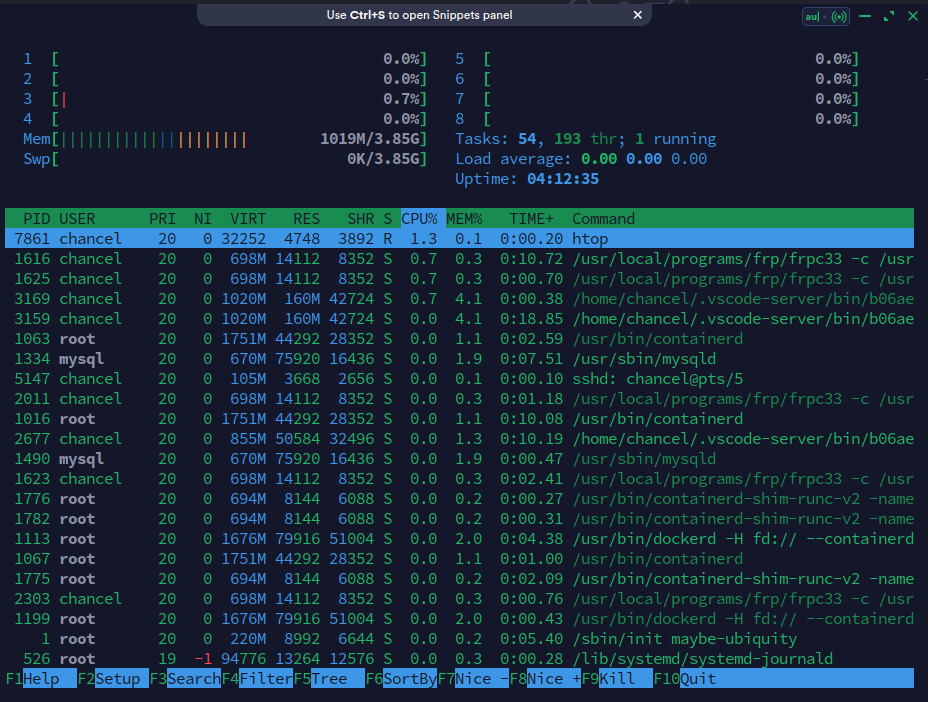
Compared with the use of top, the interface of htop is clearer and easier to understand, and there are hints on how to use it, which is more user-friendly.
Usually, htop needs to be installed by yourself.
1
2
3
4
5
|
# Ubuntu
sudo apt install htop

# Cent
sudo yum install htop
|
glances is a resource viewer that goes a step further than htop.
Not only does it include the usual CPU and memory, but it even includes the current internet speed and hardware temperature data, which can be used as follows.
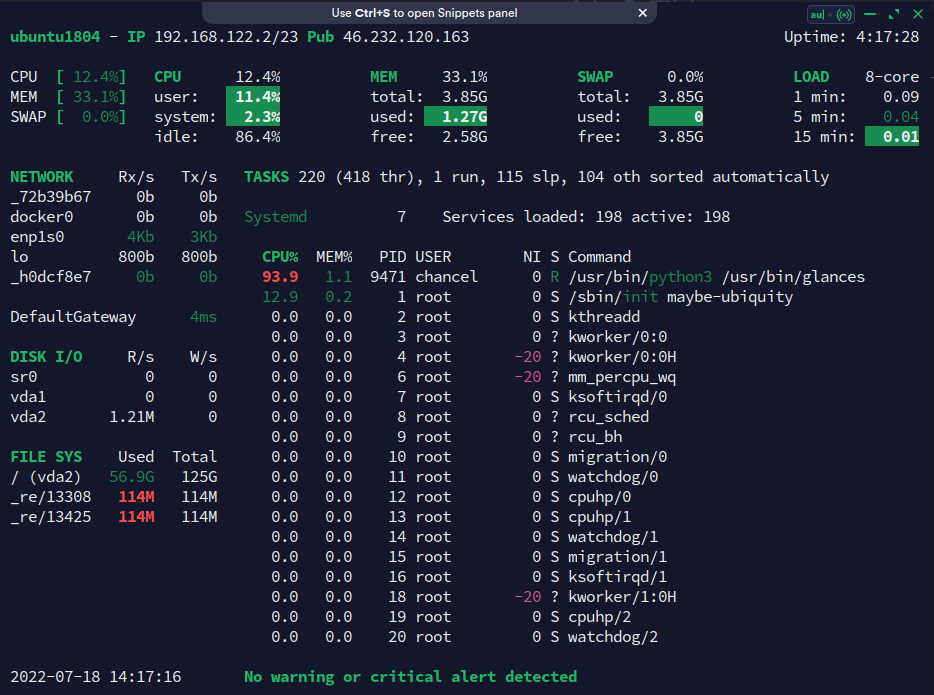
Normally, glances needs to be installed by yourself, and since it is developed using the Python language, it is also resource intensive.
1
2
3
4
5
|
# Ubuntu
sudo apt install glances

# Cent
sudo yum install glances
|
The above 3 are my more commonly used system resource usage query tools, which are very sufficient in most cases.
Others may include nmon, vmstat, etc. If you are interested, you can also check them yourself.
1.3. disk resource management
df -h is usually used to query the hard disk resource usage (-h means use the file size unit of 1024 and easy to read display).
 1
 2
 3
 4
 5
 6
 7
 8
 9
10
11
|
➜  ~ df -h
Filesystem      Size  Used Avail Use% Mounted on
udev            1.9G     0  1.9G   0% /dev
tmpfs           395M  1.3M  394M   1% /run
/dev/vda2       126G   57G   63G  48% /
tmpfs           2.0G     0  2.0G   0% /dev/shm
tmpfs           5.0M     0  5.0M   0% /run/lock
tmpfs           2.0G     0  2.0G   0% /sys/fs/cgroup
/dev/loop0      114M  114M     0 100% /snap/core/13425
/dev/loop1      114M  114M     0 100% /snap/core/13308
tmpfs           395M     0  395M   0% /run/user/1000
|
fdisk -l is used to query the physical partitions.
 1
 2
 3
 4
 5
 6
 7
 8
 9
10
11
12
13
14
15
16
17
18
19
20
21
22
23
|
➜  ~ sudo fdisk -l
Disk /dev/loop0: 114 MiB, 119525376 bytes, 233448 sectors
Units: sectors of 1 * 512 = 512 bytes
Sector size (logical/physical): 512 bytes / 512 bytes
I/O size (minimum/optimal): 512 bytes / 512 bytes


Disk /dev/loop1: 113.9 MiB, 119418880 bytes, 233240 sectors
Units: sectors of 1 * 512 = 512 bytes
Sector size (logical/physical): 512 bytes / 512 bytes
I/O size (minimum/optimal): 512 bytes / 512 bytes


Disk /dev/vda: 128 GiB, 137438953472 bytes, 268435456 sectors
Units: sectors of 1 * 512 = 512 bytes
Sector size (logical/physical): 512 bytes / 512 bytes
I/O size (minimum/optimal): 512 bytes / 512 bytes
Disklabel type: gpt
Disk identifier: 376C8DD5-F786-4C39-9F4E-1461BE1FA269

Device     Start       End   Sectors  Size Type
/dev/vda1   2048      4095      2048    1M BIOS boot
/dev/vda2   4096 268433407 268429312  128G Linux filesystem
|
Of course, the fdisk command itself is still mainly used to manage hard disk partitions, and its management process is conversational, similar to the following.
1
2
3
4
5
6
7
8
9
|
[chancel@localhost ~]$ sudo fdisk /dev/vda
[sudo] password for chancel:
Welcome to fdisk (util-linux 2.23.2).

Changes will remain in memory only, until you decide to write them.
Be careful before using the write command.


Command (m for help):
|
Type m for help with the command, the creation process is very easy to understand
The mkfs.[format] command is used to format the hard disk, [format] stands for hard disk format, the common formats are as follows:
- mkfs.ext2
- mkfs.ext3
- mkfs.ext4
- mkfs.ntfs
- mkfs.xfs
After a successful partition, it usually needs to be formatted, using mkfs.[format] /dev/[device_name] to format it.
ip is a commonly used tool for viewing network information, and was used in later Linux to replace ipconfig.
Common uses are as follows.
ip addr show displays network ip information (abbreviated ip a)ip link show shows network interface information (abbreviated ip l)ip route list shows network routing information (abbreviated ip r)ip neigh show displays network ARP table information (abbreviated ip n)
ip addr is usually used to set the network information of the NIC, for example.
ip addr {add|change|del} 172.16.0.1/24 dev eth0 Add/change/delete NIC ip.
ip link is usually used to control the behavior of the NIC, for example.
ip link set eth0 {up/down} is used to turn the NIC on and offip link set eth0 promisc {on/off} is used to set the NIC promiscuous mode on and off
ip route is usually used to set routing information, for example.
ip route {add/del} [ip_address] via [gateway] add/remove gateway static routeip route {add/del} [ip_address] dev [interface] add/remove interface static route
ip neigh is usually used in the Wang Lupin arp table (replacing the old arp command), for example.
ip neigh {add/dev} [ip_address] dev [interface] add/remove an arp map
The more commonly used 2 parameters are ip addr and ip route.
The former is used to query network ip information, and its output is as follows.
 1
 2
 3
 4
 5
 6
 7
 8
 9
10
11
12
13
|
~ ➤ ip a
1: lo: <LOOPBACK,UP,LOWER_UP> mtu 65536 qdisc noqueue state UNKNOWN group default qlen 1000
    link/loopback 00:00:00:00:00:00 brd 00:00:00:00:00:00
    inet 127.0.0.1/8 scope host lo
       valid_lft forever preferred_lft forever
    inet6 ::1/128 scope host
       valid_lft forever preferred_lft forever
2: eth0: <BROADCAST,MULTICAST,UP,LOWER_UP> mtu 1500 qdisc fq_codel state UP group default qlen 1000
    link/ether 00:16:de:23:94:48 brd ff:ff:ff:ff:ff:ff
    inet 209.141.42.231/24 brd 209.141.42.255 scope global dynamic eth0
       valid_lft 2591984sec preferred_lft 2591984sec
    inet6 fe80::216:deff:fe23:9448/64 scope link
       valid_lft forever preferred_lft forever
|
The latter is commonly used to plan routing requests, as follows.
1
2
3
4
5
6
7
8
9
|
# Set the route to go to the gateway 172.16.0.1 and get the public IP as 4.4.4.4
➜  ~ ip route add 104.160.18.230 via 172.16.0.1
➜  ~ curl https://api.chancel.me/rest/api/v1/ip
{"status":1,"msg":"Query success","data":{"ip":"4.4.4.4"}}

# Set the route to go to the gateway 192.168.1.1 and get the public IP as 6.6.6.6
➜  ~ ip route del 104.160.18.230 via 192.168.1.1
➜  ~ curl https://api.chancel.me/rest/api/v1/ip
{"status":1,"msg":"Query success","data":{"ip":"6.6.6.6"}}
|
2. Hardware resources
Both lscpu and cat /proc/cpuinfo can output CPU information as follows.
1
2
3
4
5
6
7
8
|
➜  ~ lscpu
Architecture:            x86_64
  CPU op-mode(s):        32-bit, 64-bit
  Address sizes:         48 bits physical, 48 bits virtual
  ...
Vulnerabilities:
  ...
  Tsx async abort:       Not affected
|
Both lsmem and cat /proc/meminfo can output memory information as follows.
1
2
3
4
5
6
7
8
|
➜  ~ lsmem
RANGE                                 SIZE  STATE REMOVABLE  BLOCK
0x0000000000000000-0x00000000bfffffff   3G online       yes   0-23
0x0000000100000000-0x0000000f3fffffff  57G online       yes 32-487

Memory block size:       128M
Total online memory:      60G
Total offline memory:      0B
|
lsblk is used to view the hard disk information as follows.
 1
 2
 3
 4
 5
 6
 7
 8
 9
10
11
|
➜  ~ lsblk
NAME        MAJ:MIN RM   SIZE RO TYPE MOUNTPOINTS
loop0         7:0    0     4K  1 loop /var/lib/snapd/snap/bare/5
...
loop8         7:8    0    47M  1 loop /var/lib/snapd/snap/snapd/16292
sda           8:0    0 476.9G  0 disk
└─sda1        8:1    0 476.9G  0 part /mnt/SDA
nvme0n1     259:0    0 931.5G  0 disk
├─nvme0n1p1 259:1    0   300M  0 part /boot/efi
├─nvme0n1p2 259:2    0 866.5G  0 part /
└─nvme0n1p3 259:3    0  64.7G  0 part [SWAP]
|
lsusb is used to view the USB interface information as follows.
 1
 2
 3
 4
 5
 6
 7
 8
 9
10
11
|
➜  ~ lsusb -t
/:  Bus 04.Port 1: Dev 1, Class=root_hub, Driver=xhci_hcd/2p, 10000M
/:  Bus 03.Port 1: Dev 1, Class=root_hub, Driver=xhci_hcd/4p, 480M
    |__ Port 1: Dev 2, If 0, Class=Human Interface Device, Driver=usbhid, 12M
    |__ Port 1: Dev 2, If 1, Class=Human Interface Device, Driver=usbhid, 12M
    |__ Port 2: Dev 3, If 0, Class=Hub, Driver=hub/4p, 480M
        |__ Port 2: Dev 4, If 0, Class=Human Interface Device, Driver=usbhid, 12M
        |__ Port 2: Dev 4, If 1, Class=Human Interface Device, Driver=usbhid, 12M
        |__ Port 2: Dev 4, If 2, Class=Human Interface Device, Driver=usbhid, 12M
/:  Bus 02.Port 1: Dev 1, Class=root_hub, Driver=xhci_hcd/2p, 10000M
/:  Bus 01.Port 1: Dev 1, Class=root_hub, Driver=xhci_hcd/4p, 480M
|
2.5. lspci
lspci is used to extract all the hardware information on the motherboard as follows.
1
2
3
4
5
6
|
➜  ~ lspci
00:00.0 Host bridge: Advanced Micro Devices, Inc. [AMD] Renoir/Cezanne Root Complex
00:00.2 IOMMU: Advanced Micro Devices, Inc. [AMD] Renoir/Cezanne IOMMU
...
03:00.6 Audio device: Advanced Micro Devices, Inc. [AMD] Family 17h/19h HD Audio Controller
04:00.0 SATA controller: Advanced Micro Devices, Inc. [AMD] FCH SATA Controller [AHCI mode] (rev 81)
|
If more detailed pci information is needed, you can use lspci -v or lspci -vv.
lspci is usually used in conjunction with grep to sift through hardware information, such as lspci | grep -i eth to view network interfaces.
1
2
|
➜  ~ lspci | grep -i eth
02:00.0 Ethernet controller: Realtek Semiconductor Co., Ltd. RTL8111/8168/8411 PCI Express Gigabit Ethernet Controller (rev 15)
|
3. Advanced Commands
The following commands can display system resources and hardware information more comprehensively than the above commands.
3.1. netstat
netstat is used to monitor tcp/ip connection information, and is often used to find the program occupying a certain port.
For example, netstat -anp | grep 8384 can find out the PID of the program occupying port 8384.
-a means list all, -n means disable reverse domain name resolution, -p means print program PIDs.
The result is as follows.
1
2
3
4
|
➜  ~ netstat -atp | grep 8384
(Not all processes could be identified, non-owned process info
 will not be shown, you would have to be root to see it all.)
tcp        0      0 localhost:8384          0.0.0.0:*               LISTEN      817/syncthing
|
Using the -l parameter, you can display all the service programs that are listening to the port as follows.
1
2
3
4
5
6
7
8
|
➜  ~ netstat -tnlp
(Not all processes could be identified, non-owned process info
 will not be shown, you would have to be root to see it all.)
Active Internet connections (only servers)
Proto Recv-Q Send-Q Local Address           Foreign Address         State       PID/Program name
tcp        0      0 127.0.0.1:8384          0.0.0.0:*               LISTEN      817/syncthing
...
tcp6       0      0 :::42103                :::*                    LISTEN      796/client_linux_am
|
The -p argument prints out the PID, but the ROOT user runs a program whose PID cannot be probed by a normal user, so it depends on the situation whether you need to use sudo or not.
netstat can also print network interface information as follows.
 1
 2
 3
 4
 5
 6
 7
 8
 9
10
11
12
13
14
15
16
17
18
19
20
21
|
➜  ~ netstat -ie
Kernel Interface table
enp2s0: flags=4163<UP,BROADCAST,RUNNING,MULTICAST>  mtu 1500
        inet 192.168.4.12  netmask 255.255.240.0  broadcast 192.168.15.255
        inet6 fd1c:b796:b00f:3f00:28a8:42ce:82e2:eda1  prefixlen 64  scopeid 0x0<global>
        inet6 fe80::fea6:9f63:51a6:3dc0  prefixlen 64  scopeid 0x20<link>
        inet6 240e:47c:630:64d9:b23c:f504:1008:88df  prefixlen 64  scopeid 0x0<global>
        ether 5a:bc:da:6d:f1:09  txqueuelen 1000  (Ethernet)
        RX packets 4480503  bytes 2392967850 (2.2 GiB)
        RX errors 0  dropped 1093  overruns 0  frame 0
        TX packets 2206930  bytes 246464482 (235.0 MiB)
        TX errors 0  dropped 0 overruns 0  carrier 0  collisions 0

lo: flags=73<UP,LOOPBACK,RUNNING>  mtu 65536
        inet 127.0.0.1  netmask 255.0.0.0
        inet6 ::1  prefixlen 128  scopeid 0x10<host>
        loop  txqueuelen 1000  (Local Loopback)
        RX packets 231260  bytes 482760756 (460.3 MiB)
        RX errors 0  dropped 0  overruns 0  frame 0
        TX packets 231260  bytes 482760756 (460.3 MiB)
        TX errors 0  dropped 0 overruns 0  carrier 0  collisions 0
|
netstat has a lot of advanced networking features, if you are interested, you can refer to man netstat to learn them.
3.2. lsof
In Linux, everything is a file.
lsof (list open files) is a tool that lists the current operating system’s open files, so lsof can do very many things.
Using lsof directly will show all the files that are currently open on the system, and since long-running operating systems have multiple processes, there are fewer operations that use lsof alone.
lsof is often used to query resource usage, for example.
lsof -c syncthing shows the resources being used by the process syncthinglsof -c -p 817 shows the resources being used by the process with PID 817lsof +d /tmp shows the list of processes that are using the /tmp directorylsof -i :8384 shows the processes that are using port 8384
lsof can be used in a wide range of scenarios, for example
- If you can’t unmount the file system, you can use
lsof /mnt/sda to see what process is occupying the directory.
- If you can’t start a program listening on port 8080, you can use
lsof -i :8080 to see what process is occupying port 8080.
- …
3.3. lshw
The lshw command is commonly used to output a summary of the machine configuration, for example.
1
|
lshw -html > my-hardware.html
|
In addition to the optional html report, there are -json and -xml formats available.
The -short parameter allows you to view an abbreviated report, as follows.
1
2
3
4
5
6
7
8
|
➜  ~ sudo lshw -short
H/W path              Device          Class       Description
=============================================================
                                      system      To Be Filled By O.E.M. (To Be Filled By O.E.M.)
/0                                    bus         X300M-STX
...
/0/4                                  system      Motherboard registers
/0/5                                  system      Motherboard registers
|
The -class parameter allows you to view information about some of the specified hardware, as follows.
 1
 2
 3
 4
 5
 6
 7
 8
 9
10
11
|
➜  ~ sudo lshw -class cpu -class disk
  *-cpu
       description: CPU
       product: AMD Ryzen 7 PRO 4750G with Radeon Graphics
       vendor: Advanced Micro Devices [AMD]
       ...
       sectorsize=512 wwid=eui.0025385211918242
  *-disk
       description: ATA Disk
       ...
       logicalsectorsize=512 sectorsize=512
|
3.4. inxi (recommended)
inxi is used to get all hardware and system information, as follows.
1
2
3
4
5
|
➜  ~ inxi
CPU: 8-core AMD Ryzen 7 PRO 4750G with Radeon Graphics (-MT MCP-)
speed/min/max: 1594/1400/4454 MHz Kernel: 5.19.0-1-MANJARO x86_64 Up: 6h 43m
Mem: 11918.5/60152.7 MiB (19.8%) Storage: 1.38 TiB (22.2% used) Procs: 416
Shell: Zsh inxi: 3.3.19
|
The -M parameter can be used to get information about the machine hardware brand.
1
2
3
4
|
➜  ~ inxi -M
Machine:
  Type: Desktop Mobo: ASRock model: X300M-STX serial: <superuser required>
    UEFI: American Megatrends LLC. v: P1.70 date: 07/01/2021
|
The following parameters are available for obtaining individual hardware.
-C CPU information-A Sound card information-N Network card information-D Hard disk information-s Sensor temperature and fan speed
The following parameters are available for obtaining system resource information.
-p Hard disk partition information-I information about the number of processes and boot time-t Show the 5 most CPU/memory consuming applications (use cm10 to change to the top 10)-n network interface information-r Software repository information
Similarly inxi also supports exporting machine configuration reports.
1
2
3
4
5
|
➜  ~ inxi -b
System:
  Host: KDE-Manjaro-64G Kernel: 5.19.0-1-MANJARO arch: x86_64 bits: 64
    ...
  Shell: Zsh inxi: 3.3.19
|
Below is more comprehensive, outputting information about the machine’s hardware and software.
 1
 2
 3
 4
 5
 6
 7
 8
 9
10
11
12
13
14
15
16
17
18
19
20
21
|
➜  ~ inxi -Fza
System:
  Kernel: 5.19.0-1-MANJARO arch: x86_64 bits: 64 compiler: gcc v: 12.1.0
    parameters: BOOT_IMAGE=/boot/vmlinuz-5.19-x86_64
    root=UUID=2ddecb6a-da82-48f6-9f5a-d810b32d623b rw quiet apparmor=1
    security=apparmor resume=UUID=406e14e5-7ca3-4959-bb61-8bf9158da6f9
    udev.log_priority=3
  Desktop: KDE Plasma v: 5.24.6 tk: Qt v: 5.15.5 wm: kwin_x11 vt: 1
    dm: SDDM Distro: Manjaro Linux base: Arch Linux
Machine:
  Type: Desktop Mobo: ASRock model: X300M-STX serial: <superuser required>
    UEFI: American Megatrends LLC. v: P1.70 date: 07/01/2021
CPU:
  Info: model: AMD Ryzen 7 PRO 4750G with Radeon Graphics bits: 64
...
Info:
  Processes: 416 Uptime: 6h 52m wakeups: 0 Memory: 58.74 GiB
  used: 11.55 GiB (19.7%) Init: systemd v: 251 default: graphical
  tool: systemctl Compilers: gcc: 12.1.0 clang: 14.0.6 Packages: 1707
  pacman: 1701 lib: 372 flatpak: 0 snap: 6 Shell: Zsh v: 5.9
  running-in: konsole inxi: 3.3.19
|