We know that Prometheus uses the pull mode, but in some network scenarios (such as not on a subnet or firewall), Prometheus cannot directly pull the monitoring metrics data, so we may need a mode that can actively push. Pushgateway is one of the tools in the Prometheus ecosystem to solve this problem.
However, Pushgateway is not a panacea and has some drawbacks.
- Aggregating data from multiple nodes to pushgateway, if pushgateway is down, it will be more affected.
- Prometheus pulls state up only for pushgateway, which is not valid for every target
Since Pushgateway can persist all monitoring data pushed to it, Prometheus will still pull old monitoring data even if your monitoring is offline, so you need to manually clean up the data that Pushgateway does not want.
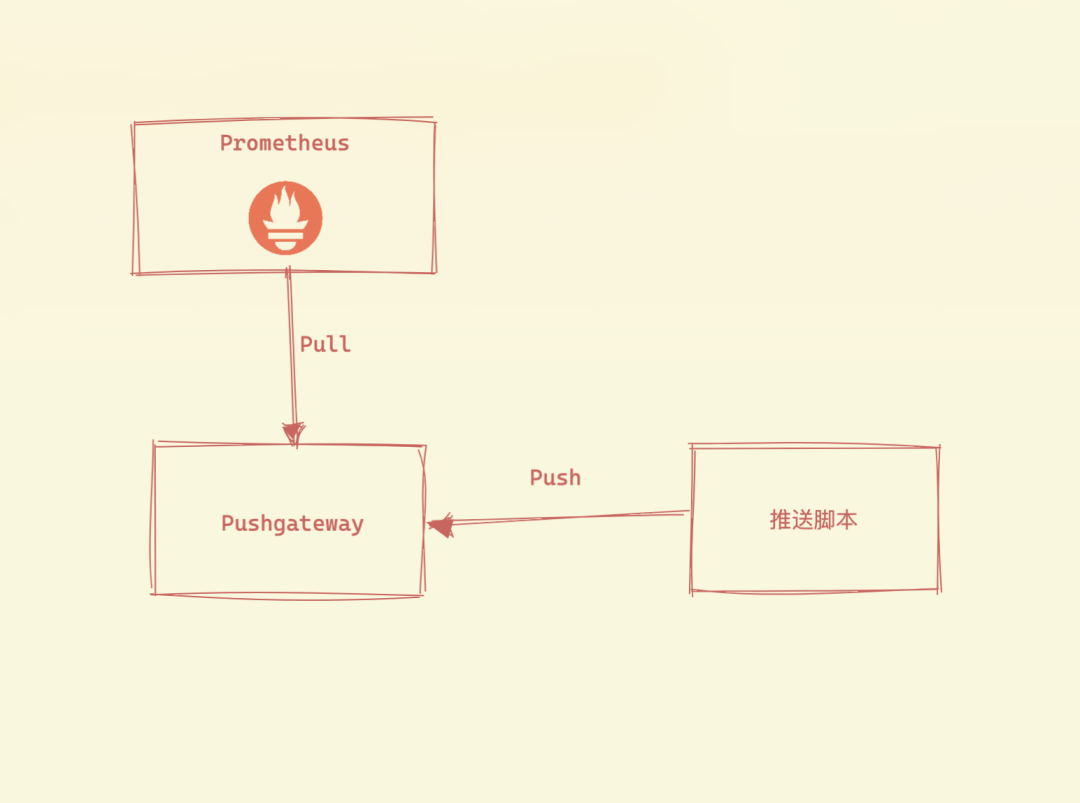
Pushgateway exists to allow ad hoc and batch jobs to expose their metrics to Prometheus. Since these types of jobs may not exist long enough to be crawled, they can push metrics to Pushgateway, which then exposes them to Prometheus.One thing we need to understand is that Pushgateway does not actively push metrics to Prometheus. Rather, it is a script that actively pushes the metric data to Pushgateway and then Prometheus still grabs the metrics via pull mode.
We have also introduced the textfile collector in node-exporter which can also be used to collect metrics and seems to be similar to Pushgateway, what is the difference between the two? textfile is usually used for node-level metrics, while Pushgateway is used for service-level metrics.
Installation
It is also very easy to install Pushgateway, just download the binary version for your platform from the Release page and unzip it. If you want to compile it yourself from the source, you can do so by executing the make command directly under the root of the code.
Execute the Pushgateway binary file directly and you’re ready to start it. To change the listening address, you can specify it with the --web.listen-address flag (e.g. 0.0.0.0:9091 or :9091). By default Pushgateway does not keep metrics. However, the --persistence.file flag allows us to specify a file in which the pushed metrics will be stored, so that they will still exist when Pushgateway is restarted.
Alternatively, we can use a Docker image to boot directly.
|
|
Again, we are deploying Pushgateway here in a Kubernetes cluster, and the corresponding resource manifest file is shown below.
|
|
Here we specify the persistence file with --persistence.file and then expose the service with a Service, applying the above resource list file directly.
|
|
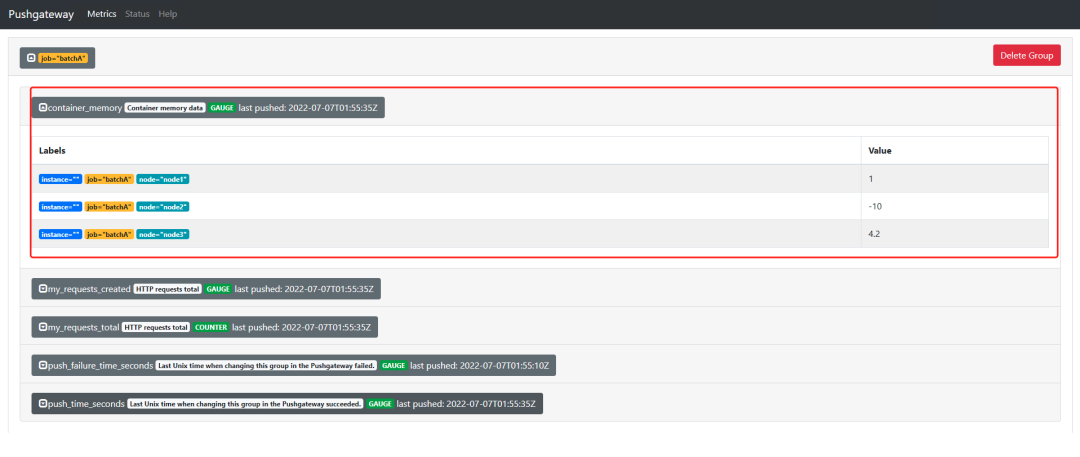
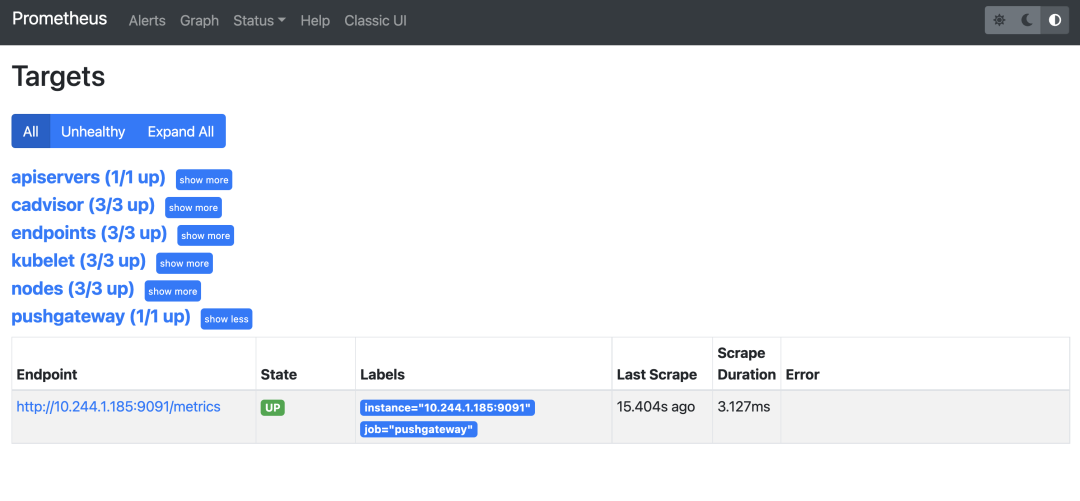
By default Pushgateway provides a simple web page where you can see what metrics are currently available.

Basic Usage
Pushgateway’s data push supports two methods, Prometheus Client SDK push and API push.
Client SDK pushing
Prometheus itself provides SDKs that support multiple languages and can be used to generate relevant data and push it to Pushgateway by means of SDKs, which of course requires client-side code support, which is the official recommended solution. Currently the official SDK covers the following languages.
- Go
- Java or Scala
- Python
- Ruby
There are also many third-party libraries available, see this link for details: https://prometheus.io/docs/instrumenting/clientlibs/
Let’s take Python as an example.
First install the Python SDK for Prometheus.
|
|
Then create a file called app.py with the following contents.
|
|
First imported the Python SDK for Prometheus, then created a CollectorRegistry instance. A metric of type Gauge and Counter is created respectively. The first parameter is the name of the metric, the second is the comment information of the metric, the third is the associated label, and then the metric value is set for the different label values, and finally the push_to_gateway function sends the metric data to the specified Pushgateway service.
The above Python file can be executed directly to push the data to Pushgateway.
|
|
API Push
It is also very easy to push metrics using the Prometheus text protocol without having to provide a separate CLI, just use a command line tool like curl.
Note, however, that in the text protocol, each line must end with a line feed ('LF' or '\n'), and ending a line in any other way, such as with 'CR' ('\r'), 'CRLF' ('\r\n'), or just the end of the packet, will result in a protocol error.
The pushed metrics are managed by group, identified by a group key consisting of any number of tags, the first of which must be the job tag.
For example, we now push a single sample to the group identified by {job="some_job"}.
|
|
Note that the some_metric here will be UNTYPED untyped since no type information is provided.
After the above command is executed, we can go back to the Pushgateway web page and check it out.
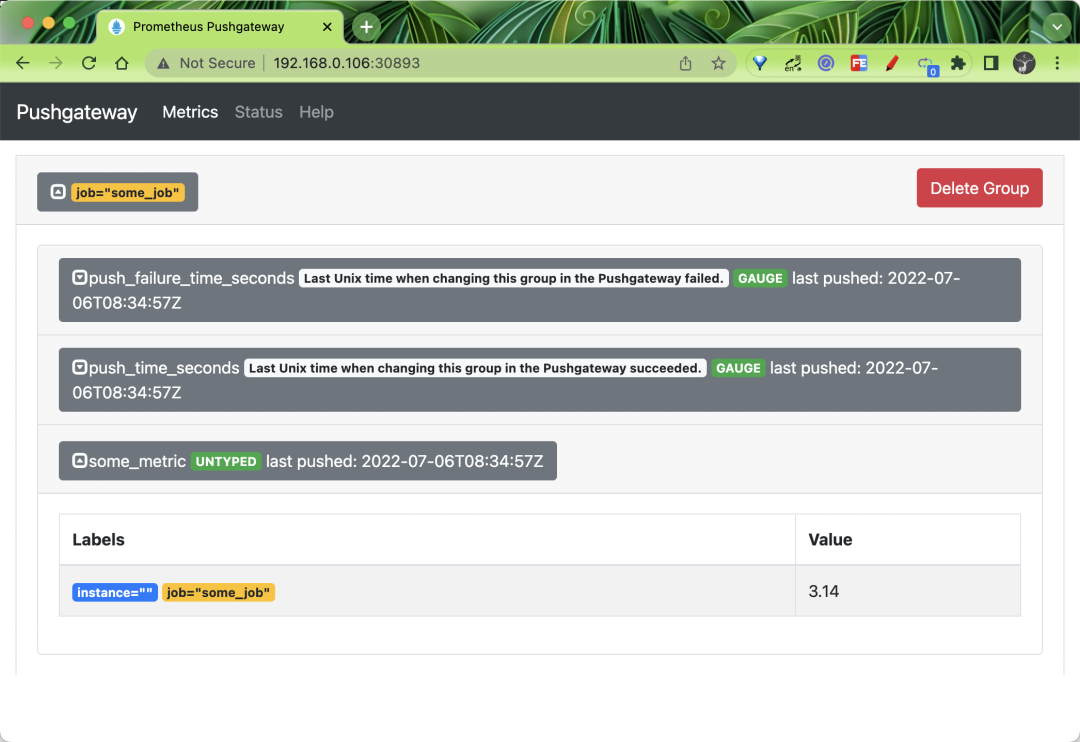
You can see that the some_metric metric we pushed above appears on the page, and is located under the job="some_job" grouping.
Next, we will push some more complex metrics to the {job="some_job",instance="some_instance"} grouping, remember to delete the above grouping before proceeding, and then execute the following command.
This command pushes the metrics to the group identified by {job="some_job",instance="some_instance"}. Pay attention to how the type information and help information are provided in the content of the metrics, here our metrics are all with types.
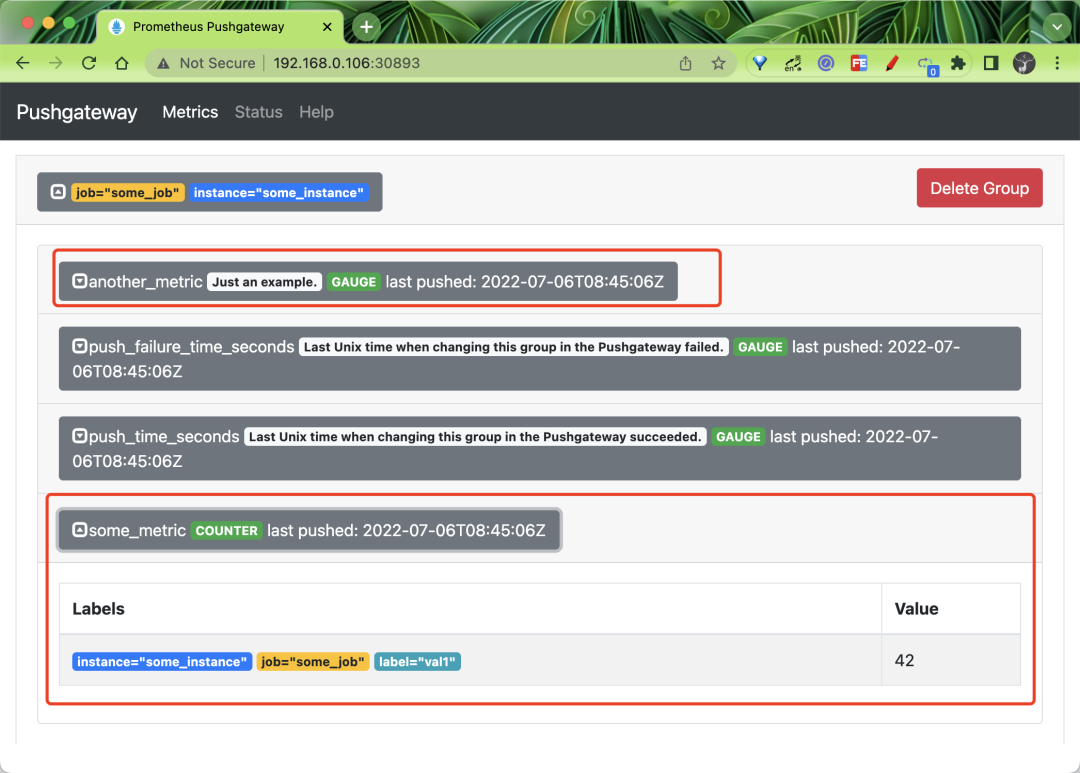
You can see the two metrics pushed above in the web interface, one of type COUNTER and one of type GAUGE.
If you want to delete all the metrics under a group, we can also do that with the curl command. For example, to delete all metrics in the group identified by {job="some_job",instance="some_instance"}, you can do it with the following command.
|
|
For example, if we want to delete all the indicators in the group identified by {job=“some_job”}, then we can use the following command to do so.
|
|
However, it is important to note that the indicators in the {job="some_job",instance="some_instance"} group above are not included here, even if they have the same job tag.
If you want to delete all indicators in all groups, you can do so with the following command.
|
|
But note that you need to enable the admin API via Pushgateway’s command line flag --web.enable-admin-api.
Grabbing metrics
Now we need to configure Pushgateway’s metrics into Prometheus and let Prometheus actively crawl Pushgateway’s metrics data, we can of course also use service discovery, here we create a separate crawl task for Pushgateway, add the following in Prometheus Add the crawl configuration shown below to Prometheus.
We also use the same endpoints based auto-discovery configuration to match the kube-mon namespace with the service pushgateway. After updating the above configuration, Prometheus will automatically discover the Pushgateway service.
We now re-push the following indicators.
Once the push is complete we can look up the some_metric and another_metric metrics in Prometheus.
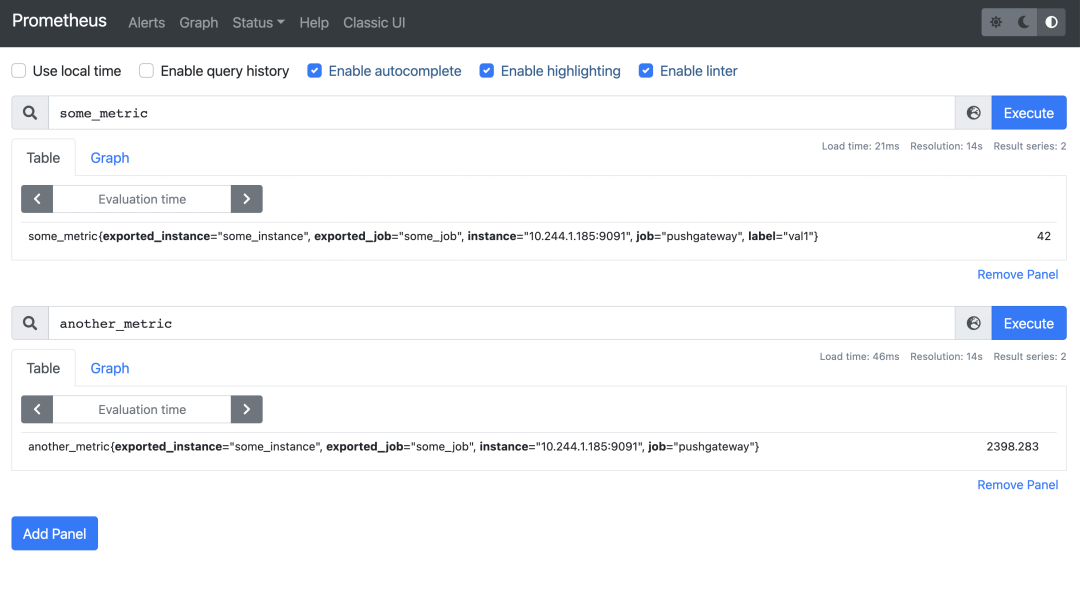
Prometheus will attach a job and instance tag to each crawled metric, the job tag comes from the scrape configuration, here we crawl Pushgateway with the job tag job="pushgateway" and the value of the instance tag will be automatically set to The value of the instance tag is automatically set to the host and port of the crawl target, so all metrics crawled from Pushgateway will have Pushgateway’s host and port as the instance tag, but this may conflict with the job and instance tags you attach to Pushgateway metrics, so Prometheus will rename these tags to exported_job and exported_instance.
However, this behavior is usually not expected when crawling Pushgateway. More often than not you may prefer to keep the job and instance tags of the metrics pushed to Pushgateway, in which case we just need to set honor_labels: true in the Pushgateway crawl configuration and we update the Prometheus configuration again.
We added a new honor_labels: true configuration to the above task of crawling Pushgateway, and after the update we re-query the two metrics pushed to Pushgateway.
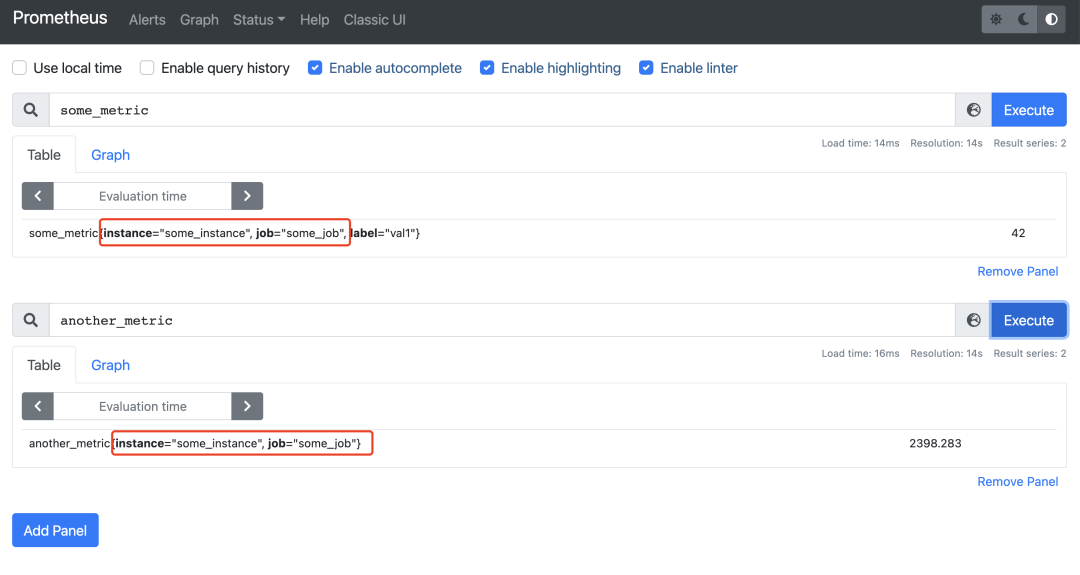
You can see that the job and instance tags become the tag values we push to Pushgateway, which is probably more in line with our expectations.
Also note that Pushgateway does not provide any strong consistency guarantees, there is no high availability solution, and the best it can do is to save the metrics to disk for each specified time period.