I. What is vmagent
The following is the original official documentation.
vmagent is a tiny but powerful agent that helps us collect metrics from different sources and store them in vm or other prometheus-compatible storage systems that support the remote_write protocol.
Features of vmagent
- Supports as a replacement for prometheus for grabbing data from, for example, node_exporter
- Can read data from Kafka. See these documents.
- Data can be written to Kafka. See these documents.
- Labels (relabel) can be added, removed, and modified via Prometheus relabeling. Data can be filtered before it is sent to remote storage. For more information, see these documents.
- Receive data via all ingestion protocols supported by VictoriaMetrics - see these documents.
- Can replicate collected metrics to multiple remote storage systems simultaneously.
- Works smoothly in environments with unstable connections to remote storage. If remote storage is not available, the collected metrics are cached in
-remoteWrite.tmpDataPath. Once the connection to the remote storage is repaired, the cached metrics are sent to the remote storage. You can use Limit the maximum disk usage of the buffer -remoteWrite.maxDiskUsagePerURL.
- Uses less RAM, CPU, disk IO, and network bandwidth than Prometheus.
vmagent When a large number of targets must be crawled, the crawl targets can be distributed among multiple instances. See these documents.- Targets that expose millions of time series, such as the /federate endpoint in Prometheus, can be efficiently crawled. See these documents.
- High base and high churn can be handled by limiting the number of unique time series before they are crawled and sent to a remote storage system. Please refer to these documents.
- Crawl configurations can be loaded from multiple files. See these documents.
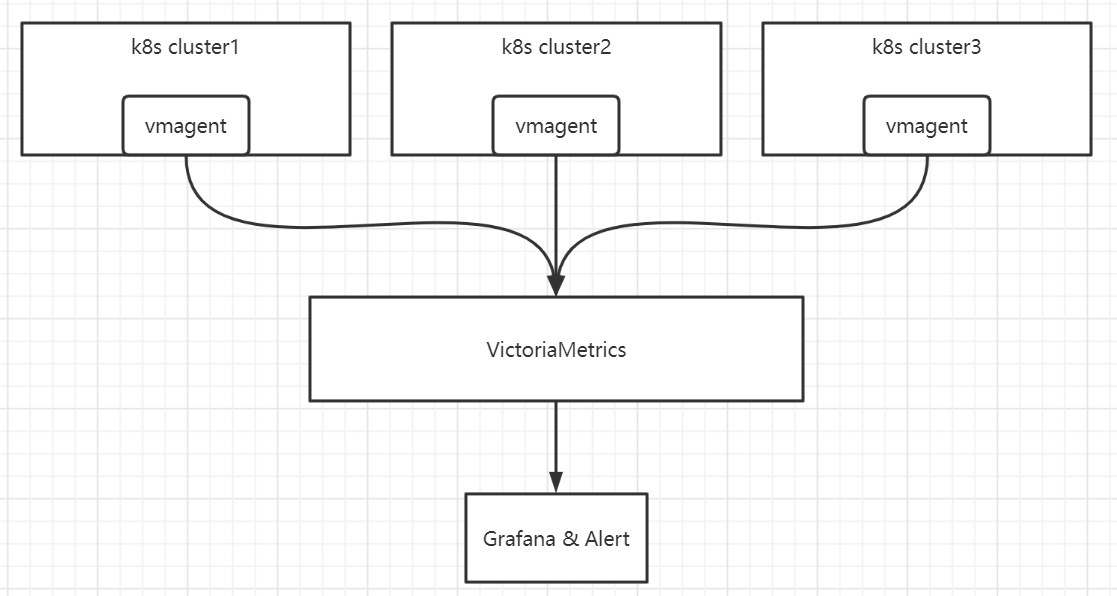
II. Architecture diagram
- Metrics collected by vmagent include: node-exporter, kubernetes-cadvisor, kube-state-metrics
- vmagent collects and sends to VictoriaMetrics on the monitoring team
III. Deployment
namespace.yml
1
2
3
4
|
apiVersion: v1
kind: Namespace
metadata:
  name: sbux-monitoring
|
serviceaccount.yml
1
2
3
4
5
|
apiVersion: v1
kind: ServiceAccount
metadata:
  name: vmagent
  namespace: sbux-monitoring
|
clusterrole.yml
 1
 2
 3
 4
 5
 6
 7
 8
 9
10
11
12
13
14
15
16
17
18
19
20
21
|
apiVersion: rbac.authorization.k8s.io/v1
kind: ClusterRole
metadata:
  name: vmagent
rules:
  - apiGroups: ["", "networking.k8s.io", "extensions"]
    resources:
      - nodes
      - nodes/metrics
      - services
      - endpoints
      - endpointslices
      - pods
    verbs: ["get", "list", "watch"]
  - apiGroups: [""]
    resources:
      - namespaces
      - configmaps
    verbs: ["get"]
  - nonResourceURLs: ["/metrics", "/metrics/resources"]
    verbs: ["get"]
|
clusterrolebinding.yml
 1
 2
 3
 4
 5
 6
 7
 8
 9
10
11
12
|
apiVersion: rbac.authorization.k8s.io/v1
kind: ClusterRoleBinding
metadata:
  name: vmagent
roleRef:
  apiGroup: rbac.authorization.k8s.io
  kind: ClusterRole
  name: vmagent
subjects:
  - kind: ServiceAccount
    name: vmagent
    namespace: sbux-monitoring
|
configmap-vmagent.yml
The vmagent profile, depending on the actual requirements, needs to capture node-exporter, cadvisor, and kube-state-metrics metrics.
global.external_labels field: configured as the name of each cluster
scrape_timeout : I set 60 seconds, the actual test kube-state-metrics metrics are sometimes slow to pull, in addition to adjusting this timeout, you should also adjust the CPU and memory configuration of the kube-state-metrics pod.
 1
 2
 3
 4
 5
 6
 7
 8
 9
10
11
12
13
14
15
16
17
18
19
20
21
22
23
24
25
26
27
28
29
30
31
32
33
34
35
36
37
38
39
40
41
42
43
44
45
46
47
48
49
50
51
52
53
54
55
56
57
58
59
60
61
|
apiVersion: v1
kind: ConfigMap
metadata:
  name: vmagent-config
  namespace: sbux-monitoring
data:
  scrape.yml: |
    global:
      scrape_interval: 30s
      scrape_timeout: 60s
      external_labels:
        cluster: gds-poc
    scrape_configs:
    - job_name: 'vmanent'
      static_configs:
        - targets: ['vmagent:8429']
    - job_name: 'node-exporter'
      kubernetes_sd_configs:
      - role: endpoints
      relabel_configs:
      - source_labels: [__meta_kubernetes_endpoints_name]
        regex: node-exporter
        action: keep
      - source_labels: [__meta_kubernetes_namespace]
        regex: kube-system
        action: keep
      - source_labels: [__meta_kubernetes_pod_node_name]
        target_label: cps_node_name

    - job_name: 'kubernetes-cadvisor'

      scheme: https
      tls_config:
        ca_file: /secrets/kubelet/ca
        key_file: /secrets/kubelet/key
        cert_file: /secrets/kubelet/cert
      metrics_path: /metrics/cadvisor

      kubernetes_sd_configs:
      - role: node

      relabel_configs:
      - action: labelmap
        regex: __meta_kubernetes_node_label_(.+)
      - source_labels: [__meta_kubernetes_node_name]
        regex: (.+)
        target_label: cps_node_name
        replacement: $1

    - job_name: 'kube-state-metrics'

      kubernetes_sd_configs:
      - role: endpoints

      relabel_configs:
      - source_labels: [__meta_kubernetes_endpoints_name]
        action: keep
        regex: kube-state-metrics
      - source_labels: [__meta_kubernetes_namespace]
        action: keep
        regex: kube-system
|
secret_kubelet.yml
The cadvisor job uses tls, so it needs to mount the kubelet’s certificate.
1
2
3
|
#Use the kube-client-tls-secret under the kube-system namespace
#Modify namespace fields, remove creationTimestamp, resourceVersion, selfLink, uid, etc.
~]$ kubectl -n kube-system get secret kubelet-client-tls-secret -oyaml > secret_kubelet.yml
|
deployment.yml
Command-line parameters.
-promscrape.config=/config/scrape.yml Specify the path to the vmagent’s configuration file, such as the volumeMounts field-remoteWrite.tmpDataPath=/tmpData, -remoteWrite.maxDiskUsagePerURL=10GB Specify the temporary storage directory for monitoring metrics as /tmpData, the maximum available temporary directory is 10GB.-remoteWrite.url=http://victoriametrics.victoriametrics:8428/api/v1/write, -remoteWrite.url=https://prometheus-vminsert.xxxxxx. net/insert/0/prometheus specifies two remote write addresses, one for my own test victoriametrics and one for the monitoring team’s victoriametrics-remoteWrite.tlsInsecureSkipVerify=true Because the https certificate of the remote write address is self-signed, so you need to configure this option, production environments are recommended to add basicauth configuration to strengthen security-promscrape.maxScrapeSize=50MB The maximum size of scrape response. in actual testing, when the number of applications in the cluster is large, the response will exceed 20MB.
 1
 2
 3
 4
 5
 6
 7
 8
 9
10
11
12
13
14
15
16
17
18
19
20
21
22
23
24
25
26
27
28
29
30
31
32
33
34
35
36
37
38
39
40
41
42
43
44
45
46
47
48
49
50
51
52
53
54
55
56
57
|
---
apiVersion: apps/v1
kind: Deployment
metadata:
  name: vmagent
  namespace: sbux-monitoring
  labels:
    app: vmagent
spec:
  selector:
    matchLabels:
      app: vmagent
  template:
    metadata:
      labels:
        app: vmagent
    spec:
      serviceAccountName: vmagent
      containers:
        - name: vmagent
          image: "registry.xxxxxx.net/library/vmagent:v1.77.1"
          imagePullPolicy: IfNotPresent
          args:
            - -promscrape.config=/config/scrape.yml
            - -remoteWrite.tmpDataPath=/tmpData
            - -promscrape.maxScrapeSize=50MB
            - -remoteWrite.maxDiskUsagePerURL=10GB
            - -remoteWrite.url=http://victoriametrics.victoriametrics:8428/api/v1/write
            - -remoteWrite.url=https://prometheus-vminsert.xxxxxxcf.net/insert/0/prometheus
            - -remoteWrite.tlsInsecureSkipVerify=true
            - -envflag.enable=true
            - -envflag.prefix=VM_
            - -loggerFormat=json
          ports:
            - name: http
              containerPort: 8429
          resources:
            limits:
              cpu: "4"
              memory: 8Gi
            requests:
              cpu: "1"
              memory: 1Gi
          volumeMounts:
            - name: config
              mountPath: /config
            - name: kubelet-client-tls-secret
              mountPath: /secrets/kubelet
      volumes:
        - name: config
          configMap:
            name: vmagent-config
        - name: kubelet-client-tls-secret
          secret:
            defaultMode: 420
            optional: true
            secretName: kubelet-client-tls-secret
|
service.yml
 1
 2
 3
 4
 5
 6
 7
 8
 9
10
11
12
13
14
15
16
17
|
---
apiVersion: v1
kind: Service
metadata:
  labels:
    app: vmagent
  name: vmagent
  namespace: sbux-monitoring
spec:
  ports:
  - name: http-8429
    port: 8429
    protocol: TCP
    targetPort: 8429
  selector:
    app: vmagent
  type: ClusterIP
|
IV. Problems encountered
kube-state-metrics metrics are not available, and the vmagent reports errors
1
|
{"ts":"2022-05-30T13:20:16.594Z","level":"error","caller":"VictoriaMetrics/lib/promscrape/scrapework.go:355","msg":"error when scraping \"http://192.168.154.27:8080/metrics\" from job \"kube-state-metrics\" with labels {cluster=\"prod-azure\",instance=\"192.168.154.27:8080\",job=\"kube-state-metrics\"}: cannot read Prometheus exposition data: cannot read a block of data in 0.000s: the response from \"http://192.168.154.27:8080/metrics\" exceeds -promscrape.maxScrapeSize=16777216; either reduce the response size for the target or increase -promscrape.maxScrapeSize"}
|
Solution: Increase promscrape.maxScrapeSize.
kube-state-metrics metrics pull timeout
Solution: The configuration of the kube-state-metrics application is too low, CPU memory is adjusted upwards. vmagent configuration file inside the scrape timeout is changed to 60s.
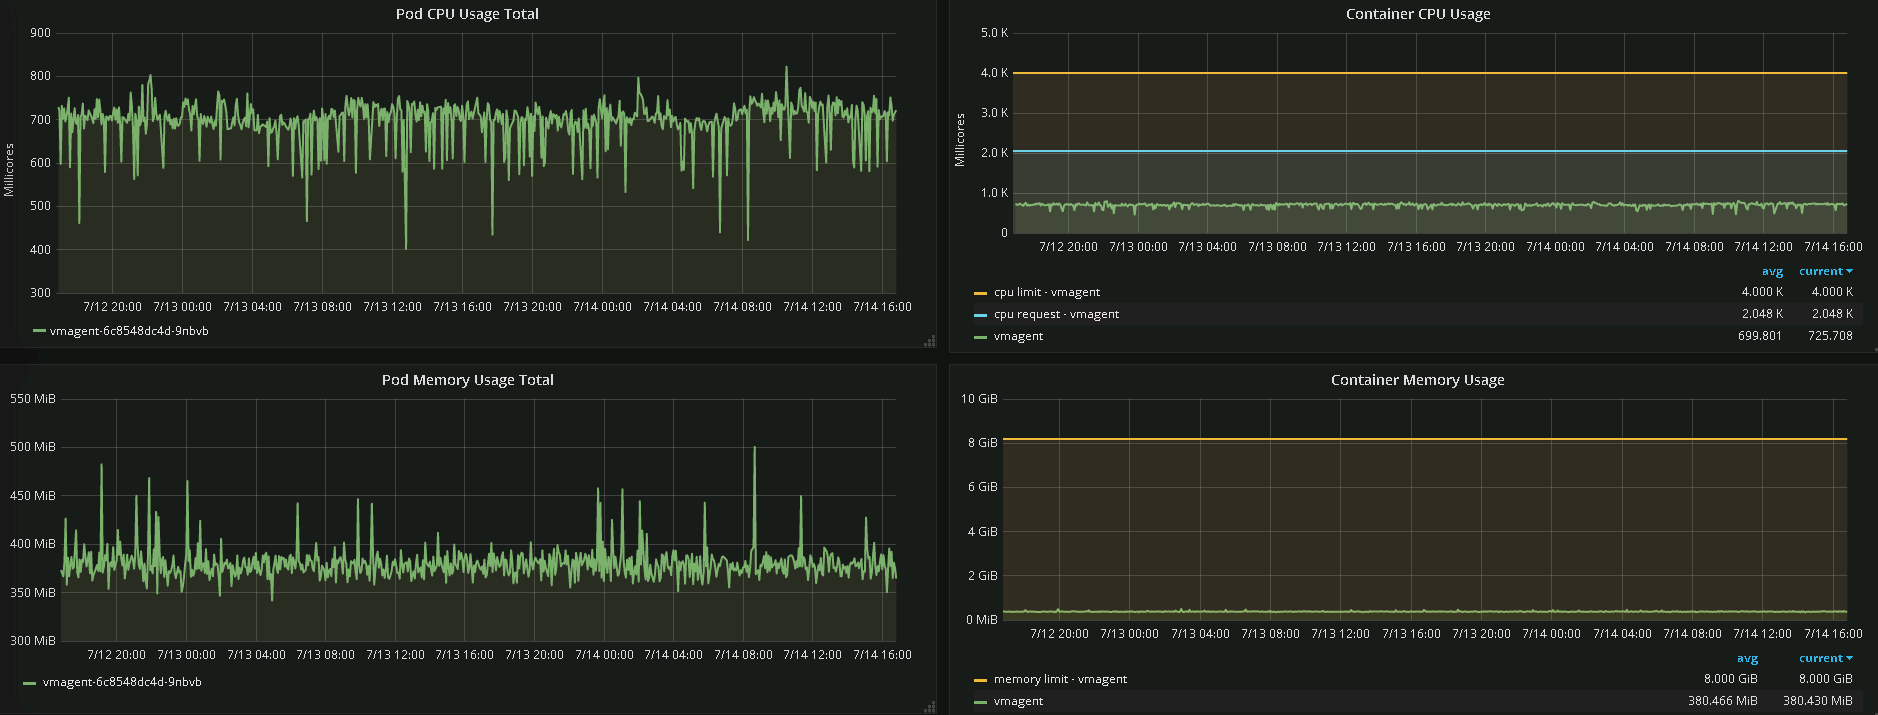
dashboard
V. Resource consumption
Basically 1C1G is enough
- node nodes: 400
- pod number: 4500 (790 of them are business pods, the rest are system components and so on)
- deployment: 191 (131 of them are business applications, the rest are system components)