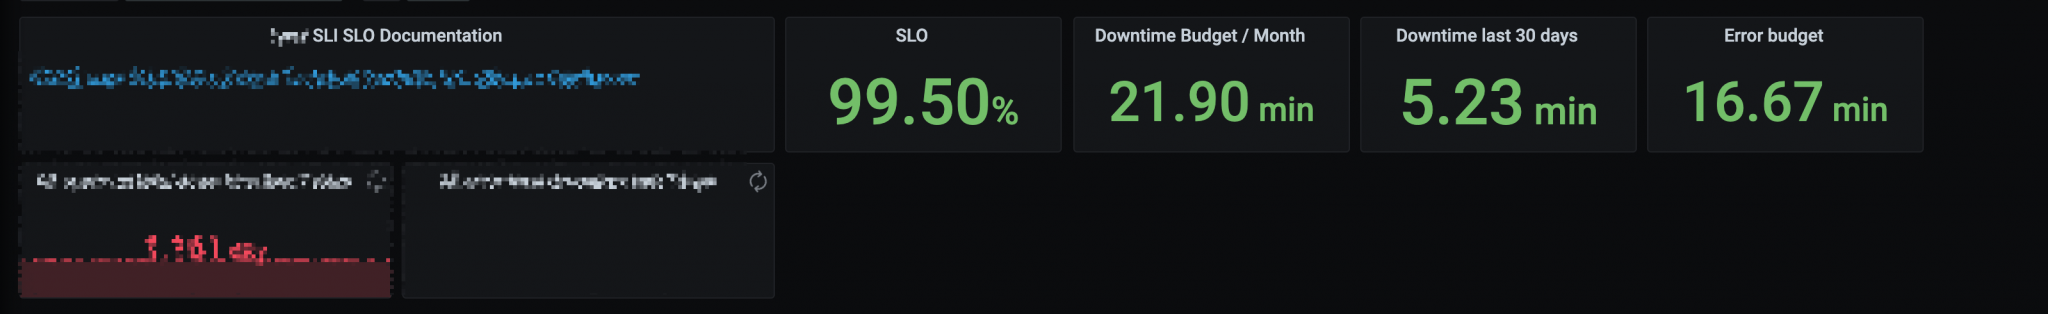
Use PromQL to query the Error budget used in the past month, and then display the current SLI.
The effect is shown in the following figure.
The difficulty of this query is that the contents of the PromQL query are all the values of the time series. For example, the query of memory > 0.6 finds the correspondence of the time and value of all the time series that satisfy the condition. It takes some skills to make the result of the query be time.
The idea of implementation is as follows.
- first define the up criteria at the minute level, that is, the definition of SLO: how to be considered up and how to be considered down in 1min.
- then write a query to find out how many minutes are up and how many minutes are down in a time interval.
- finally, you can get the real-time SLI results.
There are two ideas that I can think of to achieve this.
The first one is to use recording rules. First, we need to define a rule called job:sla_minute_up, the result of this rule evaluation is whether the current minute meets all the conditions of up. So it could be a complex expression with many ands connected.
Then we just add up all the up minutes, i.e. sum_over_time(job:sla_minute_up[30d]. Finally divide by all the minutes in a month: sum_over_time(job:sla_minute_up[30d]) / 30 * 24 * 60 and that is the final SLI obtained.
But there is a particularly important point here, which is that sum_over_time counts all the points that have occurred during this time. For example, if the acquisition interval is 15s, then the up metric will have 4 points per minute, and sum_over_time(up[1m]) should normally result in 4. So, to use this method, recording rules evaluation internal must be set to 60s to achieve only one point per minute. to achieve only one point per minute.
This way the actual result is tied to the calculation process, so it’s not very good. The following method is a bit more ingenious.
We can change the idea, directly calculate the percentage of conditions met during this time, and then the percentage multiplied by the time period, is the final up time.
To get this percentage, the first step is still the definition of up at the minute level. But what we care about is not the specific value, but whether the condition is met, i.e., either yes or no. Using the operation >bool, we can convert the result into a bool, if the condition is met, the result is 1, if not, the result is 0. Thus, we only need to calculate the average value over the period to get the percentage of SLI. For example, if all are up, then the result is all 1, so the average over all time is 100%. If there is a point that is not up, then the percentage is correct according to the percentage that occupies all the points.
This method is independent of the interval. the smaller the interval, the more data points there are and the accuracy will increase. the larger the interval, the more accuracy will be lost. Objectively speaking, the true SLI represented is correct after removing the precision.
If you want to express the SLI for a day, assuming that the SLO is only the error rate, you can use the following query.
|
|
You can also work with Grafana to use Grafana’s selected time intervals.
|
|
Reference