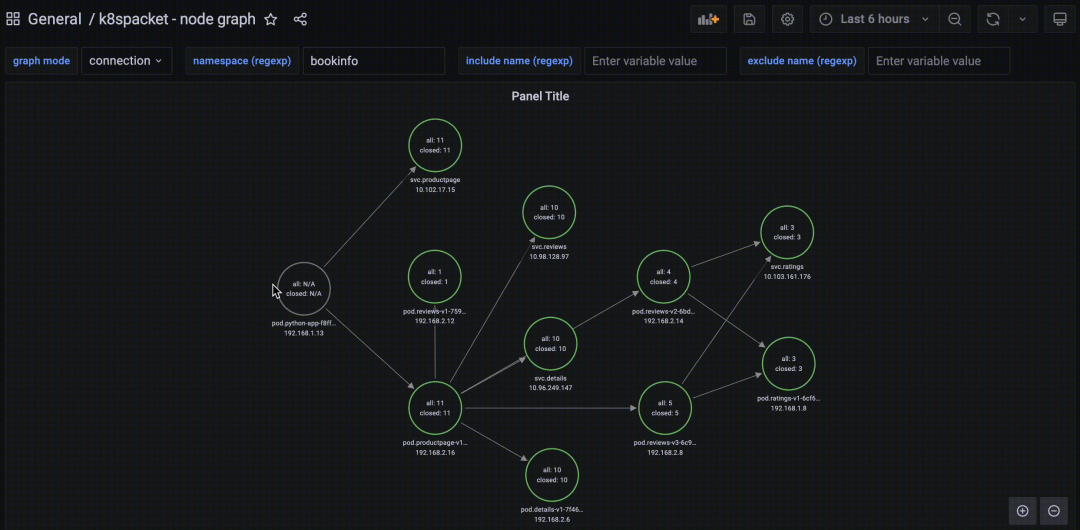
Do you know what your K8s cluster is doing when you’re not using it? Who established TCP communication with him? Who is he calling? Using k8spacket and Grafana, we can visualize the TCP traffic in the cluster so we can understand how workloads are communicating with each other. Check how many connections were established, how many bytes were exchanged, and how long those connections were active.
Introduction
k8spacket is a tool written in Golang that uses the gopacket third-party library to sniff TCP packets (incoming and outgoing) on workloads, and it creates TCP listeners on the running container network interface. When Kubernetes creates a new container, the CNI plug-in is responsible for providing the possibility to communicate with other containers or from the cluster to the outside world. The most common approach is to use linux namespaces to isolate networks and veth pairs to connect isolated namespaces and bridges. Besides the bridge type, CNI plugins can also use other types (vlan, ipvlan, macvlan), but all of them create a network interface for the container linux namespace, which is the main handle of the k8spacket sniffer.
k8spacket runs with the hostNetwork: true option, which eliminates the isolation mentioned earlier by collecting TCP streams, processing the data, and exposing the results through the API for use by Grafana.
In addition to this.
k8spacketis a Kubernetes API client that resolves sniffed workloads into visual cluster resource names (Pods and Services).- It starts as a DaemonSet to listen for network interfaces on all nodes.
- The implemented listener checks every 10 seconds (by default) if there is a new (or old) network interface to watch (or forget).
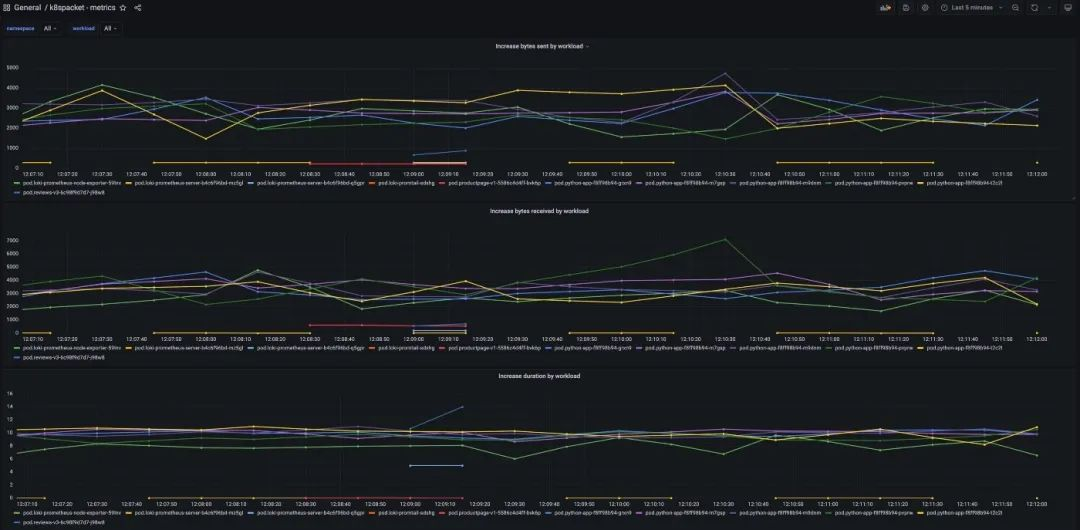
In addition to graphs showing cluster resources, it exposes Prometheus metrics.
Installation
To install k8spacket, we need to install Helm and Grafana. in addition, the tool requires Hamad’s Node Grafana API plug-in (Node Graph API).
Adding the Node Graph API plug-in and data source to your Grafana instance allows you to manually complete or change the helm values for Grafana Chart, for example
|
|
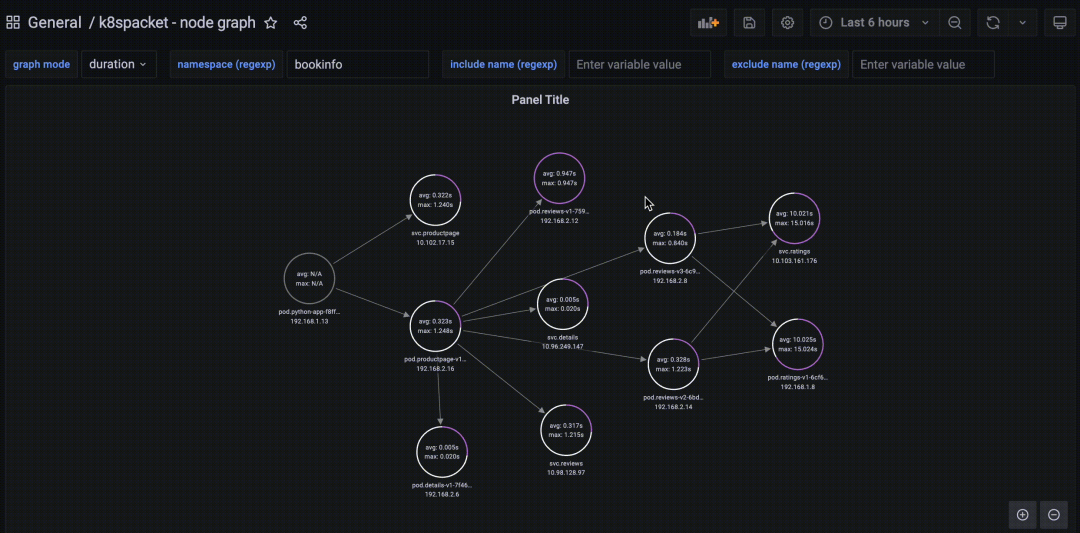
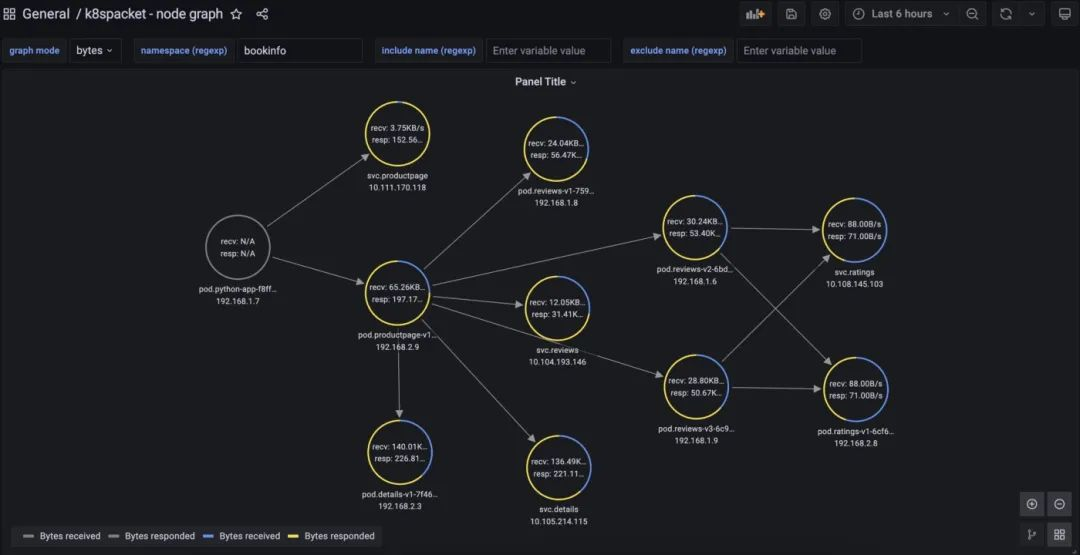
Usage
Statistic types
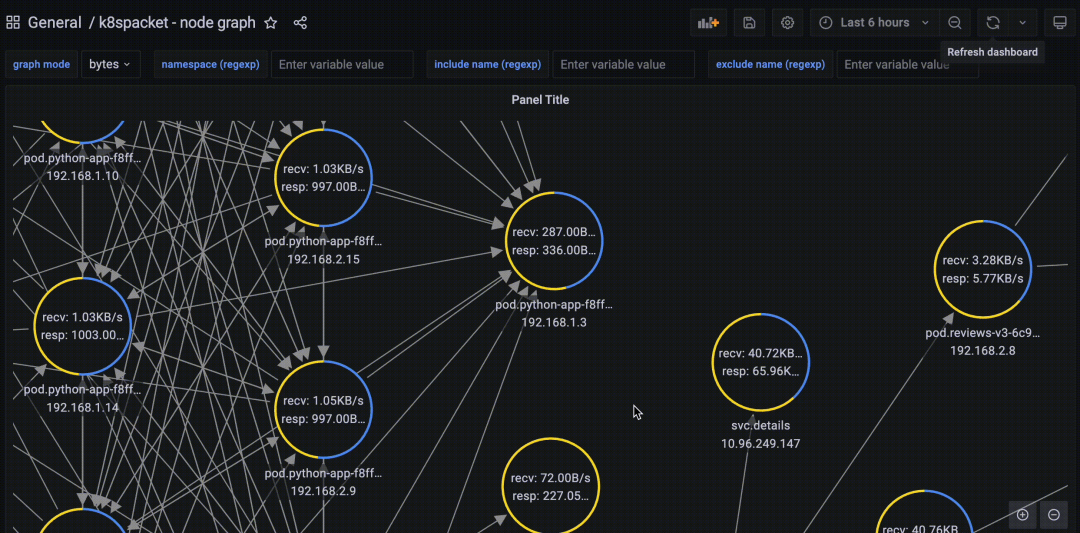
connection- Helps to know how many connections have been established between workloads and from or to external clients. It tells you which sockets remain open and may cause problems. It can be helpful when you are using some SNAT gateways with exhausted ports (e.g., Azure AKS).bytes- Shows the number of bytes sent or received by the workload.duration- Calculates the lifecycle of a connection.
Filter
-
By namespace - select one or more K8s namespaces
-
By Included Name - Select workload names for visualization
-
Exclude by name - exclude workload names from the visualization