Grafana Phlare is an open source software project for aggregating continuous profiling data.Grafana Phlare can be fully integrated with Grafana, allowing you to correlate it with other observable signals.
What is continuous profiling?
The concept is valuable: Profiling can help you understand the resource usage of your programs, which in turn can help you optimize their performance and cost. However, the shift to distributed cloud-native architectures complicates this, creating the need for continuous analytics, where information about resource usage is automatically collected periodically across the computing infrastructure, then compressed and stored as time-series data, which allows you to visualize changes over time and zoom in on profile files that match the time period of interest - For example, the amount of CPU time spent during its highest utilization.
In terms of the value it brings, continuous analytics has been called the fourth pillar of observability (after metrics, logging, and tracing).
At Grafana Labs, we are beginning to look at using continuous analytics to understand the performance of the software we use to support Grafana Cloud, including Grafana Loki, Grafana Mimir, Grafana Tempo, and Grafana. For example, if we are paging a slow query in Mimir, we might use analytics to see where in the Mimir codebase that query is taking the most time. If we see Grafana crashing repeatedly due to out-of-memory errors, we would look at the memory profile to see which object was consuming the most memory before the crash.
While there are open source projects for storing and querying continuous analytics data, after some investigation, we struggled to find one that met the scalability, reliability, and performance requirements needed to support the level of continuous analytics required by Grafana Labs. A group of engineers led the project during a company-wide hackathon that demonstrated the value of analyzing data when connected to metrics, logs and traces, further increasing our desire to roll out continuous analytics in all environments.
As a result, we decided to set out to create a database for continuous analytics telemetry, based on the design principles that have made our other open source observability backends Loki, Tempo, and Mimir so successful: horizontally scalable architecture and the use of object storage.
Core Features
Grafana Phlare provides horizontally scalable, highly available, long-term storage and analysis of data queries. Just like Prometheus, it’s easy to install with a single binary and no additional dependencies. Because Phlare uses object storage, you can store all the history you need without spending a lot of money. Its native multi-tenancy and isolation feature set allows you to run one database for multiple independent teams or business units.The core features of Grafana Phlare are shown below.
-
Easy to install: Using its monolithic model, only one binary is needed to get
Grafana Phlareup and running, with no additional dependencies. On Kubernetes, you can use Helm Chart method for different modes of deployment. -
Horizontal scalability: The ability to run
Grafana Phlareon multiple machines makes it easy to scale the database to handle the amount of analysis generated by the workload. -
High Availability:
Grafana Phlarereplicates incoming profiles files, ensuring that no data is lost in the event of a machine failure. This means you can rollout without interrupting profile file ingestion and analysis. -
Cheap, durable profile file storage:
Grafana Phlareuses object storage for long-term data storage, enabling it to take advantage of this ubiquitous, cost-effective, and highly durable technology. It is compatible with multiple object storage implementations, including AWS S3, Google Cloud Storage, Azure Blob Storage, OpenStack Swift, and any S3-compatible object storage. -
Native Multi-Tenancy:
Grafana Phlares multi-tenant architecture enables you to isolate data and queries from separate teams or business units so that these groups can share the same database.
Architecture
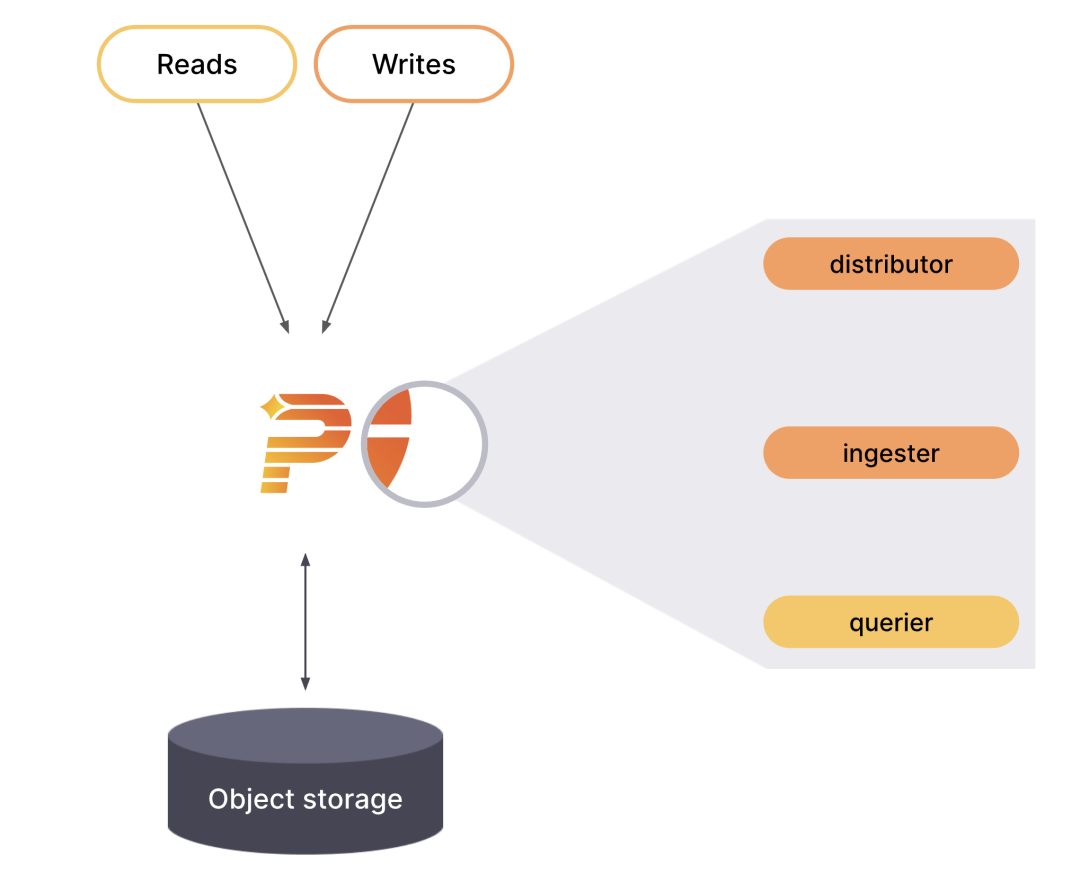
Grafana Phlare has a microservices-based architecture with multiple horizontally scalable microservices that can run individually and in parallel. grafana Phlare microservices are called components. grafana Phlare is designed to compile the code for all components into a single binary. The -target parameter controls which components a single binary will run as, in the same pattern as Grafana Loki. For users who want a quick experience, Grafana Phlare can also run in monolithic mode, with all components running simultaneously in a single process.
Most of Grafana Phlare’s components are stateless and do not require any data retention between process restarts. Some components are stateful and rely on storage that is not prone to data loss to prevent data loss between process restarts. grafana Phlare includes a set of components that interact to form clusters: Distributor, Ingester, and Querier.
Monolithic Mode
Monolithic mode runs all required components in a single process and is the default mode of operation, which you can set by specifying the -target=all parameter. Monolithic mode is the easiest way to deploy Grafana Phlare, which is useful if you want to get started quickly or if you want to use Grafana Phlare in a development environment. To see a list of components that run when -target is set to all, run Grafana Phlare with the -modules flag.
|
|
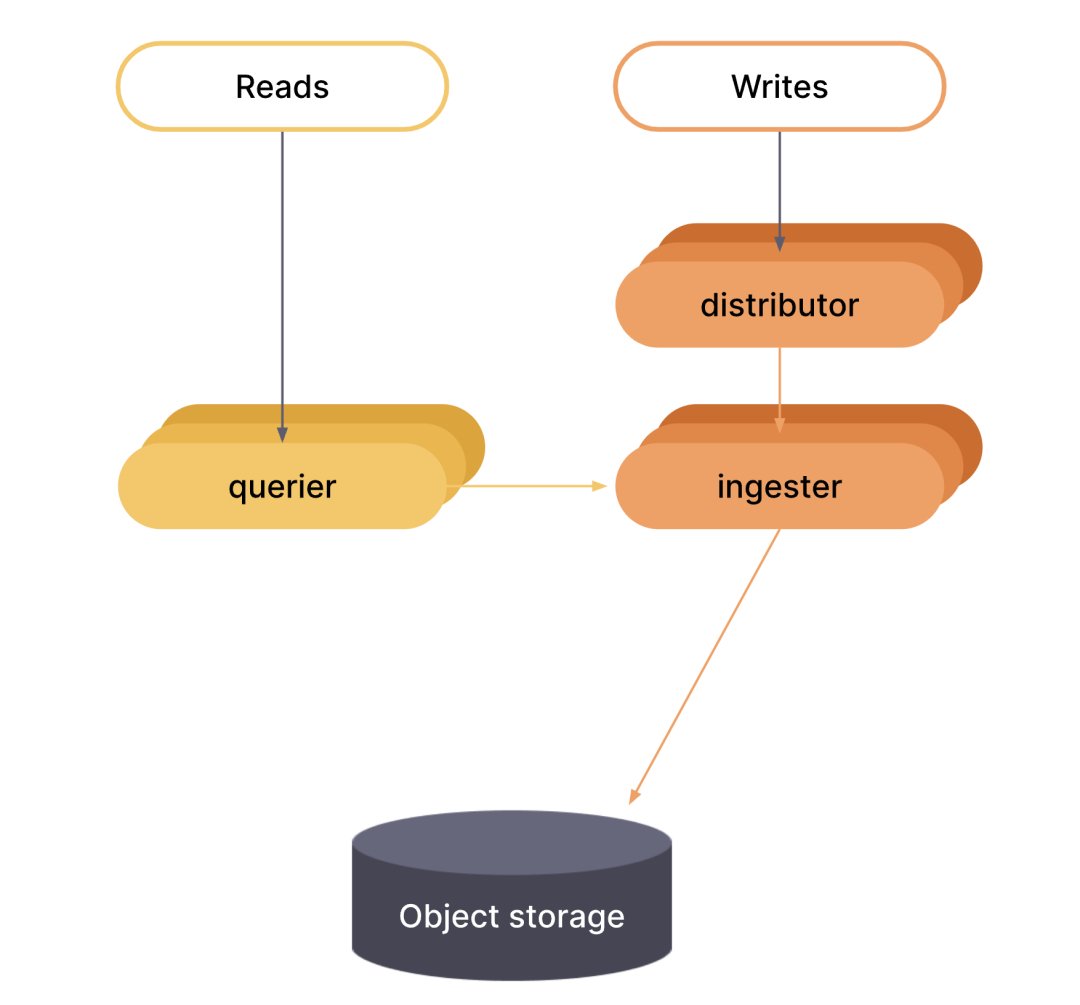
Microservice Model
In the microservices model, components are deployed in different processes. Scaling is done on a per-component basis, which allows for greater flexibility in scaling and more granular fault domains. The microservices model is the preferred approach for production deployments, but it is also the most complex.
In microservices mode, each Grafana Phlare process is invoked with its -target parameter set to a specific Grafana Phlare component (for example, -target=ingester or -target=distributor). To get a working instance of Grafana Phlare, you must deploy each of the required components. If you want to deploy Grafana Phlare using the microservices model, then it is highly recommended to use Kubernetes.
Deployment
Here we deploy to a Kubernetes cluster as Helm Chart, provided we have an available Kubernetes cluster with kubectl and helm configured.
First we create a namespace called phlare-test and deploy the entire application in that namespace.
|
|
Then add Phlare’s Helm Chart repository.
Then we can use Helm to do the installation.
If you want to install it as a single entity by default, just execute the following command to install it with one click.
|
|
If you want to install Grafana Phlare in microservice mode, you can first obtain the default values configuration file that is officially provided.
|
|
We need to use the values file above to install Grafana Phlare, or you can adjust the configuration according to the actual situation of your cluster, for example ingester configured with memory: 6Gi, cpu: 1 for resource requests. I have insufficient cluster resources here, so I can lower it a bit and set the number of copies to 1 for now (for testing only), otherwise there is no way to schedule successfully.
The installation can then be started using the following command.
|
|
To see if the Pod status is OK after deployment.
|
|
Wait until the status of all Pods changes to Running or Completed to indicate that the deployment is complete.
Usage
Then we can configure Grafana to query profile data. Here we install Grafana in the same Kubernetes cluster where Phlare is installed, again using the following command in one click.
|
|
The list of Pods for the entire phlare-test namespace after deployment is as follows.
|
|
We can use the following command to forward the Grafana service locally.
|
|
Then open http://localhost:3000 in your browser to access the Grafana service.
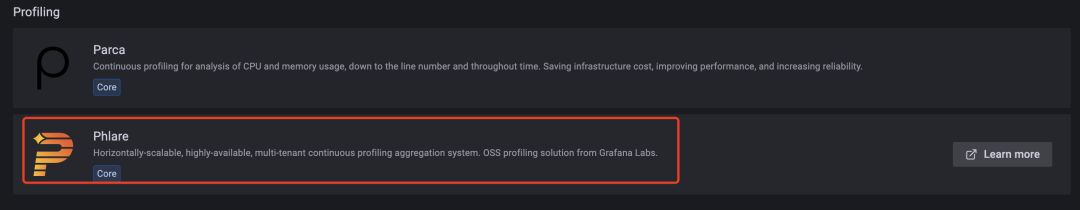
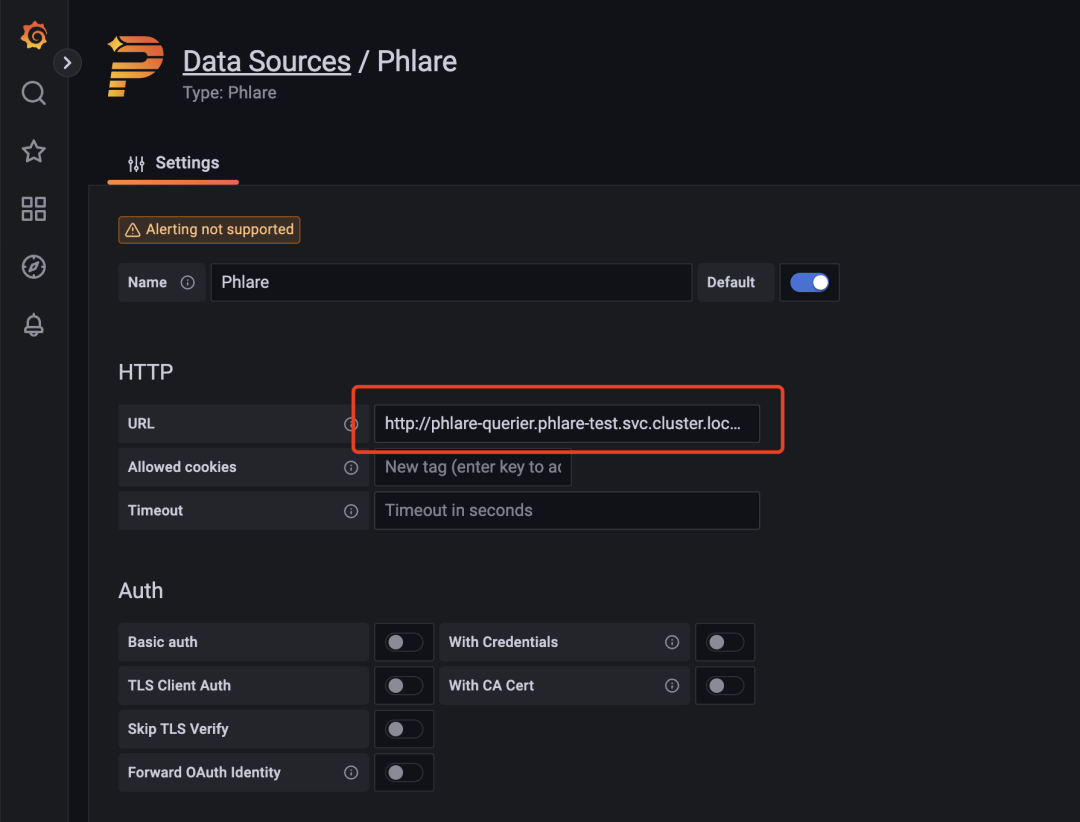
Click Configuration -> Data Sources on the left side of the page to add a data source for profiles, and select a data source of type phlare.
Set the URL of the data source to http://phlare-querier.phlare-test.svc.cluster.local.:4100/.
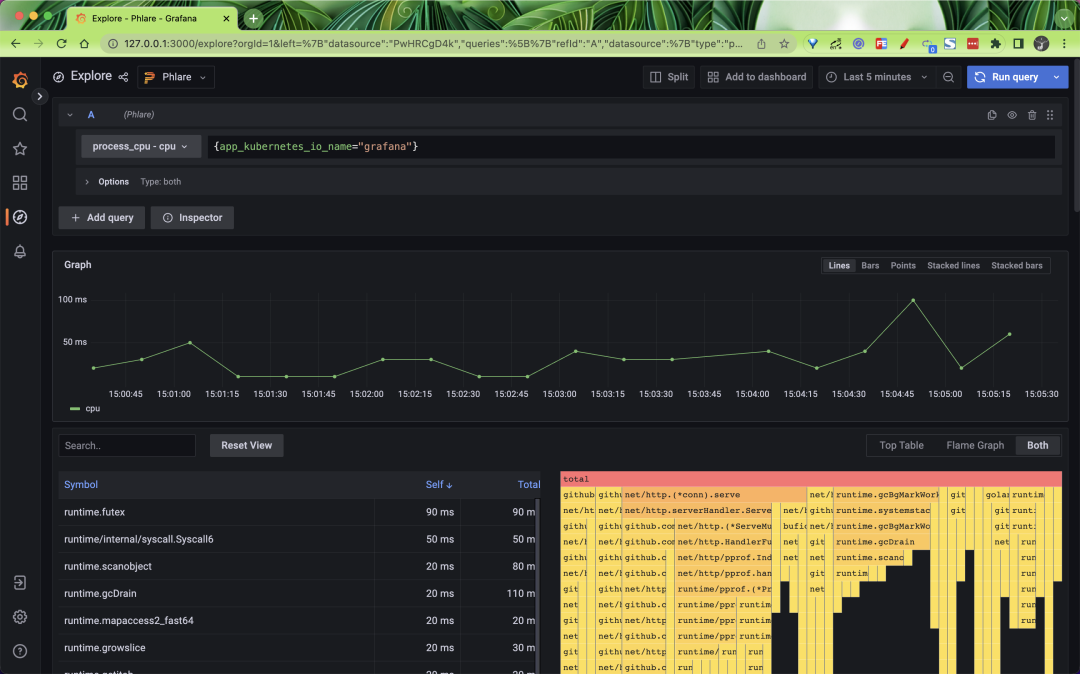
Click Save & Test to save. Once the data source is added, you should be able to query the profiles file in Grafana Explore in almost the same way as Loki and Prometheus, as shown below we can query the CPU of the Grafana application.
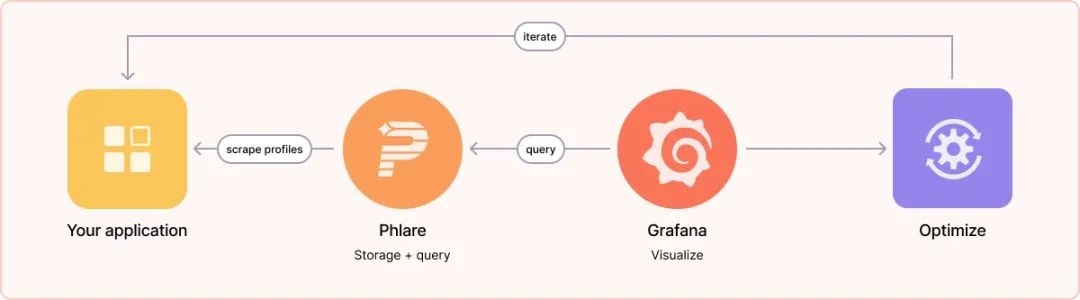
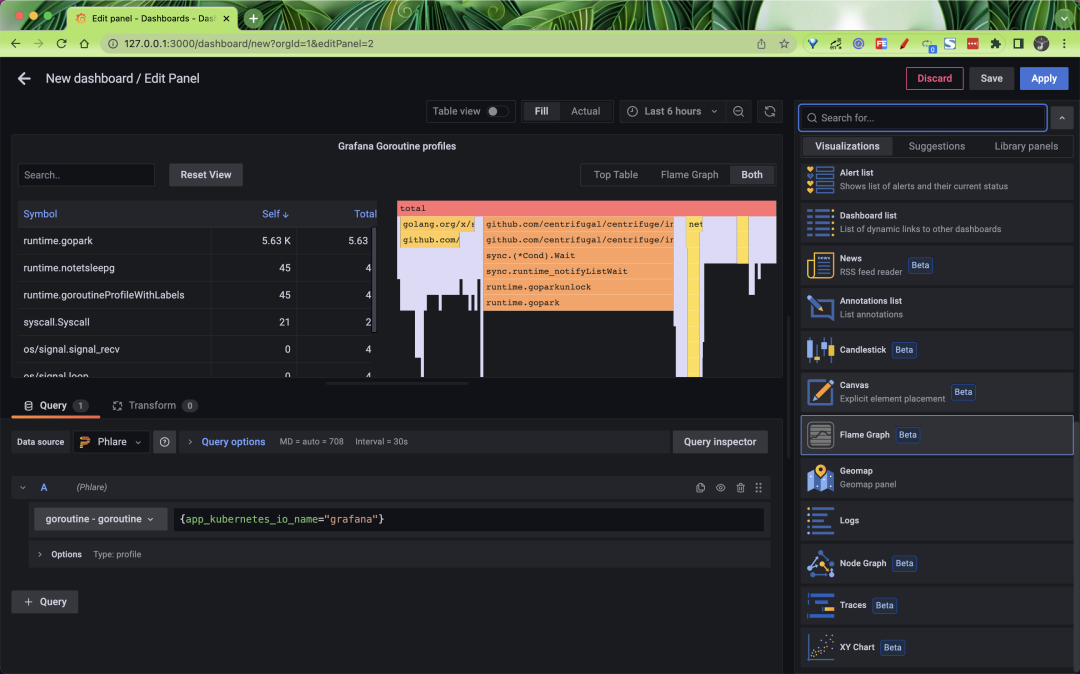
Phlare integrates natively with Grafana, allowing you to visualize profile data along with metrics, logging, and tracing, and get a full view of the entire stack. We’ve also added a flame chart panel to Grafana that allows you to build dashboards that display analytics data alongside data from hundreds of different data sources visualized in Grafana.
Phare’s Helm Chart uses the default configuration for its agents to crawl pods as long as they have the correct annotations, which uses relabel_config and kubernetes_sd_config that may be similar to Prometheus or Grafna Agent configurations.
In order for Phlare to crawl the pod, you must add the following annotation to the pod.
where phlare.grafana.com/port should be set to the port on which your pod serves the /debug/pprof/ endpoint. Note that the values of phlare.grafana.io/scrape and phlare.grafana.io/port must be enclosed in double quotes to ensure that it is represented as a string.
We configured these two annotations above when we installed Grafana, so we can use Phlare to constantly scrape the Grafana application’s profiles data, which is why we can go ahead and filter Grafana’s profiles data above.
Ref
https://github.com/grafana/phlarehttps://grafana.com/blog/2022/11/02/announcing-grafana-phlare-oss-continuous-profiling-database/