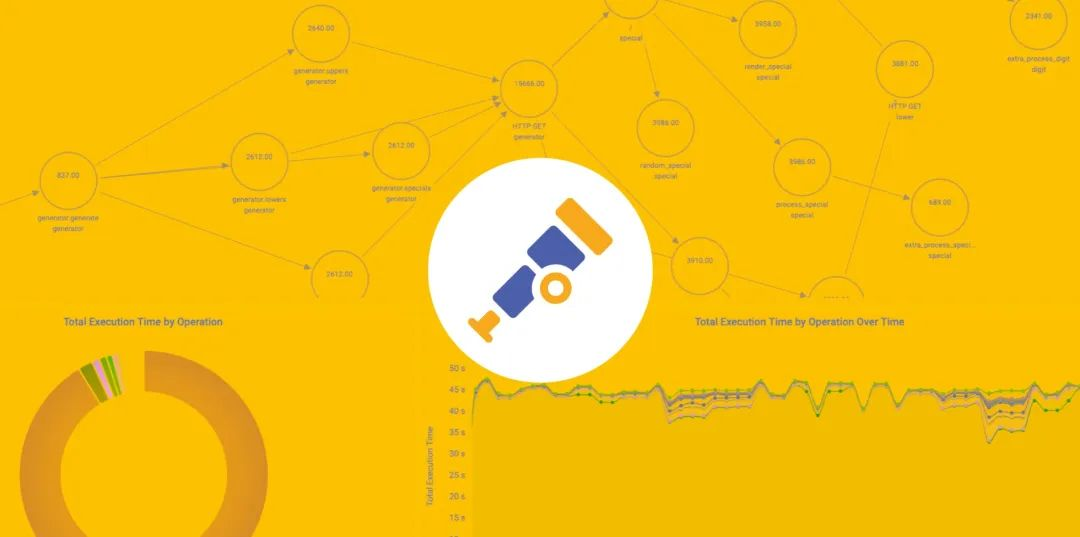
OpenTelemetry is a data collection middleware that can be used to generate, collect and export monitoring data (Metrics, Logs and Traces) that can be stored, queried and displayed by OpenTelemetry-enabled middleware for data observation, performance analysis, system monitoring, service alerting and other capabilities.
The opentelemetry project starts in 2019 and aims to provide a standardised solution for observability software for cloud-based environments. It provides a monitoring service system that is independent of the three parties. The project has so far received support from Zipkin, Jaeger, skywalking, Prometheus and many other well-known middleware.
1. Introduction to Distributed Monitoring Systems
With the rise of SOA, microservices architecture and technologies such as PaaS and Devops, it has become more difficult to track and troubleshoot online issues. The observability of online business is gaining more and more attention from enterprises, which has led to the emergence of many excellent link tracking and service monitoring middleware. Some of the more popular ones include Zipkin, Skywalking, Jaeger, Pinpoint and others.
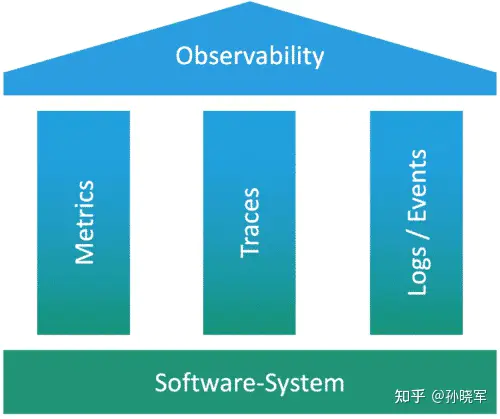
For a typical application, there are three types of data that need to be logged by the monitoring system: Metric, logs and traces.
-
Metrics
Provides information on the metrics used to perform the runtime. For example, CPU usage, memory usage, GC status, site traffic, etc.
-
Logging
Allows you to monitor the logs of your application processes, such as logs recorded by Log4j integration, or events or notifications that occur while the application is running.
-
Tracing
Also known as distributed tracing, it contains information on the start and end time of each sub-operation in the request, the parameters passed, the chain of calls between requests, the time taken by the request on each link, etc. Tracing can contain various information on message sending and receiving, database access, load balancing, etc., giving us insight into the execution of the request. tracing provides us with the ability to obtain information on how long the request took where the main consumption is, what the parameters of the request are, and if an exception has occurred, at which link the exception was generated, etc.
2. sample project
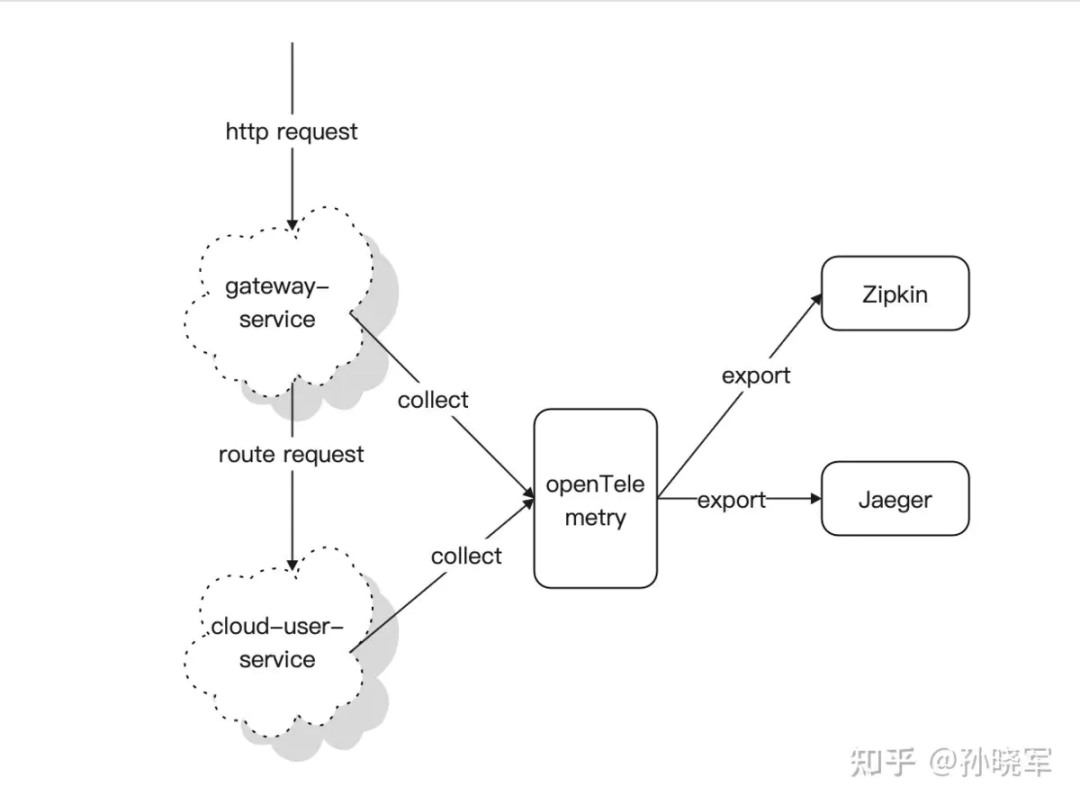
In this example, we build a simple microservice using spring cloud to experience how to use opentelemetry for system monitoring and to switch between two different monitoring systems (Zipkin, Jaeger) quickly. The project consists of 2 microservices, 2 visual monitoring systems and the use of opentelemetry to integrate the microservices and monitoring systems.
- gateway-service - service gateway built using spring cloud gateway
- cloud-user-service - user microservice, using spring boot + spring mvc
- Zipkin - the server side of the Zipkin monitoring system
- Jaeger - Jaeger monitoring system server
3. Using opentelemetry to integrate Zipkin
Versions of the components used in the example.
- java: 1.8
- spring-cloud: 2020.0.2
- spring-boot: 2.4.5
- opentelemetry: 1.1.0
- grpc: 1.36.1
3.1. cloud-user-service
Importing Spring cloud and opentelemetry.
 1
 2
 3
 4
 5
 6
 7
 8
 9
10
11
12
13
14
15
16
17
18
|
<dependencyManagement>
    <dependencies>
        <dependency>
            <groupId>org.springframework.cloud</groupId>
            <artifactId>spring-cloud-dependencies</artifactId>
            <version>${spring-cloud.version}</version>
            <type>pom</type>
            <scope>import</scope>
        </dependency>
        <dependency>
            <groupId>io.opentelemetry</groupId>
            <artifactId>opentelemetry-bom</artifactId>
            <version>${opentelemetry.version}</version>
            <type>pom</type>
            <scope>import</scope>
        </dependency>
    </dependencies>
</dependencyManagement>
|
Importing opentelemetry dependencies.
 1
 2
 3
 4
 5
 6
 7
 8
 9
10
11
12
13
14
15
16
17
18
19
20
21
22
23
24
25
26
27
28
29
30
31
|
<dependency>
    <groupId>io.opentelemetry</groupId>
    <artifactId>opentelemetry-api</artifactId>
</dependency>
<dependency>
    <groupId>io.opentelemetry</groupId>
    <artifactId>opentelemetry-sdk</artifactId>
</dependency>
<dependency>
    <groupId>io.opentelemetry</groupId>
    <artifactId>opentelemetry-exporter-otlp</artifactId>
</dependency>
<dependency>
    <groupId>io.opentelemetry</groupId>
    <artifactId>opentelemetry-semconv</artifactId>
    <version>1.1.0-alpha</version>
</dependency>
<dependency>
    <groupId>io.grpc</groupId>
    <artifactId>grpc-protobuf</artifactId>
    <version>${grpc.version}</version>
</dependency>
<dependency>
    <groupId>io.grpc</groupId>
    <artifactId>grpc-netty-shaded</artifactId>
    <version>${grpc.version}</version>
</dependency>
<dependency>
    <groupId>io.opentelemetry</groupId>
    <artifactId>opentelemetry-exporter-zipkin</artifactId>
</dependency>
|
3.2. Configuring opentelemetry
 1
 2
 3
 4
 5
 6
 7
 8
 9
10
11
12
13
14
15
16
17
18
19
20
21
22
23
24
25
26
27
28
29
30
31
32
33
34
35
36
37
38
39
40
41
|
@Configuration
public class TraceConfig {
    private static final String ENDPOINT_V2_SPANS = "/api/v2/spans";
    private final AppConfig appConfig;

    @Autowired
    public TraceConfig(AppConfig appConfig) {
        this.appConfig = appConfig;
    }

    @Bean
    public OpenTelemetry openTelemetry() {
        SpanProcessor spanProcessor = getOtlpProcessor();
        Resource serviceNameResource = Resource.create(Attributes.of(ResourceAttributes.SERVICE_NAME, appConfig.getApplicationName()));

        // Set to process the spans by the Zipkin Exporter
        SdkTracerProvider tracerProvider =
                SdkTracerProvider.builder()
                        .addSpanProcessor(spanProcessor)
                        .setResource(Resource.getDefault().merge(serviceNameResource))
                        .build();
        OpenTelemetrySdk openTelemetry =
                OpenTelemetrySdk.builder().setTracerProvider(tracerProvider)
                        .setPropagators(ContextPropagators.create(W3CTraceContextPropagator.getInstance()))
                        .buildAndRegisterGlobal();

        // add a shutdown hook to shut down the SDK
        Runtime.getRuntime().addShutdownHook(new Thread(tracerProvider::close));

        // return the configured instance so it can be used for instrumentation.
        return openTelemetry;
    }

    private SpanProcessor getZipkinProcessor() {
        String host = "localhost";
        int port = 9411;
        String httpUrl = String.format("http://%s:%s", host, port);
        ZipkinSpanExporter zipkinExporter = ZipkinSpanExporter.builder().setEndpoint(httpUrl + ENDPOINT_V2_SPANS).build();
        return SimpleSpanProcessor.create(zipkinExporter);
    }
}
|
3.3. Using opentelemetry in cloud-user-services
Once we have completed the configuration, we can use opentelemetry in our spring boot project via autowired.
Next we customize a WebFilter to intercept all Http requests and perform event tracking in the Filter class.
 1
 2
 3
 4
 5
 6
 7
 8
 9
10
11
12
13
14
15
16
17
18
19
20
21
22
23
24
25
26
27
28
29
30
31
32
33
34
35
36
37
38
39
40
41
42
43
44
45
46
47
48
49
50
|
@Component
public class TracingFilter implements Filter {
    private final AppConfig appConfig;
    private final OpenTelemetry openTelemetry;

    @Autowired
    public TracingFilter(AppConfig appConfig, OpenTelemetry openTelemetry) {
        this.appConfig = appConfig;
        this.openTelemetry = openTelemetry;
    }

    @Override
    public void doFilter(ServletRequest servletRequest, ServletResponse servletResponse, FilterChain filterChain) throws IOException, ServletException {
        HttpServletRequest httpServletRequest = (HttpServletRequest)servletRequest;
        Span span = getServerSpan(openTelemetry.getTracer(appConfig.getApplicationName()), httpServletRequest);
        try (Scope scope = span.makeCurrent()) {
            filterChain.doFilter(servletRequest, servletResponse);
        } catch (Exception ex) {
            span.setStatus(StatusCode.ERROR, "HTTP Code: " + ((HttpServletResponse)servletResponse).getStatus());
            span.recordException(ex);
            throw ex;
        } finally {
            span.end();
        }
    }

    private Span getServerSpan(Tracer tracer, HttpServletRequest httpServletRequest) {

        TextMapPropagator textMapPropagator = openTelemetry.getPropagators().getTextMapPropagator();
        Context context = textMapPropagator.extract(Context.current(), httpServletRequest, new TextMapGetter<HttpServletRequest>() {
            @Override
            public Iterable<String> keys(HttpServletRequest request) {
                List<String> headers = new ArrayList();
                for (Enumeration names = request.getHeaderNames(); names.hasMoreElements();) {
                    String name = (String)names.nextElement();
                    headers.add(name);
                }
                return headers;
            }

            @Override
            public String get(HttpServletRequest request, String s) {
                return request.getHeader(s);
            }
        });


        return tracer.spanBuilder(httpServletRequest.getRequestURI()).setParent(context).setSpanKind(SpanKind.SERVER).setAttribute(SemanticAttributes.HTTP_METHOD, httpServletRequest.getMethod()).startSpan();
    }
}
|
In the sample code we have implemented an anonymous class to parse the tracing context information from the HttpServletRequest.
While creating the Span, we write some key properties of the Http request in the Span and make a tracing record for all exceptions.
3.4. Writing the service code
Next we run through a simple piece of code to simulate querying a user and throwing an exception.
1
2
3
4
5
6
7
|
@GetMapping("/{id}")
public ResponseEntity<User> get(@PathVariable("id") Long id) {
    if (0 >= id) {
        throw new IllegalArgumentException("Illegal argument value");
    }
    return ResponseEntity.ok(userService.get(id));
}
|
3.5. Configuring gateway-service
We configure the gateway-service using the same configuration as cloud-user-service.
3.6. Integrating opentelemetry in the gateway-service
Here it is a bit different from cloud-user-service, as gateway-service is built on webflux. This time we use WebFilter and GlobalFilter to intercept http requests from the gateway.
In the WebFilter, add opentelemetry to log incoming http requests.
 1
 2
 3
 4
 5
 6
 7
 8
 9
10
11
12
13
14
15
16
17
18
19
20
|
@Override
public Mono<Void> filter(ServerWebExchange serverWebExchange, WebFilterChain webFilterChain) {
    ServerHttpRequest serverHttpRequest = serverWebExchange.getRequest();
    Span span = getServerSpan(openTelemetry.getTracer(appConfig.getApplicationName()), serverHttpRequest);
    Scope scope = span.makeCurrent();

    serverWebExchange.getResponse().getHeaders().add("traceId", span.getSpanContext().getTraceId());
    span.setAttribute("params", serverHttpRequest.getQueryParams().toString());

    return webFilterChain.filter(serverWebExchange)
            .doFinally((signalType) -> {
                scope.close();
                span.end();
            })
            .doOnError(span::recordException);
}

private Span getServerSpan(Tracer tracer, ServerHttpRequest serverHttpRequest) {
    return tracer.spanBuilder(serverHttpRequest.getPath().toString()).setNoParent().setSpanKind(SpanKind.SERVER).setAttribute(SemanticAttributes.HTTP_METHOD, serverHttpRequest.getMethod().name()).startSpan();
}
|
Next, in the GlobalFilter, record the http requests that are routed to the microservice.
 1
 2
 3
 4
 5
 6
 7
 8
 9
10
11
12
13
14
15
16
17
18
19
20
21
22
23
24
25
26
27
28
|
@Override
public Mono<Void> filter(ServerWebExchange exchange, GatewayFilterChain gatewayFilterChain) {
    Span span = getClientSpan(openTelemetry.getTracer(appConfig.getApplicationName()), exchange);
    Scope scope = span.makeCurrent();
    inject(exchange);
    return gatewayFilterChain.filter(exchange)
            .then(Mono.fromRunnable(() -> {
                        scope.close();
                        span.end();
                    })
            );
}

private void inject(ServerWebExchange serverWebExchange) {
    HttpHeaders httpHeaders = new HttpHeaders();
    TextMapPropagator textMapPropagator = openTelemetry.getPropagators().getTextMapPropagator();
    textMapPropagator.inject(Context.current(), httpHeaders, HttpHeaders::add);
    ServerHttpRequest request = serverWebExchange.getRequest().mutate()
            .headers(headers -> headers.addAll(httpHeaders))
            .build();
    serverWebExchange.mutate().request(request).build();
}

private Span getClientSpan(Tracer tracer, ServerWebExchange serverWebExchange) {
    ServerHttpRequest serverHttpRequest = serverWebExchange.getRequest();
    URI routeUri = serverWebExchange.getAttribute(ServerWebExchangeUtils.GATEWAY_REQUEST_URL_ATTR);
    return tracer.spanBuilder(routeUri.getPath()).setSpanKind(SpanKind.CLIENT).setAttribute(SemanticAttributes.HTTP_METHOD, serverHttpRequest.getMethod().name()).startSpan();
}
|
In order to pass the tracing context information, we need to call the inject method and write the tracing context information into the headers of the routing request.
4. Running the service
Now, let’s visit the gateway http://localhost:8080/user/0 to observe Zipkin’s logging of service accesses and exceptions.
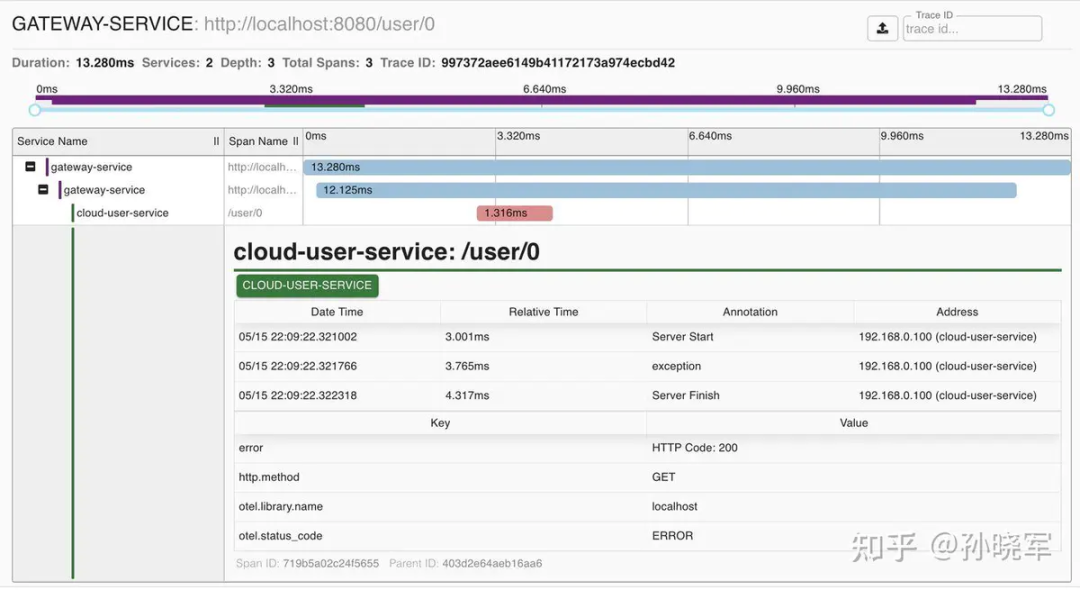
You can see that Zikin does a good job overall in terms of Tracing, and links with exceptions are marked in red.
Zipkin does not print out the stack of exceptions, so we need to do extra work on this.
5. Use Jaeger to dock opentelemetry
Use the otlp exporter to replace the zipkin exporter previously used.
1
2
3
4
|
<dependency>
    <groupId>io.opentelemetry</groupId>
    <artifactId>opentelemetry-exporter-otlp</artifactId>
</dependency>
|
In the configuration class, use the otlp processor to replace the previous zipkin processor. this completes the switch from Zipkin to Jaeger.
1
2
3
4
5
6
|
private SpanProcessor getOtlpProcessor(){
    OtlpGrpcSpanExporter spanExporter = OtlpGrpcSpanExporter.builder().setTimeout(2, TimeUnit.SECONDS).build();
    return BatchSpanProcessor.builder(spanExporter)
            .setScheduleDelay(100, TimeUnit.MILLISECONDS)
            .build();
}
|
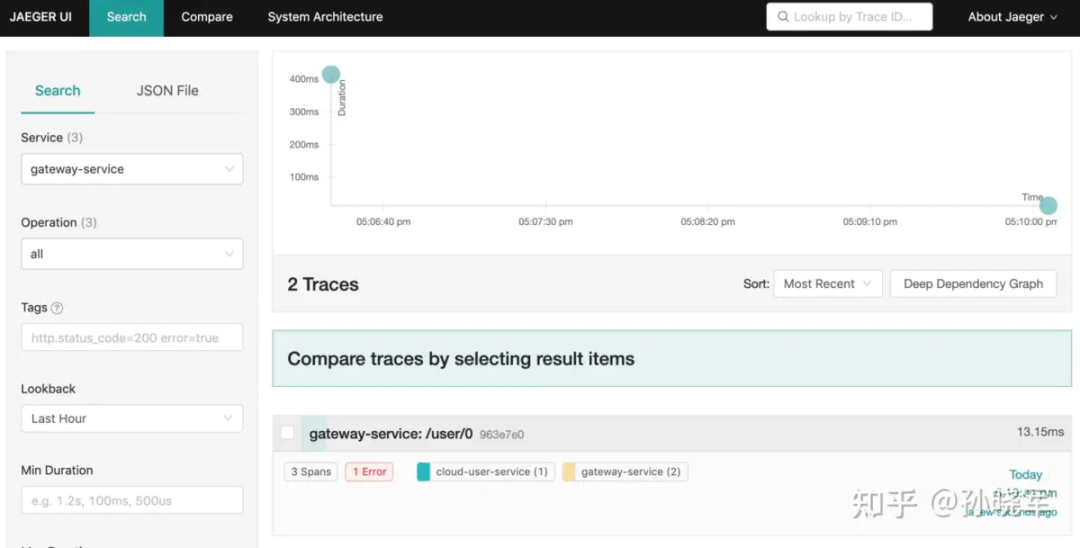
6. Run the service again
We run the service again and access the gateway http://localhost:8080/user/0 to see what Jaeger is logging about service accesses and exceptions.
Looking first at the main screen, Jaeger directly marks the request as containing an exception.
Looking at the details of the access again, Jaeger records and displays the stack information of the exception. This is very helpful when analysing exceptions for our online applications.
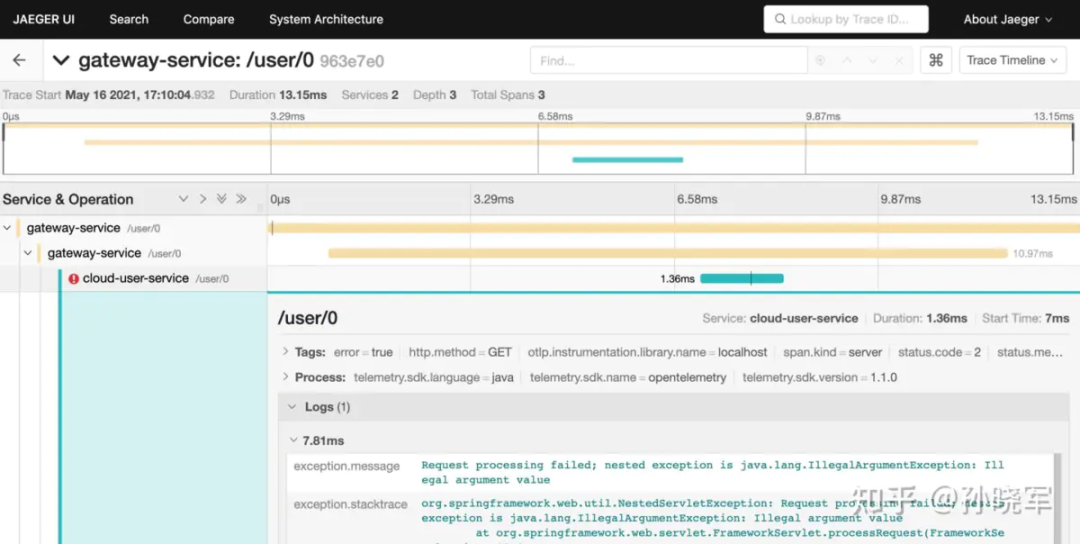
Compared to Zipkin, Jaeger offers a richer feature set and a more aesthetically pleasing visual interface.
7. Summary
This article has described the use of opentelemetry to build a monitoring system and how it can be integrated into Zipkin and Jaeger.
Using opentelemetry’s standardisation capabilities, we can easily record more detailed link monitoring information.
Since its launch, opentelemetry has received more and more attention and support from vendors. Let’s wait and see if opentelemetry will become the ultimate de facto standard for this new thing in distributed monitoring systems.