This article is mainly to organize how Prometheus’ time series database stores and manages the data, I hope this article can bring you some inspiration.
Overview
Let’s take a look at the entire architecture of Prometheus.
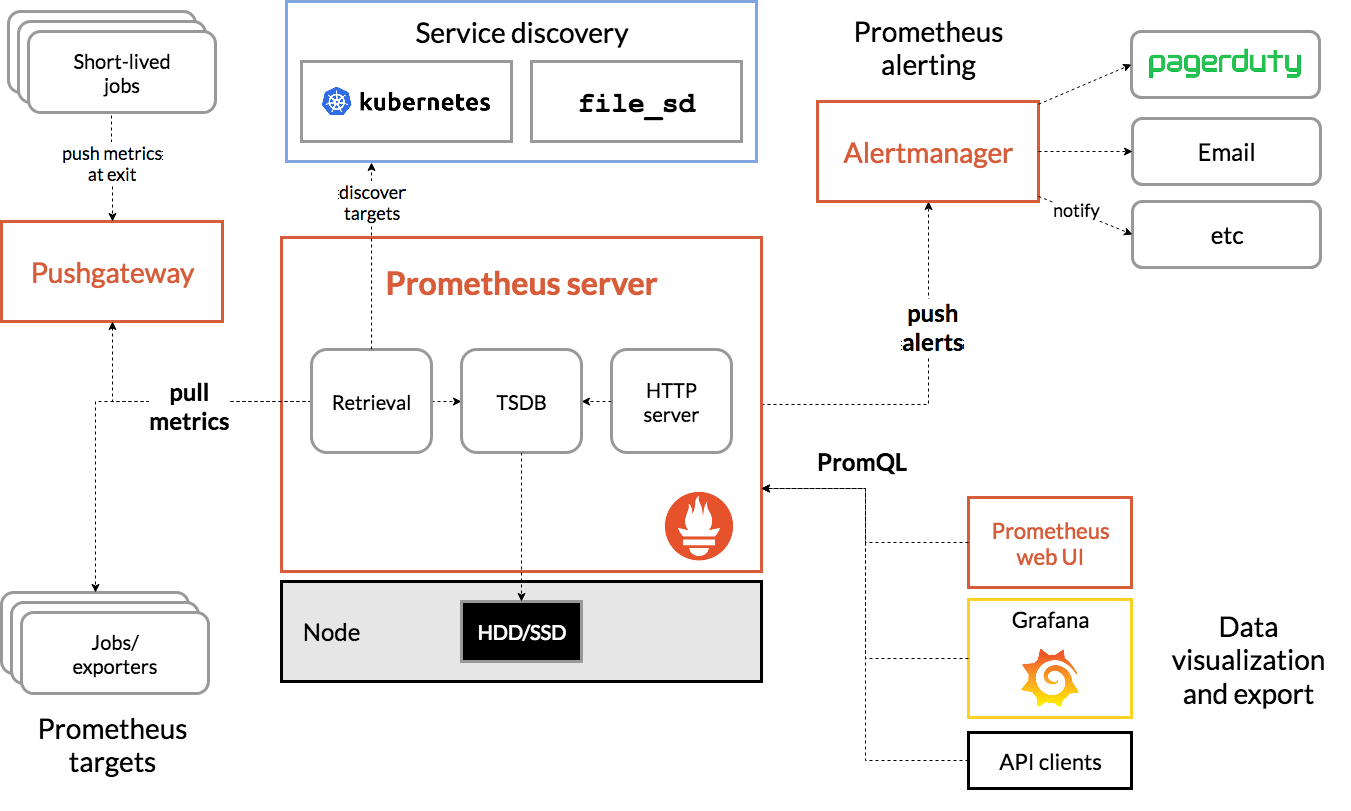
For Prometheus Server, the entire data processing process is divided into three parts: Exporter metrics collection, Scraper data capture, TSDB data storage and query; Exporter in fact, different services have different collection implementations, similar to Mysqld-exporter, node exporter, etc. We do not read too much here, you basically just need to know that it will expose a port, and Scraper will collect from it at regular intervals. The Scraper data collection part will be explained in detail below.
Let’s first understand what is Time Series Database (TSDB). TSDB is specially designed to store data that changes over time, such as stock prices, sensor data, etc. A time-series is the history of a variable over time, while a sample is the instantaneous value of the variable in the history.
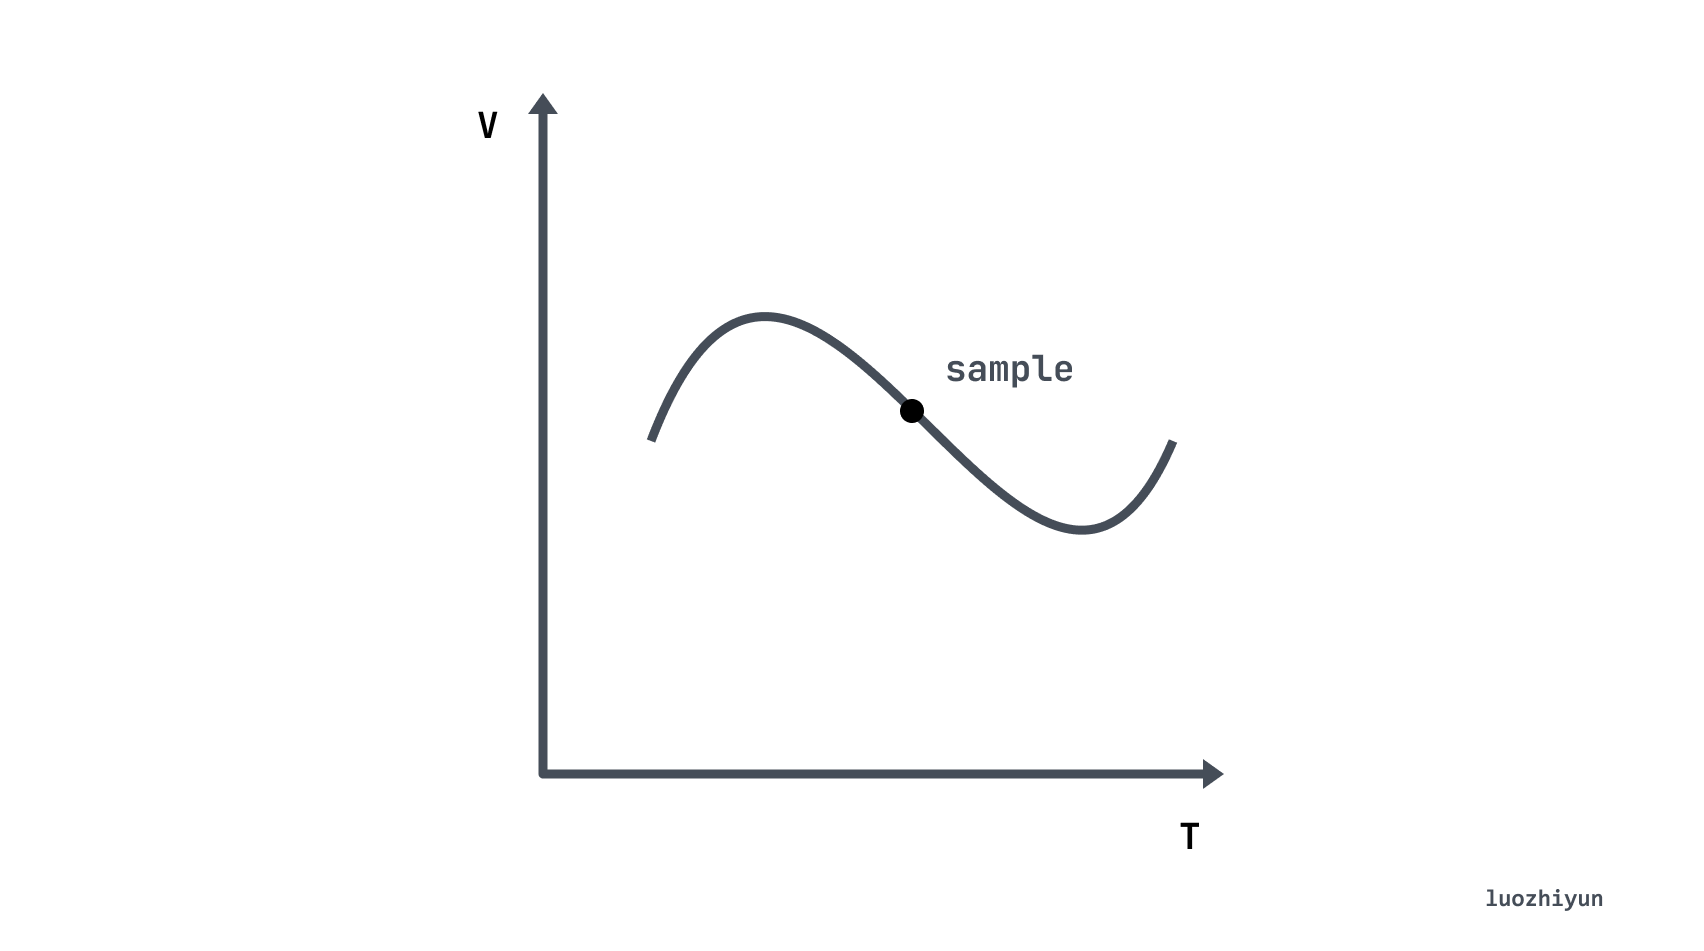
Back to our main character, Prometheus, it stores all the collected sample data as time-series in an in-memory database and saves them to the hard disk at regular intervals. Time series are stored in sequential order of timestamps and values, and each time-series is named by a metrics name and a set of labelset. As shown below, a time-series can be understood as a matrix of numbers with time as the Y-axis.
So according to the above diagram, we can understand that each point is called a sample (sample), and the sample consists of three parts as follows.
- metric name: metric name and description of the current sample special. For example, the node_cpu above indicates the CPU information of the node.
- timestamp: a timestamp accurate to milliseconds, indicating the time of data recording.
- Lables: makes the same time series with different dimensions of identification, e.g.
node_cpu{cpu="cpu0",mode="idle"}denotes all information with cpu0 status as idle, or a new metric when mode is equal to system. - value: a float64 floating-point data representing the value of the current sample, which is the Y-axis in the above figure.
TSDB data writing
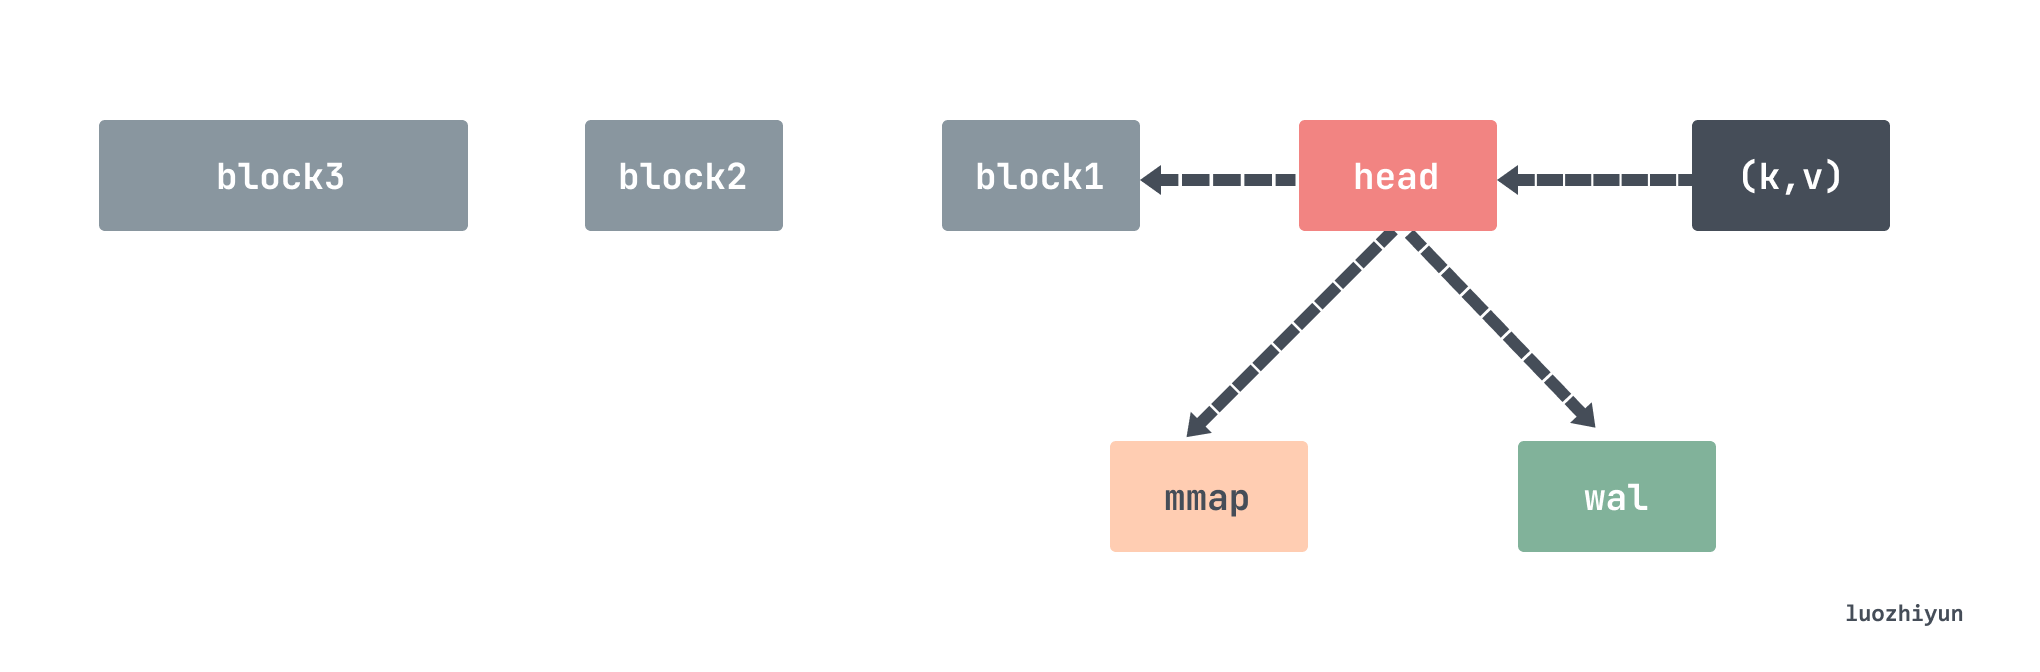
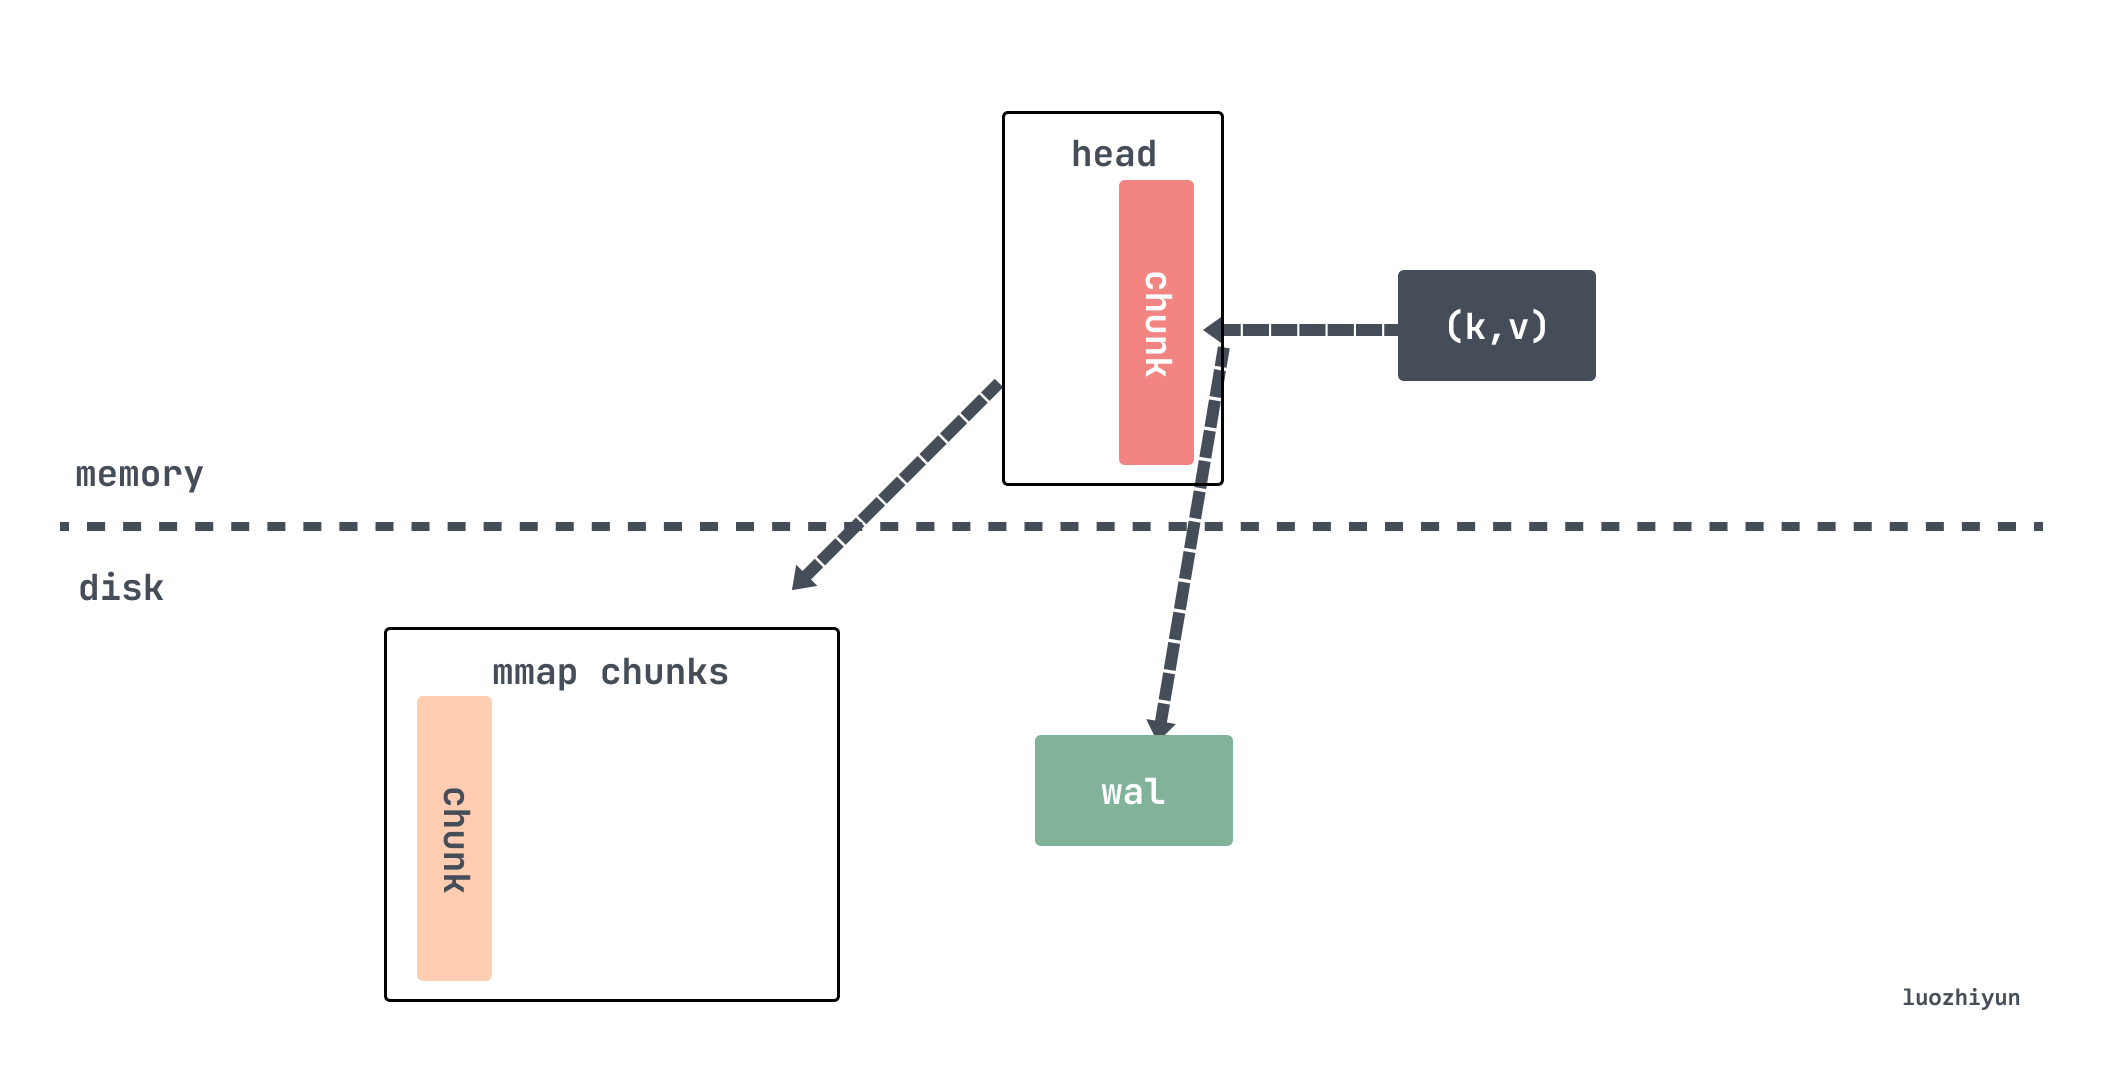
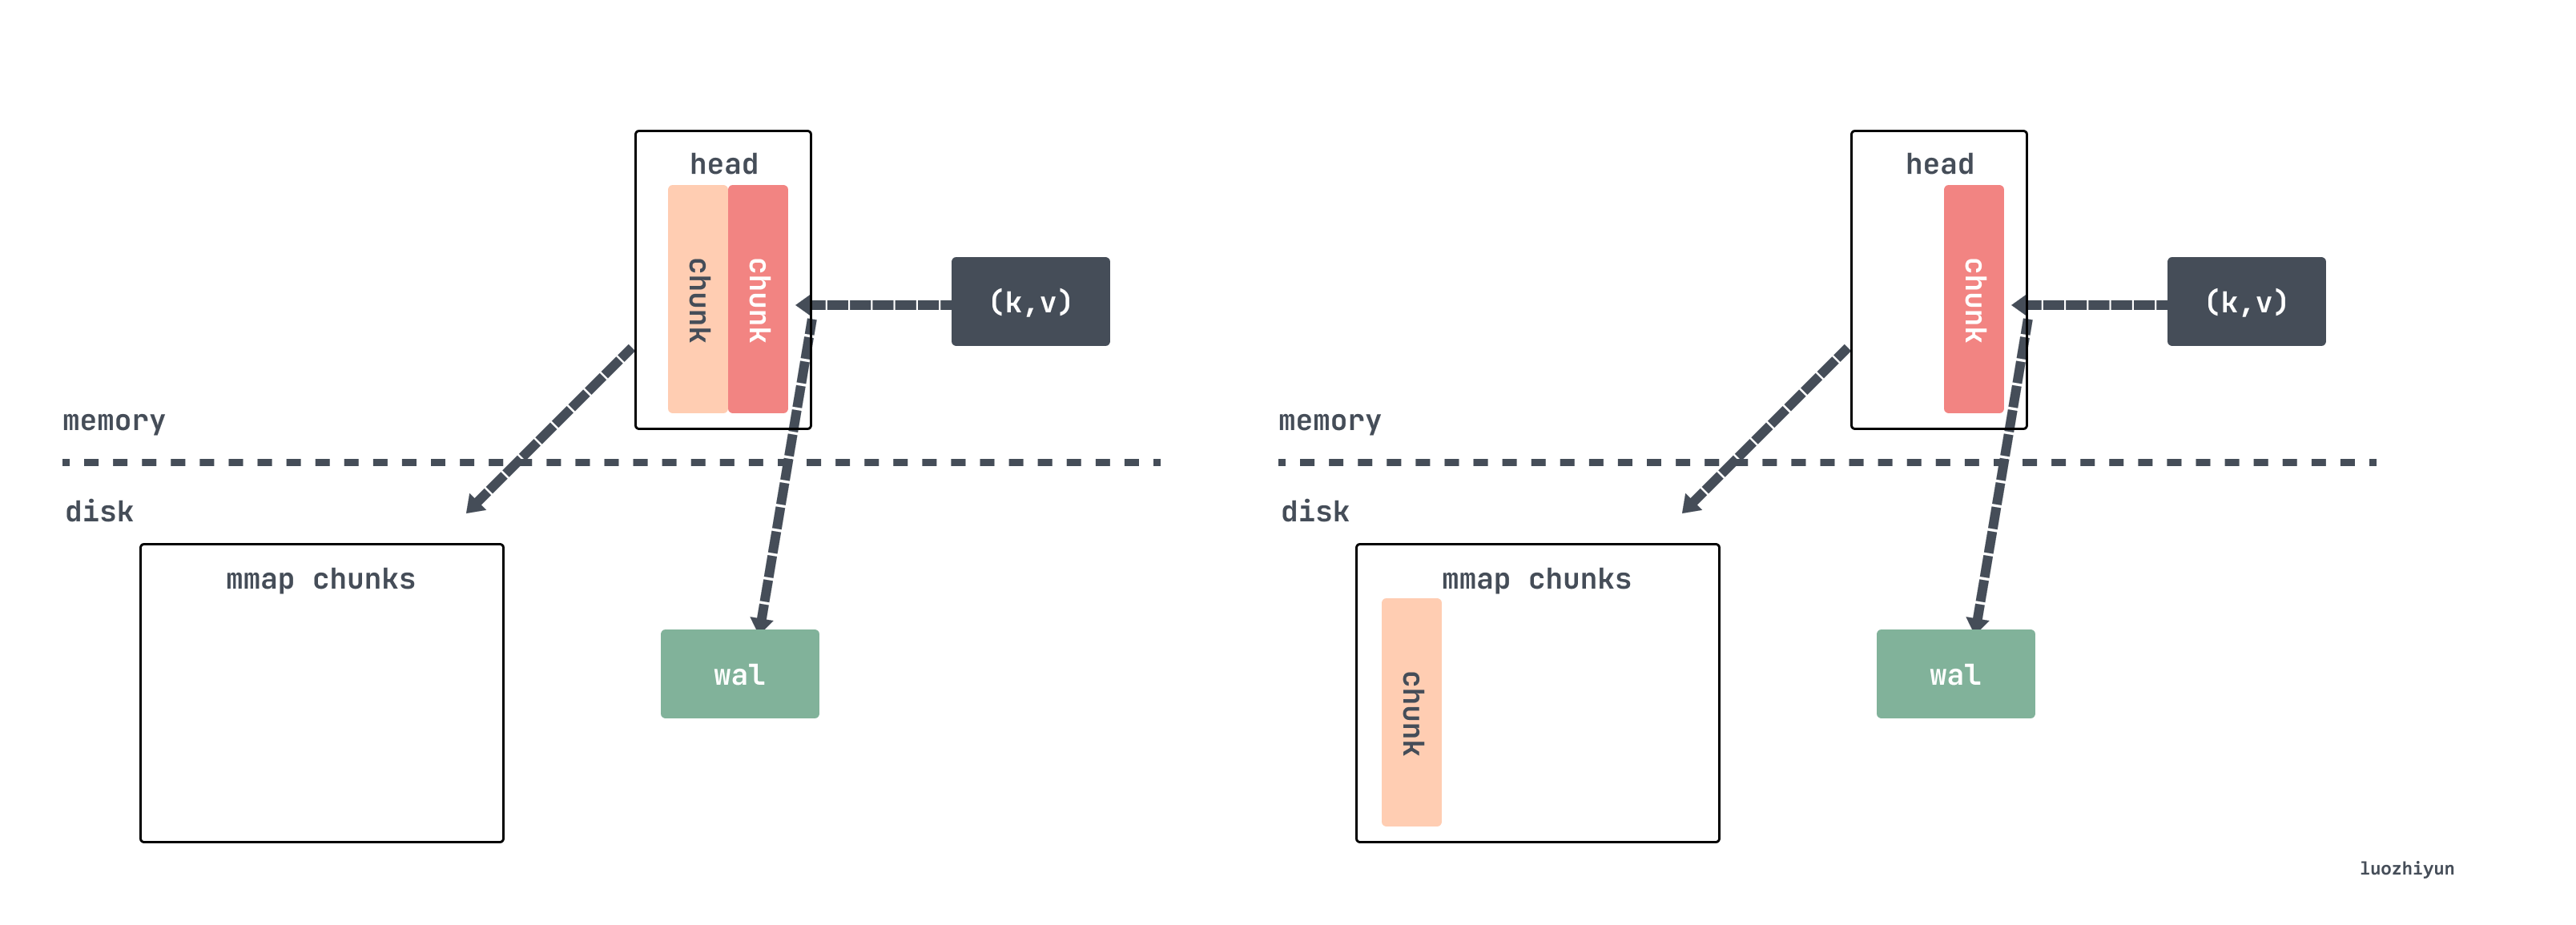
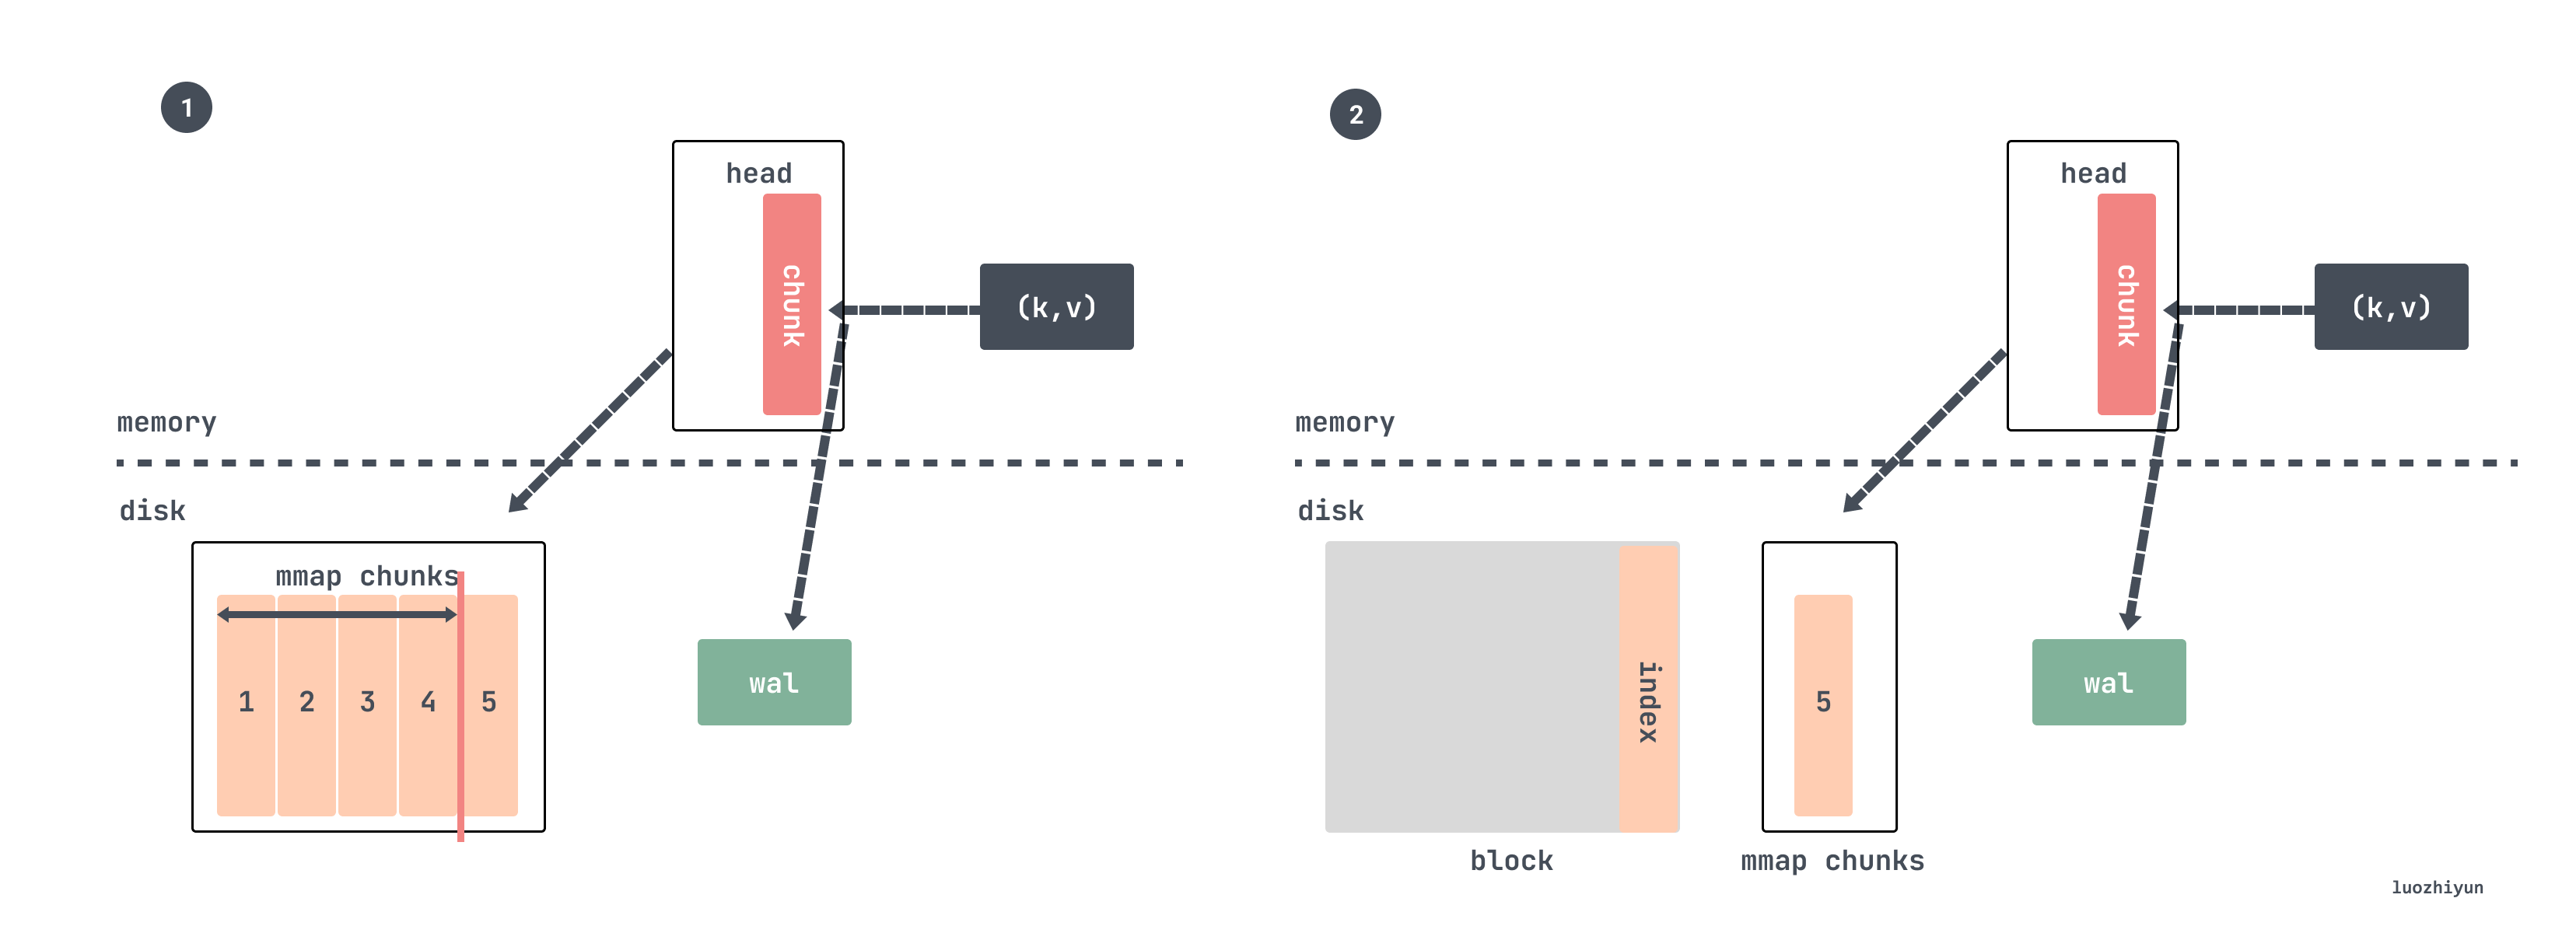
TSDB for Prometheus is first written to the head data block and the WAL (Write-Ahead-Log). head data block is located in memory, and the WAL log is used for temporary persistence of data to prevent recovery of data in memory after power down and reboot. head memory data is written for a period of time and then flushed to disk as a data chunk via mmap, and only the reference to the chunk remains in memory. When the amount of chunks persisted to disk reaches a certain threshold, the old data will be stripped out of the chunks and turned into block data. Older chunks are periodically combined into a larger chunk until the chunk reaches a threshold retention time and is deleted.
By default, all data is placed in the . /data directory, which holds data of chunks_head, wal, and block types.
Each block stores all series metrics data within a 2-hour time window. Each block file name is generated using the library github.com/oklog/ulid, which contains metadata files, index files, chunks folders, all metrics data are stored in chunks folders, chunks contain multiple data segments, each data segment is divided into one file according to 512MB, deleted data is stored in tombstone folder The deleted data is stored in the tombstone folder.
The chunks_head folder also contains multiple chunks. When the memory head block is no longer writable, the data is stored under this folder and references to the files are retained.
The wal folder contains data that is currently being written, and contains multiple data segment files, with a default maximum of 128M, Prometheus will keep at least 3 files, and for high load machines will keep at least 2 hours of data. wal folder is uncompressed, so it will be slightly larger than the data in the block.
head block
Prior to v2.19, the last 2 hours of indicator data was stored in memory. v2.19 introduces the head block, which stores the most recent indicator data in memory, flushes the data to disk when memory is full, and associates the data flushed to disk with a reference.
The head block is the only active block, except for it, all other blocks are immutable. As we said above, every time data is crawled from scraper, it will be stored in appender. This appender is actually the headAppender, which temporarily caches the data by calling the Append method, and then adds it in bulk by appender before committing it.
|
|
All metrics data are stored in stripeseries, and each time lset (which is equivalent to the key of the metric) is needed to get the corresponding memSeries. getByID is synchronized according to the incoming lset dimension, and lock conflicts are reduced by means of segmented locks. memSeries is where the real data is stored. It holds the (t, v) key-value pairs corresponding to the most recently added metrics. So here we just set the association between sampleSeries and samples, and the corresponding data will be taken out and added to memSeries when the following Commit is done.
|
|
The Commit method takes the data stored in the samples. The data is then cyclically written by calling memSeries append.
|
|
When writing, we check if the current chunk is full with 120 samples, and if it is full, then we need to write the old data from the head chunk to the disk via mmap. If you set the fetch interval to 15s, the span of 120 samples is 30 minutes.
|
|
The above time calculation is very interesting, when writing the head chunk, it will check whether the number of writes has reached 1/4, if so, it will call computeChunkEndTime function to calculate the average write rate based on 1/4 of the written data, calculate when the 120 samples will be written, and then return the time as the chunk cutting time.
Here, it does not directly determine whether the number of writes reaches samplesPerChunk to cut, but by time, which has a lot of flexibility. If the data is suddenly written slowly, the number of chunk is less than 120 samples will be cut, and if it is written quickly, the number of samples in the chunk will be more than 120, but not more than 2 times the samplesPerChunk.
Of course, there is a size limit when writing the head chunk, and the size is also 128M for one file to write.
If it is determined that the chunk should be cut, the cutNewHeadChunk method is called to write the old data to disk via mmap, and then a new head chunk is created for the memSeries, retaining only the reference to the old data.
Now assume that the data is continuously written, and after a while the mmap mapped chunk is compressed and persisted as a block.
tsdb runs a goroutine in the background during initialization to check every minute if chuan’s chunkRange span is greater than chunkRange*3/2.
The Compact method is checked against calls to the compactable method.
The default value of chunkRange is DefaultBlockDuration of 2 hours.
|
|
That is, we check whether the time span of the currently written data exceeds 3 hours, and if it exceeds that, data compression will be performed. We assume that the setting is crawled every 15s, and a chunk written is 120 samples, which is 30 minutes, so every 3 hours 6 chunks will be compressed and a block will be generated.
Then the compression is done by picking the last 2 hours of metrics data, and the specific code is also quite clever, it is by getting the smallest data time in the head and then rounding up 2 hours to get a time return.
So for our example above it takes 30 minutes to write a full chunk, so compressing two hours of data is exactly 4 chunks.
According to the benchmark results of the article “New in Prometheus v2.19.0: Memory-mapping of full chunks of the head block reduces memory usage by as much as 40%”, eliminating a portion of the head block and keeping only 120 samples saves about 40% of memory usage, and this portion of memory no longer needs to be reset from the WAL log after a reboot, resulting in a faster boot.
wal
wal is a log sequence used to record some database operations, each time before writing, modifying, deleting will first record one in the wal log. The main role is to use this log data to do recovery after the program is down, because as we said earlier, the chunk inside the head is not persistent.
The wal is stored in the wal folder in increasing sequence by serial number, each file is called a segment and is by default 128MB in size. prometheus calls such a file a Segment, which holds a backup of the series and sample data in memory.
It also contains a subdirectory prefixed with checkpoint. Since the time series data in memory is often persisted, the data in wal will also be redundant. So each time after persisting the in-memory data, the Segment needs to be cleaned up as well. However, some of the data in the deleted Segment may still be useful, so we will remove the data that is definitely invalid when cleaning up, and store the remaining data in the checkpoint. When Prometheus restarts, the contents of the checkpoint should be loaded first, and then the contents of each Segment should be loaded in order.
The directory structure of the files on the disk looks as follows.
During cleanup, 2/3 of the segments are selected for deletion.
So let’s say there are now 5 segments.
Then the files 000000 000001 000002 000003 will be deleted. But these records can not be deleted directly, for example, the series record will only be written once, so you need to find it, and some samples do not need to be deleted at the moment, you also need to find them, and then create checkpoint files and write them.
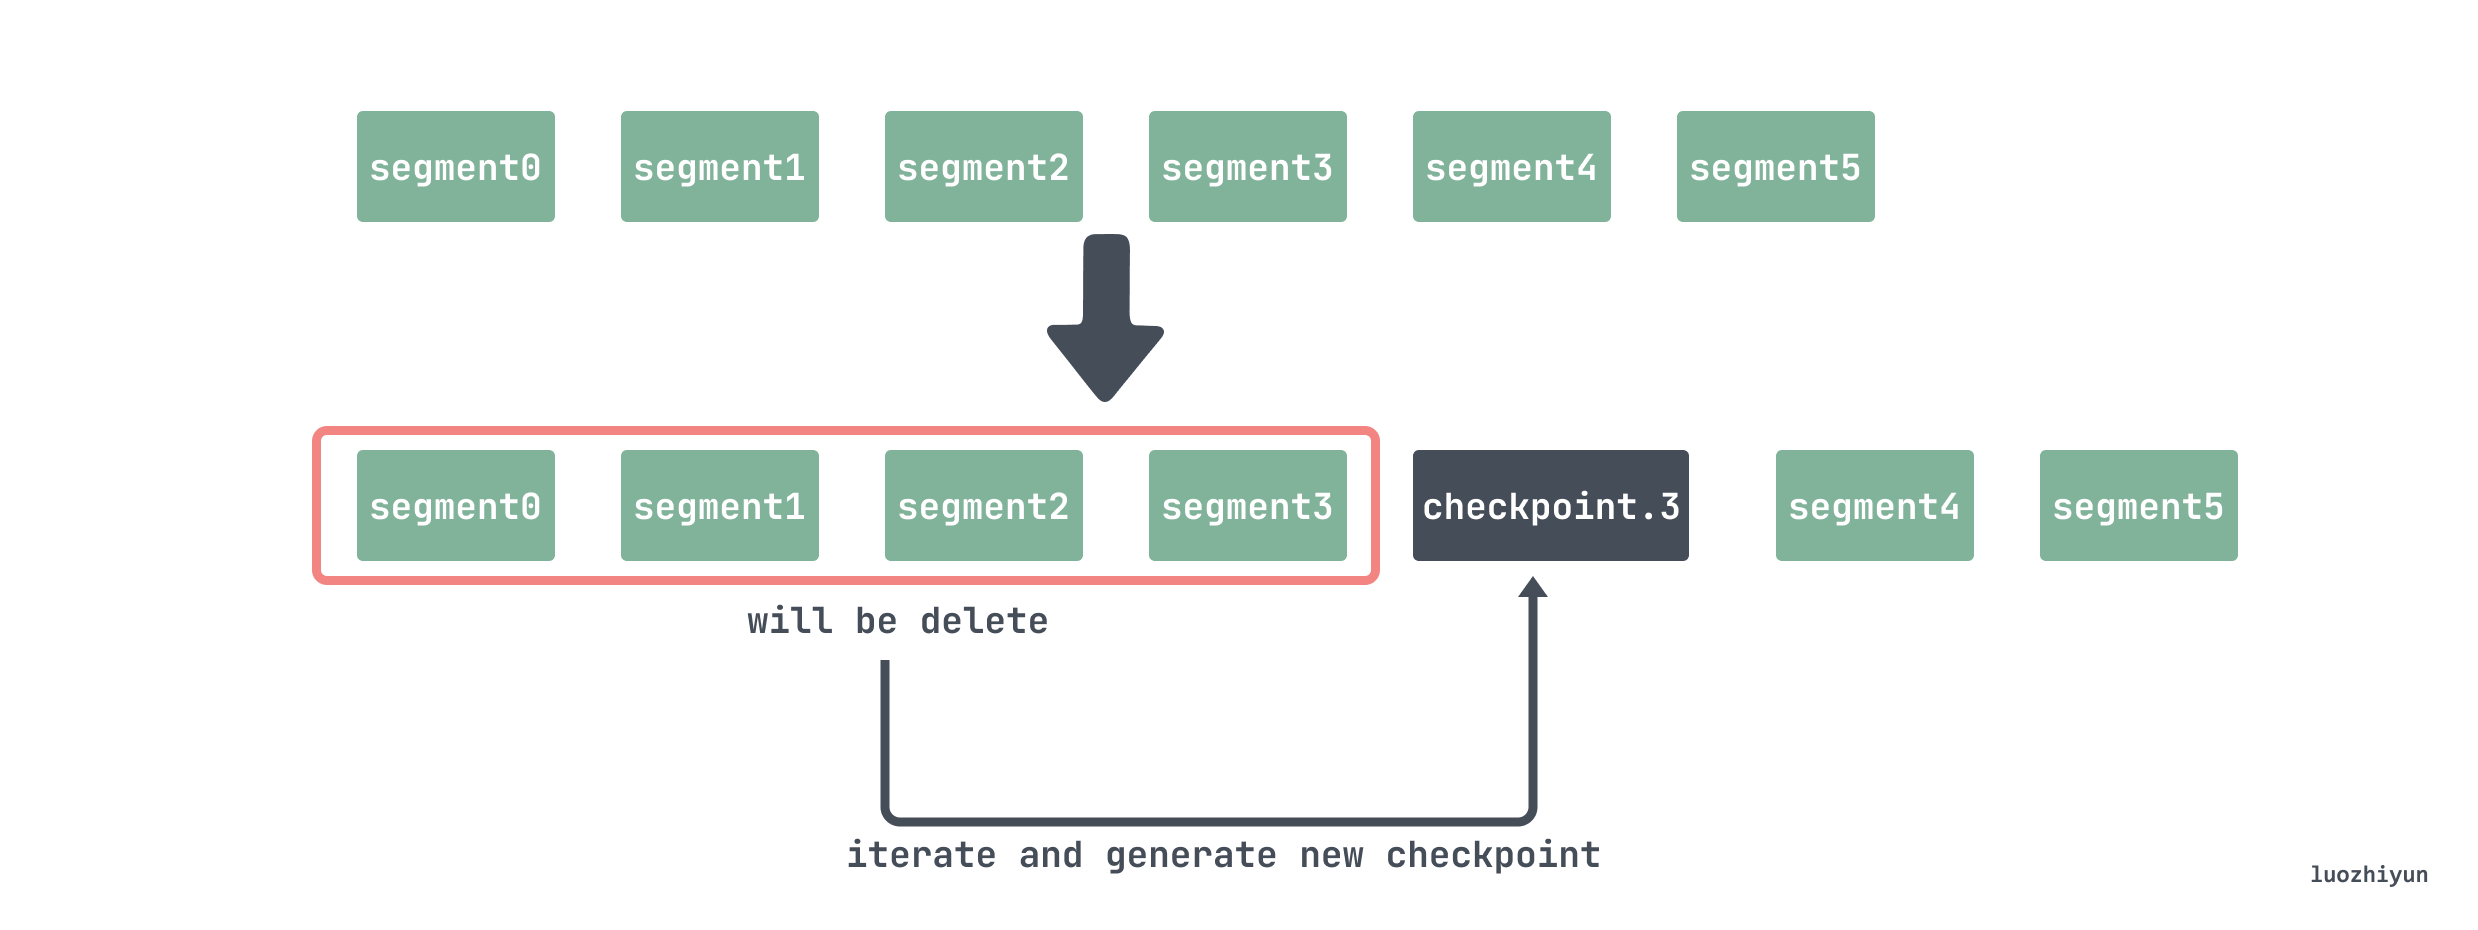
So when deleting, you need to iterate through the files 000000 000001 000002 000003 and delete the series that are no longer used in the head; because when deleting the segment, you pass in a time T, which means that the data before this point in time have been persisted into a block, so the wal does not need to be saved, so you need to delete the data recorded in the samples before the time T.
|
|
block
Each block is actually a small database that stores all the time series data within that time window, so it needs its own index and chunks. blocks are immutable except for the latest block that is receiving fresh data.
All data within a time period (default 2 hours), read-only, is named with ULID. Each block contains mainly the following.
- meta.json meta-information, which mainly includes the minTime/maxTime of the block, for easy filtering when querying.
- chunks is a subdirectory containing a number of files numbered from 000001 onwards, generally with an upper limit of 512M per file. the files store all samples within the time window [minTime, maxTime].
- tombstones are used to store the deletion records for the series. If a time series is deleted, Prometheus does not clean it up immediately, but makes a record in tombstones and waits until the next Block compression merge to clean it up.
- index index file, containing mainly information about inverted indexes.
index data lookup
Let’s now look at the overall data structure of index.
|
|
We present here some structures related to data query, the rest of the details can be seen here: index.
First is the TOC (Table Of Content), which stores information about the location of the remaining six parts, i.e. their starting position at the offset of the index file. The structure is as follows.
|
|
If we want to find the location of an index in a chunk, we can first look up the inverted index by using the above offsets. Since prometheus stores a lot of key/value data, we build a backward index in index for fast search, and store the data in Posting offset table and Posting.
The inverted index approach is organized as follows.
- first assign 1 id to each series, query the series with seriesId , which is a forward index with query time complexity = O(1).
- Construct an index of labels, if
seriesId={2,5,10,29}all containlabel: app='nginx', then forapp='nginx",{2,5,10,29}is its inverted index.
This way you can quickly find the corresponding seriesId.
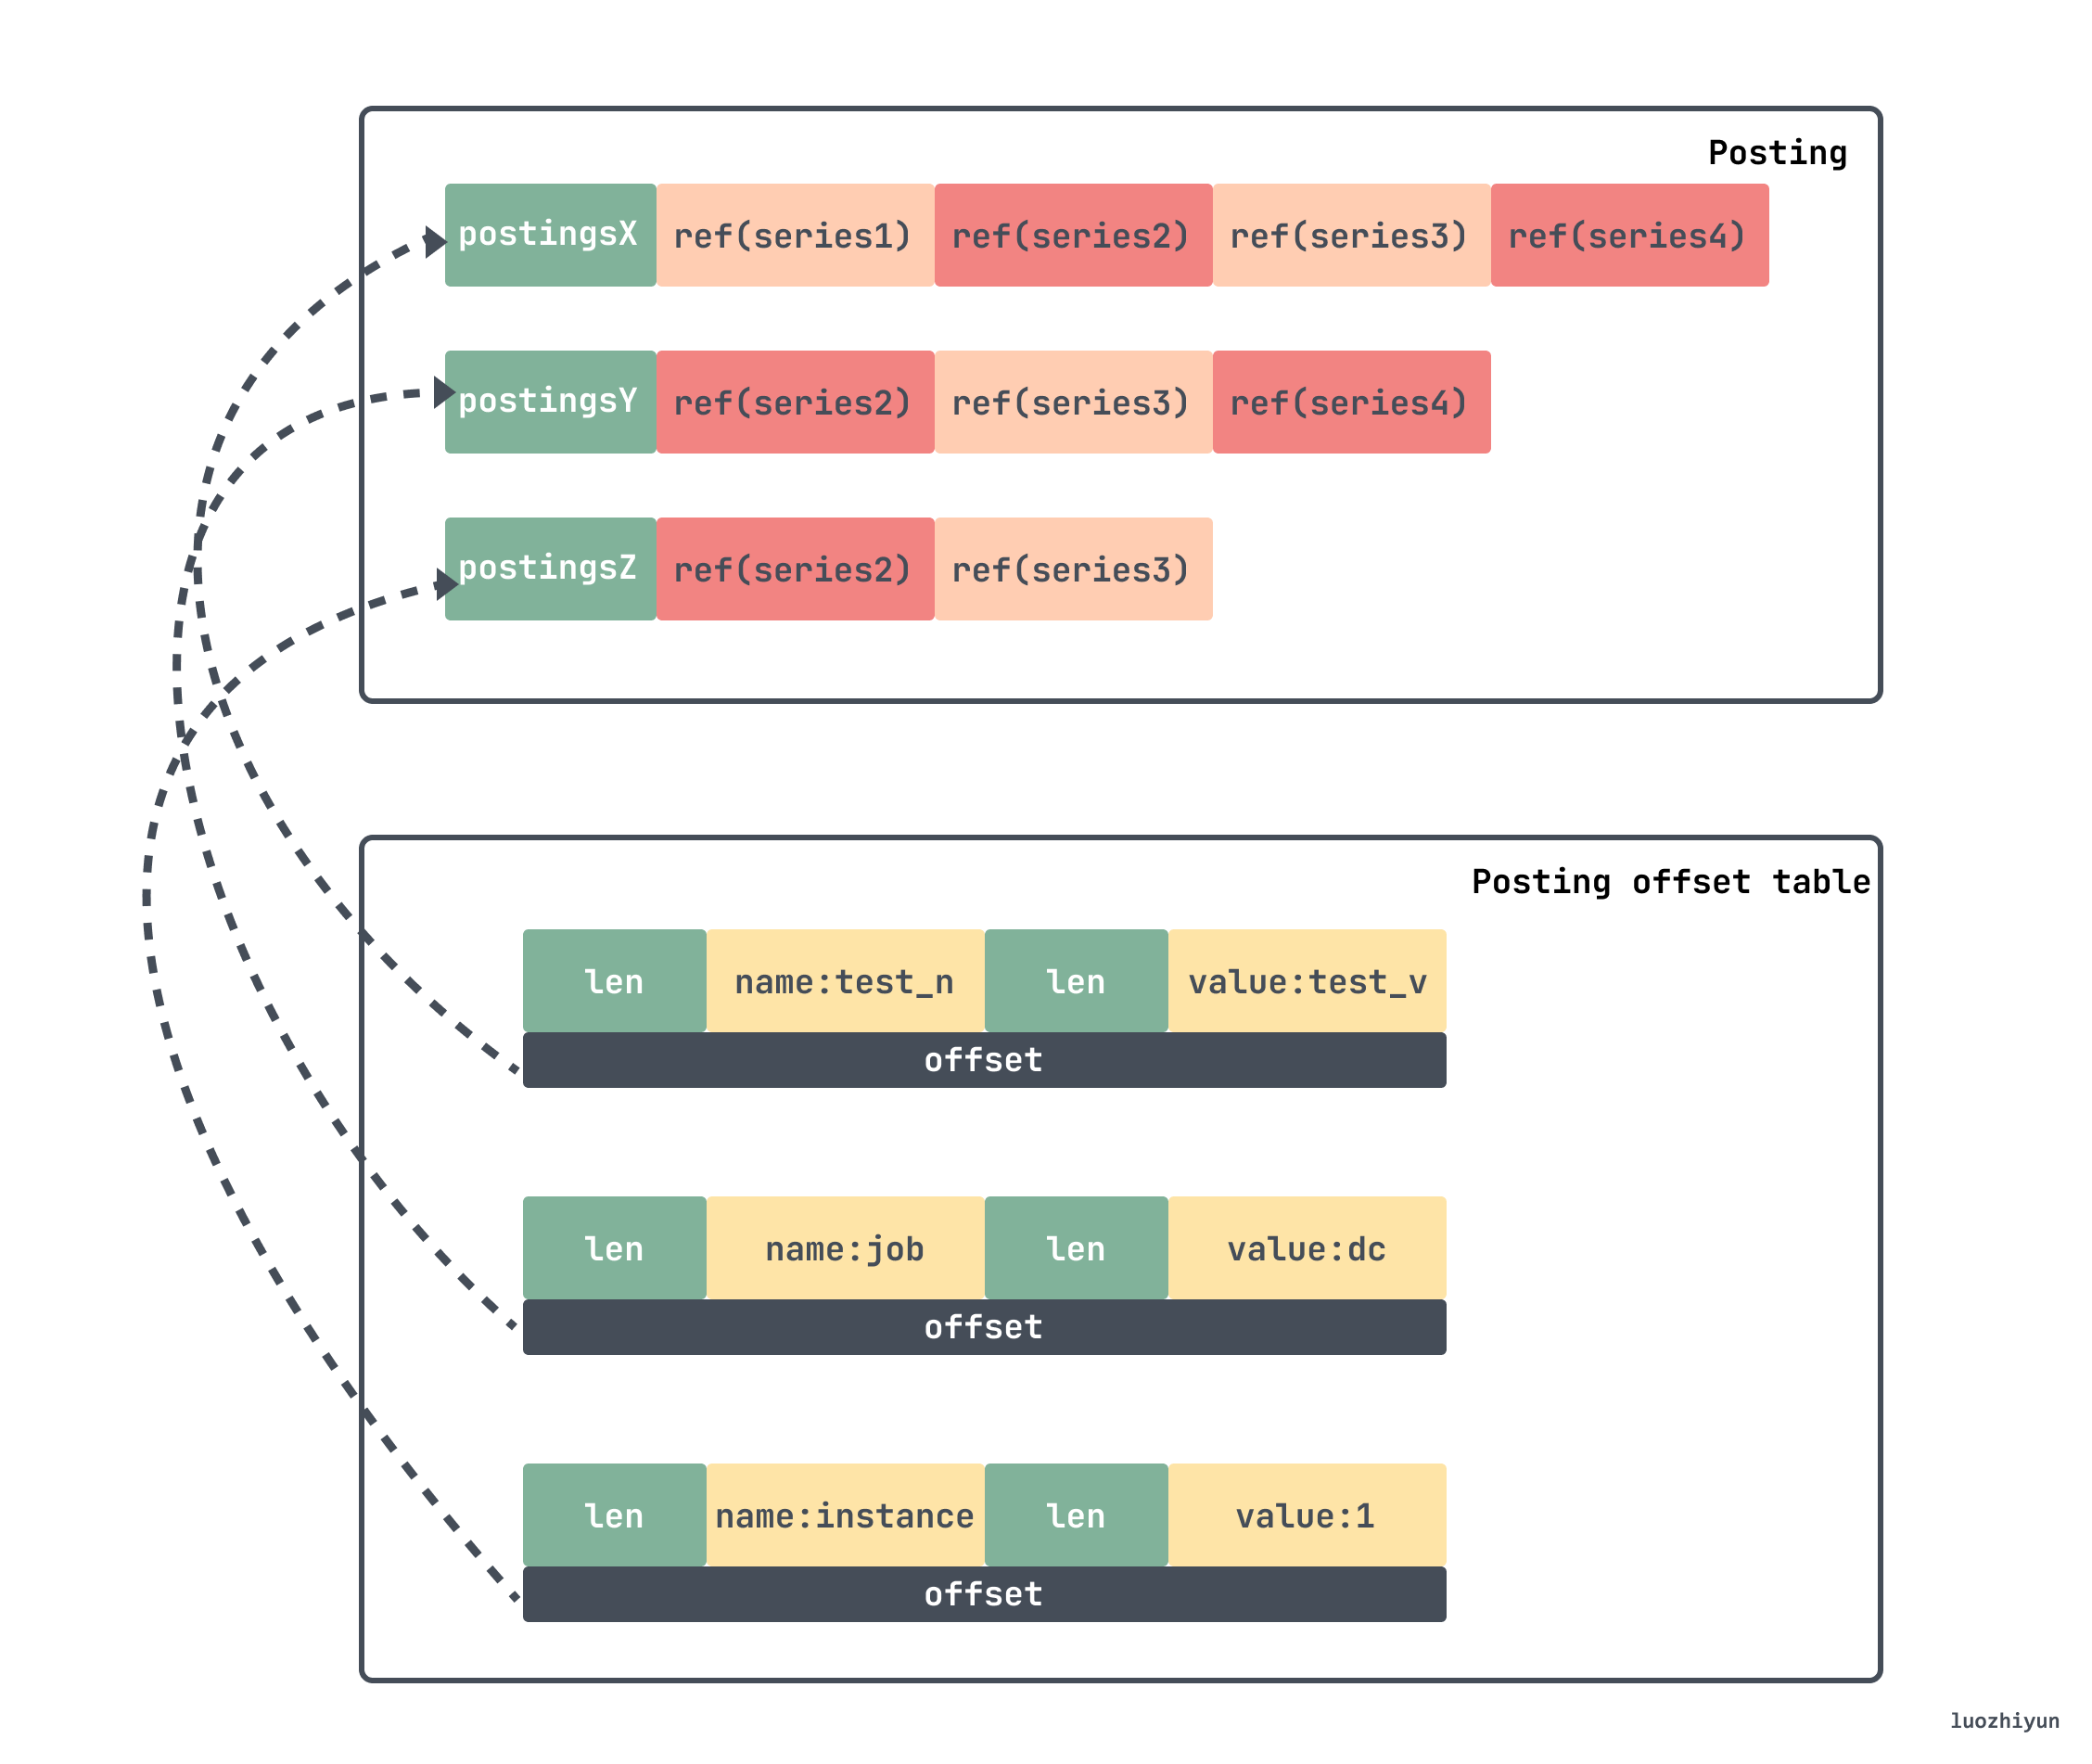
If we want to find the series corresponding to the above lable, then we need to go to the Posting offset table to find the corresponding offset, which is the offset of the Posting, go to it to find the corresponding entry, and then take the sum to get the corresponding seriesId. Then in our example above, the final list of seriesId is {Series2,Series3}.
After finding the corresponding seriesId, we go to the series segment of index to find the corresponding chunk information. series segment first stores the key/value information of each label of the series. Next, the series-related chunks are stored, including the time window of each chunk and the specific location of the chunk in the chunks subdirectory, and then the chunk file is accessed to find the final raw data.
|
|
Summary
In fact, we can clearly understand that the idea of writing Prometheus data is actually very clear. Because tsdb data has its own characteristics, it is based on a series of indicators based on the relatively stable frequency of continuous generation of monitoring data, then the storage is some label keys plus a time series as a large key, the value is a number, these data constitute a time series data, so the key-value database can naturally be used as a carrier of time-series data.
For data storage Prometheus separates hot and cold data, the most recent data is definitely the most watched, so it is cached in memory, and to prevent data loss due to downtime, wal is introduced to do fault recovery. After the data exceeds a certain amount, it will be stripped out of memory and stored on disk in the form of chunk, which is head chunk, and for older data, it will be compressed and persisted into blocks and stored on disk.
For the data in the block is not changing, the data is more fixed, so each block indexes the data in it by index, and the inverted index is used to speed up the data query, so that it is easy to locate the corresponding chunk quickly.
Ref
https://www.luozhiyun.com/archives/725