In today’s age of data explosion, time-series data have become an integral part of businesses and organisations. They include vast amounts of data from a variety of sources such as sensors, monitoring devices, logging systems and financial transactions, which are arranged chronologically and record the occurrence and changes of various events and activities. The analysis and processing of time-series data is critical to business decisions and operational efficiency in an organisation. In order to better manage and utilise this data, the Time Series Database System (TSDB) was invented.
In a time series database system, time series data is usually abstracted and organised as time series, and the design and implementation of time series database is also based on time series, so understanding time series is a prerequisite for a deeper understanding of time series database system.
In this article, I will learn about the concept of timelines in time series databases and use InfluxDB (2.x) as an example to explore the organisation and presentation of timelines in this database.
1. What is time-series data
Time series data, are data points that are recorded in chronological order and have a time stamp. These data points may be continuous (metrics in the upper part of the diagram below), such as recorded once per second, or irregular, such as recorded when a particular event occurs (events in the lower part of the diagram below).
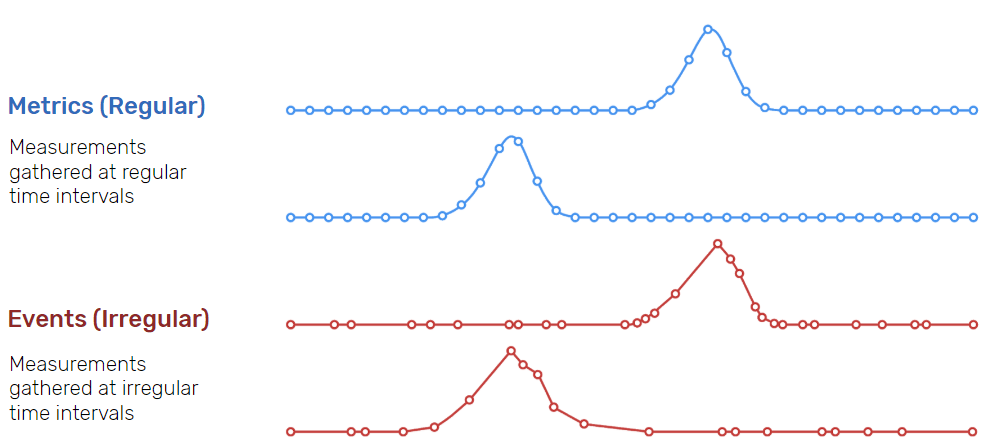
From influxdb
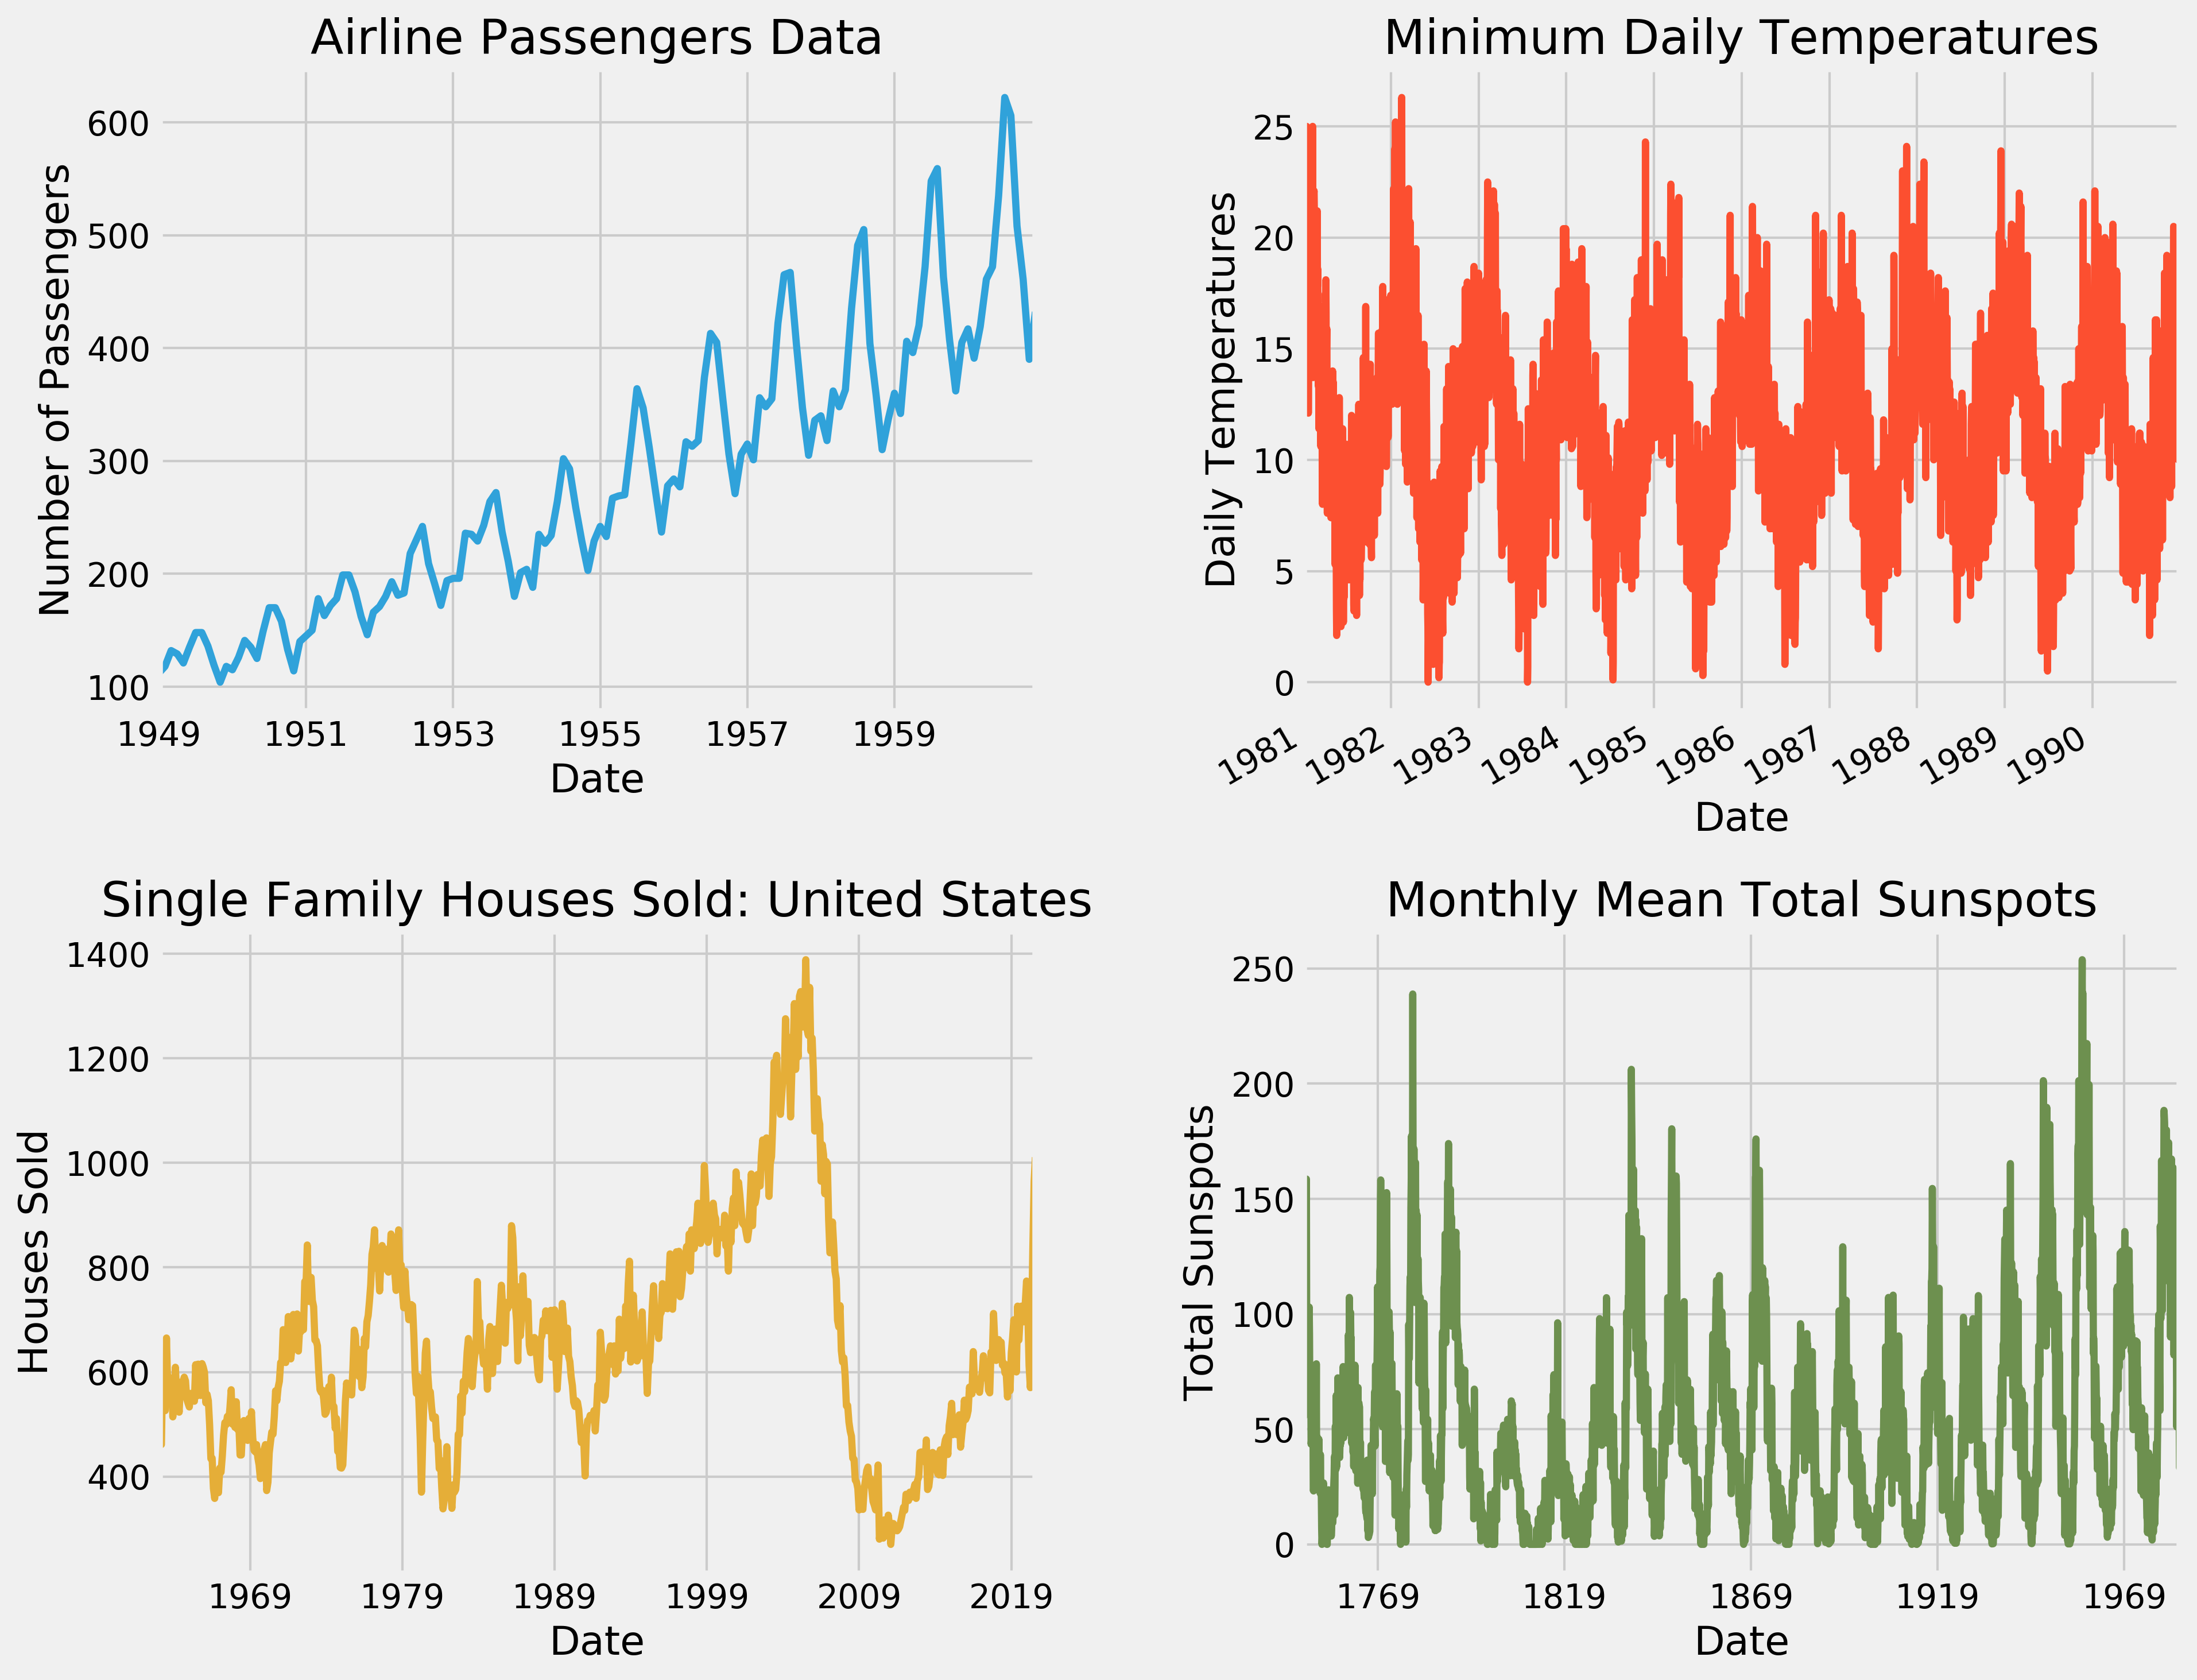
Time-series data has a wide range of applications in a number of areas, such as stock prices in financial markets, meteorological data in climate science, operational data from industrial equipment, IoT data and Telematics data, as shown below (this image is from the web).
Time-series data have several distinctive characteristics:
-
Timestamp
Time-series data is time-related data, where each data point is given a timestamp or time range to identify the time it was generated or recorded.
-
Large data volumes
The amount of timing data flowing from the source is often uninterrupted.
-
The volume of data is unpredictable
There may be a sudden influx of data at irregular intervals. This is very common in financial markets, where events are followed by spikes in trading volumes which are difficult to predict.
-
Real-time
Time-series data often needs to be processed and analysed in real time so that timely action can be taken or alerts can be issued if changes in the data occur. A good example of this is anomaly detection.
-
append write
New data points are appended to the end of existing data, rather than, or very rarely, modifying or deleting existing data. And in the vast majority of cases, time series data is arranged in chronological order.
We can see that time series data and traditional OLTP (Online Transaction Processing) data have many different characteristics, and these differences determine the data model used in database management systems based on time series data, the size of the data processed, how the data is accessed, how often the data is processed, and how the data is handled.
So how do the current mainstream time series databases store, process and manage time series data? Let’s continue down the list.
2. Timeline: Time-Series Databases Modeling Time-Series Data
When you first learn about and study a time-series database (tsdb), you will learn a term called Time Series, whether you are studying InfluxDB, Prometheus or TDengine or something else.
Paul Dix, co-founder of Influxdb, understands timelines in ttsdb as follows:
Paul sees timelines as a way to interpret and understand time series data. In fact, timelines are a way of modelling time series data in the time series database community. Time series databases are designed and implemented around this model of the timeline, although of course different time series databases build slightly different models of the timeline and have different model capabilities.
With the timeline as a model, we can redefine a time series database as a system for storing timelines.
Here we will take a look at the timeline model in a real time series database using Influxdb 2.x as an example.
2.1 Line Protocol for InfluxDB 2.x
It is impossible to talk about timelines without mentioning InfluxDB’s Line Protocol for writing to data points. This is a popular time series database ingest protocol in the field of time series databases today. The Line Protocol allows us to visualise the way in which influxdb 2.x models the timeline. Below is the syntax and an example as defined in the Line Protocol manual.
The diagram of an example from a Paul Dix PowerPoint presentation below and the diagram from the Line Protocol brochure can be seen a little more visually.
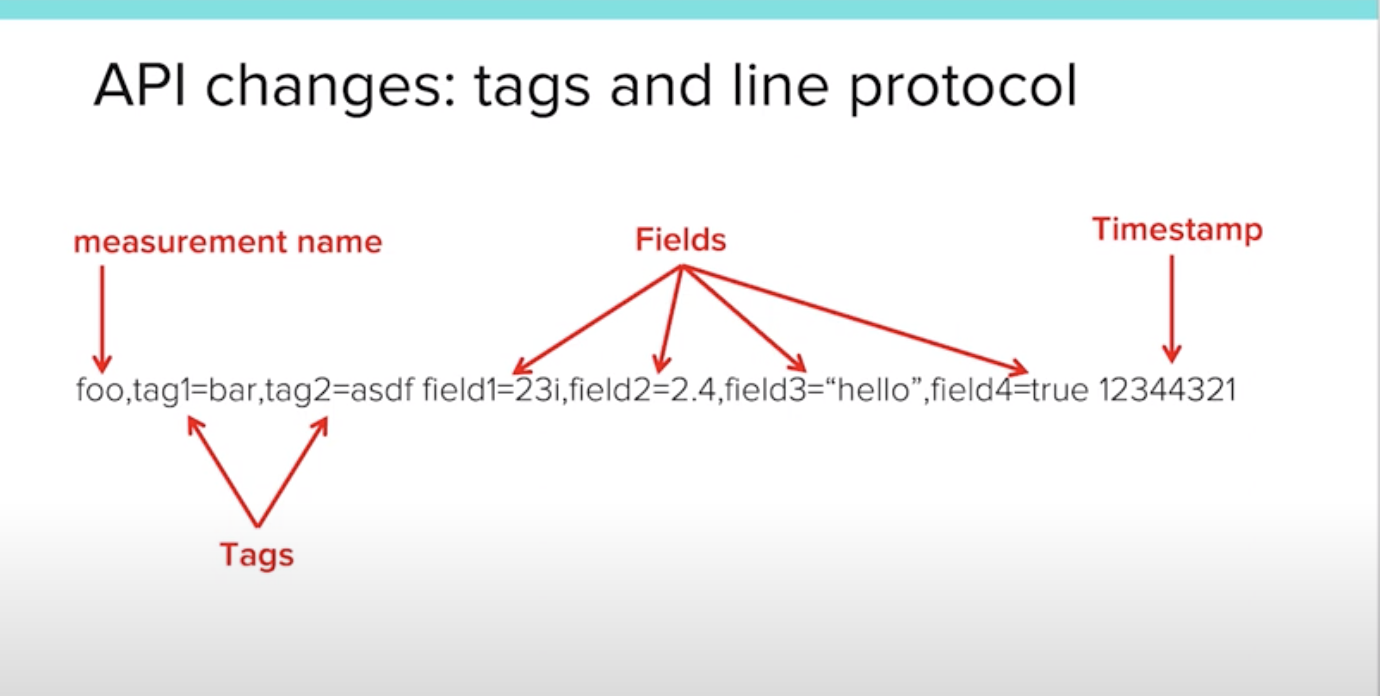
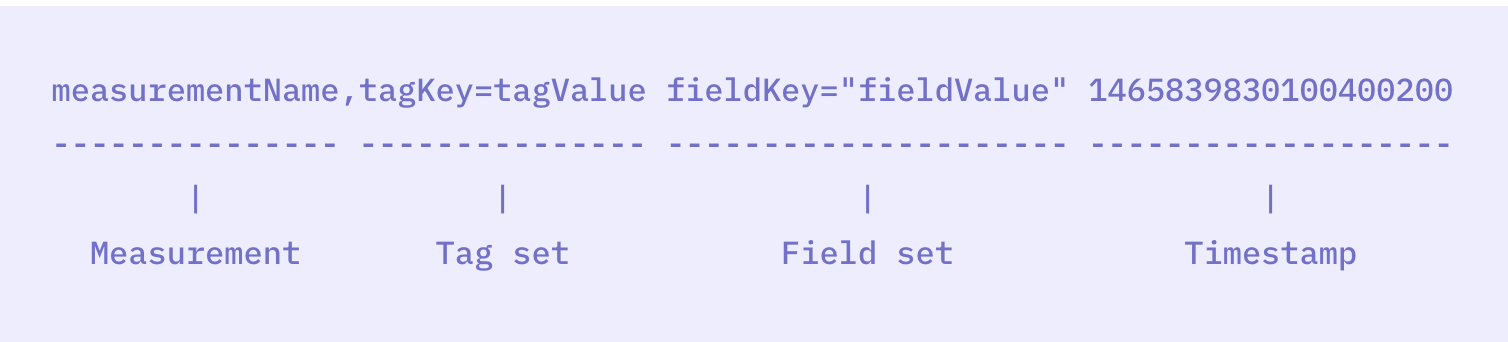
We see that: in InfluxDB, a time series data inserted via Line Protocol contains four parts.
-
measurement
Classes of time series data, such as temperature, humidity, etc. measurement is similar to a table name in a relational database where each time series data point is grouped into a measurement. This part is mandatory.
-
tag
A collection of labels for time series data points. Tags are used to describe the attributes or characteristics of the data, such as the location where it was generated, the model of the device, etc. For each time series data point, InfluxDB supports multiple tags (tags), each tag is a key-value pair and multiple tags are separated by commas. However, the tag part is an optional field, and the tag key-value pairs are all of type string.
-
field
The field section is a collection of indicators for the time series data points, i.e. the payload part of the time series data. This section places the field to be obtained, a key-value pair, including the indicator name and the corresponding value. If what is to be ingested is the weather information of a place, here you can use temperature=35.3,humidity=0.7; if the collection is the share price of a stock, then here you can use price=201.
The field section is a mandatory field and should have at least one key-value pair. Unlike tag, the value part of the field key-value pair supports numeric values, boolean values and strings.
-
timestamp
As the name suggests, this section is the timestamp, the time at which the data point was collected; this section in Line Protocol can be empty, and once it is, then the timestamp of the data point will be set to the current time by default.
So what exactly is the timeline that InfluxDB defines based on the Line Protocol? Let’s take a look at it.
2.2 Timelines and Time Points
With a knowledge of the various parts of Line Protocol, it is much easier to understand the timeline defined by InfluxDB.
The timeline defined by InfluxDB consists of two parts, one part is the timeline key and the other part is the set of timeline values.
Note: We see that both tag name and tag value are part of the timeline key, but field is only name, which is one of the important differences between tag and field.
See an example from a PowerPoint presentation by Paul Dix with the following data ingested using Line Protocol:
Let’s analyse how many timelines are actually contained in these three Line Protocol data! Based on the timeline key uniquely identifying a timeline and the definition of the timeline key, we can get six combinations of measurement+tags+field_name, i.e. six timelines.
Looked at this way, the previously ingested data was only recorded at one data point (i.e. time point) in each timeline. Taking the first timeline as an example, the data points for its ingest are as follows.
To better represent the relationship between the timeline and the time points, we then use Line Protocol to add a few more data points to the above timeline.
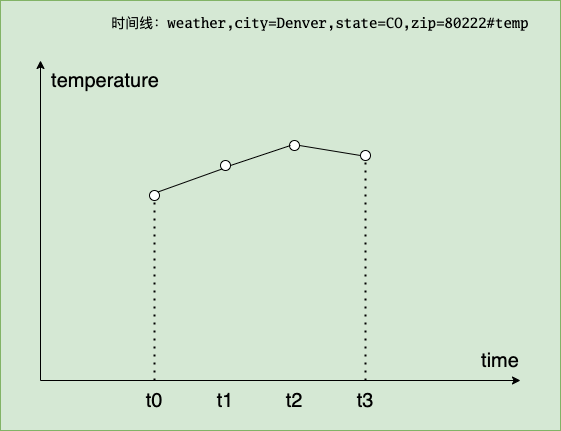
The timeline thus formed is as follows:
We can visually plot the temperature trend of Denvor against this timeline (x-axis is time and y-axis is the temperature change of denvor).
Note: The above is influxdb 2.x modelling of time series data. influxdb 3.0, i.e. influxdb iox did a re-modelling of time series, returning to the table approach: measurement <=> table, with the rest of the labels, fields and timestamps becoming columns.
The timeline abstraction of InfluxDB is very important, it has an important impact on the design of the storage engine, query engine, etc. of influxdb. There is another important issue about time series databases that needs to be clearly understood, and that is Cardinality, below we will talk about the cardinality of tsdb.
3 Cardinality in time series databases
The concept of cardinality is not exclusive to time series databases, it is found in traditional relational databases. The first section of the first chapter of SQL Optimization Core Ideas deals with cardinality. The definition given in the book is that the number of unique keys in a column is called the cardinality. The book also gives an example that is better understood. For example, the gender column has a value of either male or female, so the column has a base of 2.
So how does InfluxDB define the number of bases associated with a time series database? Simply put, it is the number of unique timelines. If a database has only one measurement, then the cardinality that defines that measurement is the number of unique timelines under that measurement, as shown in the example below.
The base number for this measurement1 is 3x4x5 = 60.
In InfluxDB version 2.x, a high cardinality means an inflated timeline, which may affect read and write performance. This is because high Cardinality increases index size, leading to increased memory usage, reduced query performance and longer index maintenance times. At the same time, high Cardinality can also lead to slower write speeds, longer query execution times, increased disk space usage and more complex and time-consuming compression and data maintenance operations. To mitigate the impact of high Cardinality on InfluxDB read and write performance, measures can be taken such as careful design of the data model (reducing high cardinality dimensions), using continuous queries or tasks for pre-aggregation, or using InfluxDB 3.0, which has just been released and is claimed to support unlimited timelines.
4. Summary
Time series data has a wide range of real-world applications. Time series databases, such as InfluxDB 2.x, use timelines as the underlying data structure to efficiently model, query and manage time series data. However, high cardinality data remains an important challenge for time series databases. Understanding timelines in time series databases and their advantages and disadvantages can help us to better utilise time series databases to solve practical problems.
5. Ref
https://tonybai.com/2023/05/28/understand-time-series-of-tsdb/