In the previous study, we used a kubectl scale command to implement Pod scaling, but this is after all a completely manual operation. To this end, Kubernetes also provides us with such a resource object: Horizontal Pod Autoscaling, or HPA for short, which monitors and analyzes the load changes of all Pods controlled by some controllers to determine whether the number of copies of Pods needs to be adjusted. The basic principle of HPA is.
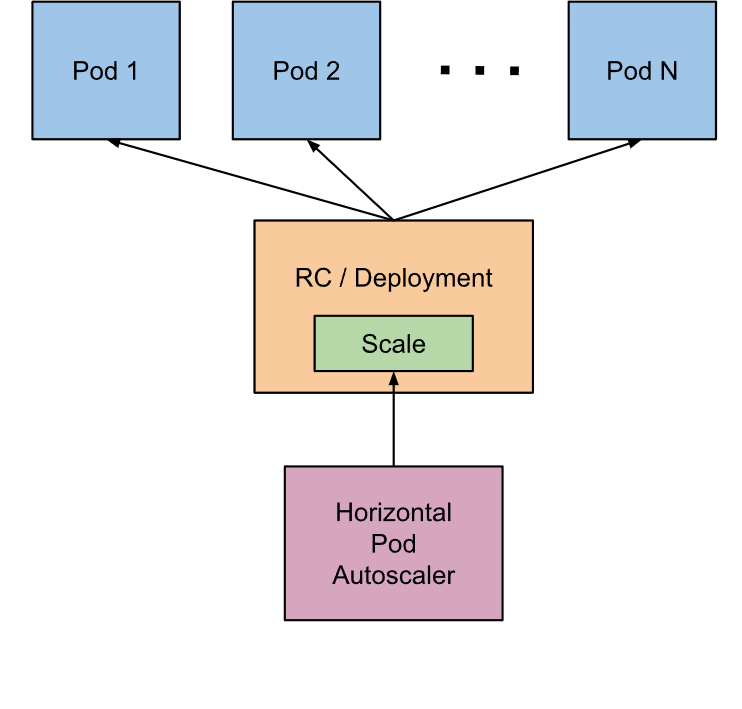
We can simply create an HPA resource object with the kubectl autoscale command, and the HPA Controller will poll once by default 30s (which can be set with the -kube-controller-manager -horizontal-pod-autoscaler- sync-period parameter of -kube-controller-manager) to query the Pod resource utilization in the specified resource and compare it with the value and metrics set at creation time to achieve the auto-scaling feature.
Metrics Server
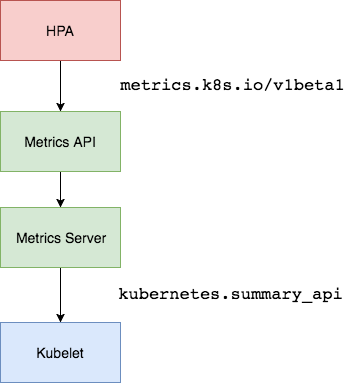
In the first version of HPA, we needed Heapster to provide CPU and memory metrics, and after HPA v2, we needed to install Metrcis Server, Metrics Server to expose monitoring data through the standard Kubernetes API.
1
|
https://10.96.0.1/apis/metrics.k8s.io/v1beta1/namespaces/<namespace-name>/pods/<pod-name>
|
For example, when we access the API above, we can get the resource data of the Pod, which is actually collected from the Summary API of the kubelet. However, it should be noted that we can get resource monitoring data through the standard API here, not because Metrics Server is part of the APIServer, but through the Aggregator aggregation plugin provided by Kubernetes, which runs independently of the APIServer.
Aggregator API
Aggregator allows developers to write a service of their own, register it with the Kubernetes APIServer, so we can use our own API like the native APIServer provides, we run our service inside the Kubernetes cluster, and then The Kubernetes Aggregator can be forwarded to the Service we wrote by the Service name. This aggregation layer brings a number of benefits.
- Increased API extensibility, developers can write their own API services to expose the APIs they want.
- Enriching the API, the core kubernetes team blocked many new API proposals by allowing developers to expose their APIs as separate services, without the need for cumbersome community review.
- Develop experimental APIs in phases, so that new APIs can be developed in a separate aggregation service, and when it is stable, it is easy to merge in the APIServer.
- Ensure that new APIs follow Kubernetes conventions. Without the mechanisms proposed here, community members may be forced to roll their own stuff, which is likely to result in inconsistencies between community members and community conventions.
Installation
So now we need to install the Metrics Server service in the cluster if we want to use HPA. To install Metrics Server we need to turn on Aggregator because Metrics Server is scaled through this agent, but our cluster is built through Kubeadm and is already turned on by default. If the cluster is installed in binary way, you need to configure kube-apsierver separately adding the parameters shown below.
1
2
3
4
5
6
7
|
--requestheader-client-ca-file=<path to aggregator CA cert>
--requestheader-allowed-names=aggregator
--requestheader-extra-headers-prefix=X-Remote-Extra-
--requestheader-group-headers=X-Remote-Group
--requestheader-username-headers=X-Remote-User
--proxy-client-cert-file=<path to aggregator proxy cert>
--proxy-client-key-file=<path to aggregator proxy key>
|
If kube-proxy is not running on the same host as the APIServer, then you need to make sure that the following kube-apsierver parameters are enabled.
1
|
--enable-aggregator-routing=true
|
For the way these certificates are generated, we can check the official documentation: https://github.com/kubernetes-sigs/apiserver-builder-alpha/blob/master/docs/concepts/auth.md.
Once the Aggregator aggregation layer is started, it’s time to install Metrics Server and we can get the official list of installation resources for this repository at
1
2
3
|
$ git clone https://github.com/kubernetes-incubator/metrics-server
$ cd metrics-server
$ kubectl apply -f deploy/1.8+/
|
Before deployment, modify the image address of metrcis-server/deploy/1.8+/metrics-server-deployment.yaml to
1
2
3
|
containers:
- name: metrics-server
  image: gcr.azk8s.cn/google_containers/metrics-server-amd64:v0.3.6
|
When the deployment is complete, you can check the Pod logs to see if they are OK.
1
2
3
4
5
6
|
$ kubectl get pods -n kube-system -l k8s-app=metrics-server
NAME                              READY   STATUS    RESTARTS   AGE
metrics-server-6886856d7c-g5k6q   1/1     Running   0          2m39s
$ kubectl logs -f metrics-server-6886856d7c-g5k6q -n kube-system
......
E1119 09:05:57.234312       1 manager.go:111] unable to fully collect metrics: [unable to fully scrape metrics from source kubelet_summary:ydzs-node1: unable to fetch metrics from Kubelet ydzs-node1 (ydzs-node1): Get https://ydzs-node1:10250/stats/summary?only_cpu_and_memory=true: dial tcp: lookup ydzs-node1 on 10.96.0.10:53: no such host, unable to fully scrape metrics from source kubelet_summary:ydzs-node4: unable to fetch metrics from Kubelet ydzs-node4 (ydzs-node4): Get https://ydzs-node4:10250/stats/summary?only_cpu_and_memory=true: dial tcp: lookup ydzs-node4 on 10.96.0.10:53: no such host, unable to fully scrape metrics from source kubelet_summary:ydzs-node3: unable to fetch metrics from Kubelet ydzs-node3 (ydzs-node3): Get https://ydzs-node3:10250/stats/summary?only_cpu_and_memory=true: dial tcp: lookup ydzs-node3 on 10.96.0.10:53: no such host, unable to fully scrape metrics from source kubelet_summary:ydzs-master: unable to fetch metrics from Kubelet ydzs-master (ydzs-master): Get https://ydzs-master:10250/stats/summary?only_cpu_and_memory=true: dial tcp: lookup ydzs-master on 10.96.0.10:53: no such host, unable to fully scrape metrics from source kubelet_summary:ydzs-node2: unable to fetch metrics from Kubelet ydzs-node2 (ydzs-node2): Get https://ydzs-node2:10250/stats/summary?only_cpu_and_memory=true: dial tcp: lookup ydzs-node2 on 10.96.0.10:53: no such host]
|
We can find some error messages in the Pod: xxx: no such host, we can see that this error message is generally determined to be caused by DNS failure to resolve, we can see that Metrics Server will get information through port 10250 of the kubelet, using the hostname, when we deploy the cluster When we deploy the cluster, we add the hostname and ip mapping of the node in /etc/hosts, but our Metrics Server Pod does not have this hosts information internally, so of course, it does not recognize the hostname, to solve this problem, there are two methods.
The first method is to add hostname resolution to the DNS service inside the cluster, for example, if we are using CoreDNS in our cluster, we can modify the Configmap information of CoreDNS and add the hosts information as follows.
 1
 2
 3
 4
 5
 6
 7
 8
 9
10
11
12
13
14
15
16
17
18
19
20
21
22
23
24
25
26
27
28
29
30
|
$ kubectl edit configmap coredns -n kube-system
apiVersion: v1
data:
  Corefile: |
    .:53 {
        errors
        health
        hosts {  # 添加集群节点hosts隐射信息
          10.151.30.11 ydzs-master
          10.151.30.57 ydzs-node3
          10.151.30.59 ydzs-node4
          10.151.30.22 ydzs-node1
          10.151.30.23 ydzs-node2
          fallthrough
        }
        kubernetes cluster.local in-addr.arpa ip6.arpa {
           pods insecure
           upstream
           fallthrough in-addr.arpa ip6.arpa
        }
        prometheus :9153
        proxy . /etc/resolv.conf
        cache 30
        reload
    }
kind: ConfigMap
metadata:
  creationTimestamp: 2019-05-18T11:07:46Z
  name: coredns
  namespace: kube-system
|
Another way is to modify the kubelet-preferred-address-types parameter in the metrics-server startup parameters, as follows.
1
2
3
4
|
args:
- --cert-dir=/tmp
- --secure-port=4443
- --kubelet-preferred-address-types=InternalIP
|
We use the second way here and reinstall.
1
2
3
4
5
6
|
$ kubectl get pods -n kube-system -l k8s-app=metrics-server
NAME                              READY   STATUS        RESTARTS   AGE
metrics-server-6dcfdf89b5-tvdcp   1/1     Running       0          33s
$ kubectl logs -f metric-metrics-server-58fc94d9f-jlxcb -n kube-system
......
E1119 09:08:49.805959       1 manager.go:111] unable to fully collect metrics: [unable to fully scrape metrics from source kubelet_summary:ydzs-node3: unable to fetch metrics from Kubelet ydzs-node3 (10.151.30.57): Get https://10.151.30.57:10250/stats/summary?only_cpu_and_memory=true: x509: cannot validate certificate for 10.151.30.57 because it doesn't contain any IP SANs, unable to fully scrape metrics from source kubelet_summary:ydzs-node4: unable to fetch metrics from Kubelet ydzs-node4 (10.151.30.59): Get https://10.151.30.59:10250/stats/summary?only_cpu_and_memory=true: x509: cannot validate certificate for 10.151.30.59 because it doesn't contain any IP SANs, unable to fully scrape metrics from source kubelet_summary:ydzs-node2: unable to fetch metrics from Kubelet ydzs-node2 (10.151.30.23): Get https://10.151.30.23:10250/stats/summary?only_cpu_and_memory=true: x509: cannot validate certificate for 10.151.30.23 because it doesn't contain any IP SANs, unable to fully scrape metrics from source kubelet_summary:ydzs-master: unable to fetch metrics from Kubelet ydzs-master (10.151.30.11): Get https://10.151.30.11:10250/stats/summary?only_cpu_and_memory=true: x509: cannot validate certificate for 10.151.30.11 because it doesn't contain any IP SANs, unable to fully scrape metrics from source kubelet_summary:ydzs-node1: unable to fetch metrics from Kubelet ydzs-node1 (10.151.30.22): Get https://10.151.30.22:10250/stats/summary?only_cpu_and_memory=true: x509: cannot validate certificate for 10.151.30.22 because it doesn't contain any IP SANs]
|
Because the CA certificate is not signed with the IPs of each node when the cluster is deployed, so when Metrics Server requests it by IP, the signed certificate does not have a corresponding IP (error: x509: cannot validate certificate for 10.151.30.22 because it doesn't contain any IP SANs), we can add a -kubelet-insecure-tls parameter to skip the certificate verification: -kubelet-insecure-tls.
1
2
3
4
5
|
args:
- --cert-dir=/tmp
- --secure-port=4443
- --kubelet-insecure-tls
- --kubelet-preferred-address-types=InternalIP
|
Then reinstall it again and it will work! This can be verified with the following command.
 1
 2
 3
 4
 5
 6
 7
 8
 9
10
11
12
13
14
15
16
17
18
|
$ kubectl apply -f deploy/1.8+/
$ kubectl get pods -n kube-system -l k8s-app=metrics-server
NAME                              READY   STATUS    RESTARTS   AGE
metrics-server-5d4dbb78bb-6klw6   1/1     Running   0          14s
$ kubectl logs -f metrics-server-5d4dbb78bb-6klw6 -n kube-system
I1119 09:10:44.249092       1 serving.go:312] Generated self-signed cert (/tmp/apiserver.crt, /tmp/apiserver.key)
I1119 09:10:45.264076       1 secure_serving.go:116] Serving securely on [::]:4443
$ kubectl get apiservice | grep metrics
v1beta1.metrics.k8s.io                 kube-system/metrics-server   True        9m
$ kubectl get --raw "/apis/metrics.k8s.io/v1beta1/nodes"
{"kind":"NodeMetricsList","apiVersion":"metrics.k8s.io/v1beta1","metadata":{"selfLink":"/apis/metrics.k8s.io/v1beta1/nodes"},"items":[{"metadata":{"name":"ydzs-node3","selfLink":"/apis/metrics.k8s.io/v1beta1/nodes/ydzs-node3","creationTimestamp":"2019-11-19T09:11:53Z"},"timestamp":"2019-11-19T09:11:38Z","window":"30s","usage":{"cpu":"240965441n","memory":"3004360Ki"}},{"metadata":{"name":"ydzs-node4","selfLink":"/apis/metrics.k8s.io/v1beta1/nodes/ydzs-node4","creationTimestamp":"2019-11-19T09:11:53Z"},"timestamp":"2019-11-19T09:11:37Z","window":"30s","usage":{"cpu":"167036681n","memory":"2574664Ki"}},{"metadata":{"name":"ydzs-master","selfLink":"/apis/metrics.k8s.io/v1beta1/nodes/ydzs-master","creationTimestamp":"2019-11-19T09:11:53Z"},"timestamp":"2019-11-19T09:11:38Z","window":"30s","usage":{"cpu":"350907350n","memory":"2986716Ki"}},{"metadata":{"name":"ydzs-node1","selfLink":"/apis/metrics.k8s.io/v1beta1/nodes/ydzs-node1","creationTimestamp":"2019-11-19T09:11:53Z"},"timestamp":"2019-11-19T09:11:39Z","window":"30s","usage":{"cpu":"1319638039n","memory":"2094376Ki"}},{"metadata":{"name":"ydzs-node2","selfLink":"/apis/metrics.k8s.io/v1beta1/nodes/ydzs-node2","creationTimestamp":"2019-11-19T09:11:53Z"},"timestamp":"2019-11-19T09:11:36Z","window":"30s","usage":{"cpu":"320381888n","memory":"3270368Ki"}}]}
$ kubectl top nodes
NAME          CPU(cores)   CPU%   MEMORY(bytes)   MEMORY%
ydzs-master   351m         17%    2916Mi          79%
ydzs-node1    1320m        33%    2045Mi          26%
ydzs-node2    321m         8%     3193Mi          41%
ydzs-node3    241m         6%     2933Mi          37%
ydzs-node4    168m         4%     2514Mi          32%
|
Now we can get the resource data with the kubectl top command, which proves that Metrics Server has been installed successfully.
CPU-based
Now we use Deployment to create an Nginx Pod, and then use HPA to automate the scaling. The list of resources is shown below: (hpa-demo.yaml)
 1
 2
 3
 4
 5
 6
 7
 8
 9
10
11
12
13
14
15
16
17
18
|
apiVersion: apps/v1
kind: Deployment
metadata:
  name: hpa-demo
spec:
  selector:
    matchLabels:
      app: nginx
  template:
    metadata:
      labels:
        app: nginx
    spec:
      containers:
      - name: nginx
        image: nginx
        ports:
        - containerPort: 80
|
Then create the Deployment directly.
1
2
3
4
5
|
$ kubectl apply -f hpa-demo.yaml
deployment.apps/hpa-demo created
$ kubectl get pods -l app=nginx
NAME                        READY   STATUS    RESTARTS   AGE
hpa-demo-85ff79dd56-pz8th   1/1     Running   0          21s
|
Now let’s create an HPA resource object, which can be created using the kubectl autoscale command.
1
2
3
4
5
|
$ kubectl autoscale deployment hpa-demo --cpu-percent=10 --min=1 --max=10
horizontalpodautoscaler.autoscaling/hpa-demo autoscaled
$ kubectl get hpa
NAME       REFERENCE             TARGETS         MINPODS   MAXPODS   REPLICAS   AGE
hpa-demo   Deployment/hpa-demo   <unknown>/10%   1         10        1          16s
|
This command creates an HPA with the associated resource hpa-demo, with a minimum number of Pod copies of 1 and a maximum of 10. The HPA dynamically increases or decreases the number of Pods according to a set cpu usage rate (10%).
Of course, we can still create HPA resource objects by creating YAML files. If we don’t know how to write one, we can look at the YAML file for the HPA created on the command line above.
 1
 2
 3
 4
 5
 6
 7
 8
 9
10
11
12
13
14
15
16
17
18
19
20
21
22
23
24
25
|
$ kubectl get hpa hpa-demo -o yaml
apiVersion: autoscaling/v1
kind: HorizontalPodAutoscaler
metadata:
  annotations:
    autoscaling.alpha.kubernetes.io/conditions: '[{"type":"AbleToScale","status":"True","lastTransitionTime":"2019-11-19T09:15:12Z","reason":"SucceededGetScale","message":"the
      HPA controller was able to get the target''s current scale"},{"type":"ScalingActive","status":"False","lastTransitionTime":"2019-11-19T09:15:12Z","reason":"FailedGetResourceMetric","message":"the
      HPA was unable to compute the replica count: missing request for cpu"}]'
  creationTimestamp: "2019-11-19T09:14:56Z"
  name: hpa-demo
  namespace: default
  resourceVersion: "3094084"
  selfLink: /apis/autoscaling/v1/namespaces/default/horizontalpodautoscalers/hpa-demo
  uid: b84d79f1-75b0-46e0-95b5-4cbe3509233b
spec:
  maxReplicas: 10
  minReplicas: 1
  scaleTargetRef:
    apiVersion: apps/v1
    kind: Deployment
    name: hpa-demo
  targetCPUUtilizationPercentage: 10
status:
  currentReplicas: 1
  desiredReplicas: 0
|
We can then create our own YAML-based HPA description file based on the YAML file above. However, we find some Fail messages in the above information, so let’s take a look at the HPA object.
 1
 2
 3
 4
 5
 6
 7
 8
 9
10
11
12
13
14
15
16
17
18
19
20
21
22
|
$ kubectl describe hpa hpa-demo
Name:                                                  hpa-demo
Namespace:                                             default
Labels:                                                <none>
Annotations:                                           <none>
CreationTimestamp:                                     Tue, 19 Nov 2019 17:14:56 +0800
Reference:                                             Deployment/hpa-demo
Metrics:                                               ( current / target )
  resource cpu on pods  (as a percentage of request):  <unknown> / 10%
Min replicas:                                          1
Max replicas:                                          10
Deployment pods:                                       1 current / 0 desired
Conditions:
  Type           Status  Reason                   Message
  ----           ------  ------                   -------
  AbleToScale    True    SucceededGetScale        the HPA controller was able to get the target's current scale
  ScalingActive  False   FailedGetResourceMetric  the HPA was unable to compute the replica count: missing request for cpu
Events:
  Type     Reason                        Age                From                       Message
  ----     ------                        ----               ----                       -------
  Warning  FailedGetResourceMetric       14s (x4 over 60s)  horizontal-pod-autoscaler  missing request for cpu
  Warning  FailedComputeMetricsReplicas  14s (x4 over 60s)  horizontal-pod-autoscaler  invalid metrics (1 invalid out of 1), first error is: failed to get cpu utilization: missing request for cpu
|
We can see that the event message above has a failed to get cpu utilization: missing request for cpu error message. This is because the Pod object we created above does not have a request resource declaration, which causes the HPA to not read the CPU metric information.
 1
 2
 3
 4
 5
 6
 7
 8
 9
10
11
12
13
14
15
16
17
18
19
20
21
22
|
apiVersion: apps/v1
kind: Deployment
metadata:
  name: hpa-demo
spec:
  selector:
    matchLabels:
      app: nginx
  template:
    metadata:
      labels:
        app: nginx
    spec:
      containers:
      - name: nginx
        image: nginx
        ports:
        - containerPort: 80
        resources:
          requests:
            memory: 50Mi
            cpu: 50m
|
Then re-update the Deployment and re-create the HPA object.
 1
 2
 3
 4
 5
 6
 7
 8
 9
10
11
12
13
14
15
16
17
18
19
20
21
22
23
24
25
26
27
28
29
30
31
|
$ kubectl apply -f hpa.yaml
deployment.apps/hpa-demo configured
$ kubectl get pods -o wide -l app=nginx
NAME                        READY   STATUS    RESTARTS   AGE     IP            NODE         NOMINATED NODE   READINESS GATES
hpa-demo-69968bb59f-twtdp   1/1     Running   0          4m11s   10.244.4.97   ydzs-node4   <none>           <none>
$ kubectl delete hpa hpa-demo
horizontalpodautoscaler.autoscaling "hpa-demo" deleted
$ kubectl autoscale deployment hpa-demo --cpu-percent=10 --min=1 --max=10
horizontalpodautoscaler.autoscaling/hpa-demo autoscaled
$ kubectl describe hpa hpa-demo
Name:                                                  hpa-demo
Namespace:                                             default
Labels:                                                <none>
Annotations:                                           <none>
CreationTimestamp:                                     Tue, 19 Nov 2019 17:23:49 +0800
Reference:                                             Deployment/hpa-demo
Metrics:                                               ( current / target )
  resource cpu on pods  (as a percentage of request):  0% (0) / 10%
Min replicas:                                          1
Max replicas:                                          10
Deployment pods:                                       1 current / 1 desired
Conditions:
  Type            Status  Reason               Message
  ----            ------  ------               -------
  AbleToScale     True    ScaleDownStabilized  recent recommendations were higher than current one, applying the highest recent recommendation
  ScalingActive   True    ValidMetricFound     the HPA was able to successfully calculate a replica count from cpu resource utilization (percentage of request)
  ScalingLimited  False   DesiredWithinRange   the desired count is within the acceptable range
Events:           <none>
$ kubectl get hpa
NAME       REFERENCE             TARGETS   MINPODS   MAXPODS   REPLICAS   AGE
hpa-demo   Deployment/hpa-demo   0%/10%    1         10        1          52s
|
Now that you can see that the HPA resource object is working, let’s test it by increasing the load, creating a busybox Pod, and cycling through the Pod created above.
1
2
3
|
$ kubectl run -it --image busybox test-hpa --restart=Never --rm /bin/sh
If you don't see a command prompt, try pressing enter.
/ # while true; do wget -q -O- http://10.244.4.97; done
|
As you can see in the figure below, the HPA is already working.
 1
 2
 3
 4
 5
 6
 7
 8
 9
10
11
12
13
14
15
|
$  kubectl get hpa
NAME       REFERENCE             TARGETS    MINPODS   MAXPODS   REPLICAS   AGE
hpa-demo   Deployment/hpa-demo   338%/10%   1         10        1          5m15s
$ kubectl get pods -l app=nginx --watch
NAME                        READY   STATUS              RESTARTS   AGE
hpa-demo-69968bb59f-8hjnn   1/1     Running             0          22s
hpa-demo-69968bb59f-9ss9f   1/1     Running             0          22s
hpa-demo-69968bb59f-bllsd   1/1     Running             0          22s
hpa-demo-69968bb59f-lnh8k   1/1     Running             0          37s
hpa-demo-69968bb59f-r8zfh   1/1     Running             0          22s
hpa-demo-69968bb59f-twtdp   1/1     Running             0          6m43s
hpa-demo-69968bb59f-w792g   1/1     Running             0          37s
hpa-demo-69968bb59f-zlxkp   1/1     Running             0          37s
hpa-demo-69968bb59f-znp6q   0/1     ContainerCreating   0          6s
hpa-demo-69968bb59f-ztnvx   1/1     Running             0          6s
|
We can see that a lot of new Pods have been automatically pulled up, finally settling on the 10 Pods we set above, while checking the number of copies of the resource hpa-demo, the number of copies has changed from the original 1 to 10
1
2
3
|
$ kubectl get deployment hpa-demo
NAME       READY   UP-TO-DATE   AVAILABLE   AGE
hpa-demo   10/10   10           10          17m
|
View the objects of the HPA resource to understand the working process.
 1
 2
 3
 4
 5
 6
 7
 8
 9
10
11
12
13
14
15
16
17
18
19
20
21
22
23
24
|
$ kubectl describe hpa hpa-demo
Name:                                                  hpa-demo
Namespace:                                             default
Labels:                                                <none>
Annotations:                                           <none>
CreationTimestamp:                                     Tue, 19 Nov 2019 17:23:49 +0800
Reference:                                             Deployment/hpa-demo
Metrics:                                               ( current / target )
  resource cpu on pods  (as a percentage of request):  0% (0) / 10%
Min replicas:                                          1
Max replicas:                                          10
Deployment pods:                                       10 current / 10 desired
Conditions:
  Type            Status  Reason               Message
  ----            ------  ------               -------
  AbleToScale     True    ScaleDownStabilized  recent recommendations were higher than current one, applying the highest recent recommendation
  ScalingActive   True    ValidMetricFound     the HPA was able to successfully calculate a replica count from cpu resource utilization (percentage of request)
  ScalingLimited  True    TooManyReplicas      the desired replica count is more than the maximum replica count
Events:
  Type    Reason             Age    From                       Message
  ----    ------             ----   ----                       -------
  Normal  SuccessfulRescale  5m45s  horizontal-pod-autoscaler  New size: 4; reason: cpu resource utilization (percentage of request) above target
  Normal  SuccessfulRescale  5m30s  horizontal-pod-autoscaler  New size: 8; reason: cpu resource utilization (percentage of request) above target
  Normal  SuccessfulRescale  5m14s  horizontal-pod-autoscaler  New size: 10; reason: cpu resource utilization (percentage of request) above target
|
Again, let’s shut down busybox at this point to reduce the load and wait a while to observe the HPA and Deployment objects.
1
2
3
4
5
6
|
$ kubectl get hpa
NAME       REFERENCE             TARGETS   MINPODS   MAXPODS   REPLICAS   AGE
hpa-demo   Deployment/hpa-demo   0%/10%    1         10        1          14m
$ kubectl get deployment hpa-demo
NAME       READY   UP-TO-DATE   AVAILABLE   AGE
hpa-demo   1/1     1            1           24m
|
Starting with Kubernetes v1.12 we can set a duration by setting the -kube-controller-manager component’s -horizontal-pod-autoscaler-downscale-stabilization parameter to specify how long after the current After the current operation is completed, HPA must wait for how long before another scaling operation is performed. The default is 5 minutes, which means that by default you need to wait 5 minutes before auto-scaling starts.
You can see that the number of replicas has changed from 10 to 1. Currently we are only demonstrating CPU usage as a metric, and we will learn to automatically scale up and down Pods based on custom monitoring metrics later in the course.
Memory-based
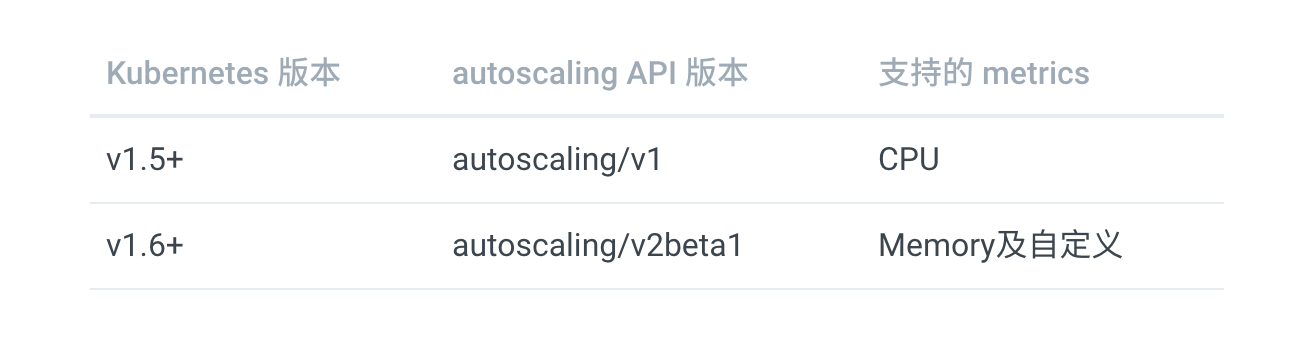
The HorizontalPodAutoscaler is a resource of the Kubernetes autoscaling API group, which only supports scaling based on CPU metrics in the current stable version of autoscaling/v1. In the Beta version autoscaling/v2beta2, scaling based on memory and custom metrics was introduced. So we need to use the API of the Beta version here.
Now we use Deployment to create an Nginx Pod, and then use HPA to automate the scaling. The list of resources is shown below: (hpa-mem-demo.yaml)
 1
 2
 3
 4
 5
 6
 7
 8
 9
10
11
12
13
14
15
16
17
18
19
20
21
22
23
24
25
26
27
28
29
30
31
|
apiVersion: apps/v1
kind: Deployment
metadata:
  name: hpa-mem-demo
spec:
  selector:
    matchLabels:
      app: nginx
  template:
    metadata:
      labels:
        app: nginx
    spec:
      volumes:
      - name: increase-mem-script
        configMap:
          name: increase-mem-config
      containers:
      - name: nginx
        image: nginx
        ports:
        - containerPort: 80
        volumeMounts:
        - name: increase-mem-script
          mountPath: /etc/script
        resources:
          requests:
            memory: 50Mi
            cpu: 50m
        securityContext:
          privileged: true
|
Here there are some differences with the previous common application, we mount a ConfigMap resource object named increase-mem-config to the container, the configuration file is used to increase the memory footprint of the container later in the script, the configuration file is shown below: (increase-mem-cm.yaml)
 1
 2
 3
 4
 5
 6
 7
 8
 9
10
11
12
13
14
|
apiVersion: v1
kind: ConfigMap
metadata:
  name: increase-mem-config
data:
  increase-mem.sh: |
    #!/bin/bash
    mkdir /tmp/memory
    mount -t tmpfs -o size=40M tmpfs /tmp/memory
    dd if=/dev/zero of=/tmp/memory/block
    sleep 60
    rm /tmp/memory/block
    umount /tmp/memory
    rmdir /tmp/memory
|
Since the script to increase memory here uses the mount command, which needs to be declared in privileged mode, we added the securityContext.privileged=true configuration. Now we can just create the resource object above.
1
2
3
4
5
|
$ kubectl apply -f increase-mem-cm.yaml
$ kubectl apply -f hpa-mem-demo.yaml
$ kubectl get pods -l app=nginx
NAME                            READY   STATUS    RESTARTS   AGE
hpa-mem-demo-66944b79bf-tqrn9   1/1     Running   0          35s
|
Then a memory-based HPA resource object needs to be created: (hpa-mem.yaml)
 1
 2
 3
 4
 5
 6
 7
 8
 9
10
11
12
13
14
15
16
|
apiVersion: autoscaling/v2beta1
kind: HorizontalPodAutoscaler
metadata:
  name: nginx-hpa
spec:
  scaleTargetRef:
    apiVersion: apps/v1
    kind: Deployment
    name: hpa-mem-demo
  minReplicas: 1
  maxReplicas: 5
  metrics:
  - type: Resource
    resource:
      name: memory
      targetAverageUtilization: 60
|
Note that the apiVersion used here is autoscaling/v2beta1, and then the metrics attribute specifies the memory configuration, so you can create the above resource object directly.
1
2
3
4
5
|
$ kubectl apply -f hpa-mem.yaml
horizontalpodautoscaler.autoscaling/nginx-hpa created
$ kubectl get hpa
NAME        REFERENCE                 TARGETS   MINPODS   MAXPODS   REPLICAS   AGE
nginx-hpa   Deployment/hpa-mem-demo   2%/60%    1         5         1          12s
|
This proves that the HPA resource object has been successfully deployed. Next, we pressure test the application by pressing the memory up and directly executing the increase-mem.sh script that we mounted into the container above.
1
2
3
4
5
6
7
8
|
$ kubectl exec -it hpa-mem-demo-66944b79bf-tqrn9 /bin/bash
root@hpa-mem-demo-66944b79bf-tqrn9:/# ls /etc/script/
increase-mem.sh
root@hpa-mem-demo-66944b79bf-tqrn9:/# source /etc/script/increase-mem.sh
dd: writing to '/tmp/memory/block': No space left on device
81921+0 records in
81920+0 records out
41943040 bytes (42 MB, 40 MiB) copied, 0.584029 s, 71.8 MB/s
|
Then open another terminal to observe the changes in the HPA resource object.
 1
 2
 3
 4
 5
 6
 7
 8
 9
10
11
12
13
14
15
16
17
18
19
20
21
22
23
24
25
26
27
28
29
30
31
|
$ kubectl get hpa
NAME        REFERENCE                 TARGETS   MINPODS   MAXPODS   REPLICAS   AGE
nginx-hpa   Deployment/hpa-mem-demo   83%/60%   1         5         1          5m3s
$ kubectl describe hpa nginx-hpa
Name:                                                     nginx-hpa
Namespace:                                                default
Labels:                                                   <none>
Annotations:                                              kubectl.kubernetes.io/last-applied-configuration:
                                                            {"apiVersion":"autoscaling/v2beta1","kind":"HorizontalPodAutoscaler","metadata":{"annotations":{},"name":"nginx-hpa","namespace":"default"...
CreationTimestamp:                                        Tue, 07 Apr 2020 13:13:59 +0800
Reference:                                                Deployment/hpa-mem-demo
Metrics:                                                  ( current / target )
  resource memory on pods  (as a percentage of request):  3% (1740800) / 60%
Min replicas:                                             1
Max replicas:                                             5
Deployment pods:                                          2 current / 2 desired
Conditions:
  Type            Status  Reason               Message
  ----            ------  ------               -------
  AbleToScale     True    ScaleDownStabilized  recent recommendations were higher than current one, applying the highest recent recommendation
  ScalingActive   True    ValidMetricFound     the HPA was able to successfully calculate a replica count from memory resource utilization (percentage of request)
  ScalingLimited  False   DesiredWithinRange   the desired count is within the acceptable range
Events:
  Type     Reason                        Age                    From                       Message
  ----     ------                        ----                   ----                       -------
  Warning  FailedGetResourceMetric       5m26s (x3 over 5m58s)  horizontal-pod-autoscaler  unable to get metrics for resource memory: no metrics returned from resource metrics API
  Warning  FailedComputeMetricsReplicas  5m26s (x3 over 5m58s)  horizontal-pod-autoscaler  invalid metrics (1 invalid out of 1), first error is: failed to get memory utilization: unable to get metrics for resource memory: no metrics returned from resource metrics API
  Normal   SuccessfulRescale             77s                    horizontal-pod-autoscaler  New size: 2; reason: memory resource utilization (percentage of request) above target
$ kubectl top pod hpa-mem-demo-66944b79bf-tqrn9
NAME                            CPU(cores)   MEMORY(bytes)
hpa-mem-demo-66944b79bf-tqrn9   0m           41Mi
|
You can see that the memory usage has exceeded the 60% threshold we set, and that the HPA resource object has triggered an automatic expansion to two copies.
1
2
3
4
|
$ kubectl get pods -l app=nginx
NAME                            READY   STATUS    RESTARTS   AGE
hpa-mem-demo-66944b79bf-8m4d9   1/1     Running   0          2m51s
hpa-mem-demo-66944b79bf-tqrn9   1/1     Running   0          8m11s
|
When the memory is freed, the controller-manager scales after 5 minutes by default, and the memory-based HPA operation is completed here.
Based on custom metrics
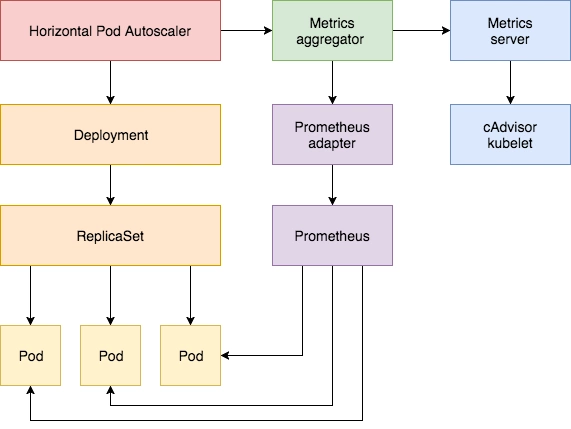
In addition to automatic scaling based on CPU and memory, we can also do it based on custom monitoring metrics. This is done using the Prometheus Adapter, which is used to monitor the application load and various metrics of the cluster itself, and the Prometheus Adapter can help us use the metrics collected by Prometheus and use them to develop a scaling strategy, which are exposed through the APIServer These metrics are exposed through the APIServer, and the HPA resource object can be easily used directly.
First, we deploy a sample application on which to test the Prometheus metrics autoscaling, with the following resource manifest file: (hpa-prome-demo.yaml)
 1
 2
 3
 4
 5
 6
 7
 8
 9
10
11
12
13
14
15
16
17
18
19
20
21
22
23
24
25
26
27
28
29
30
31
32
33
34
35
36
37
38
39
40
41
|
apiVersion: apps/v1
kind: Deployment
metadata:
  name: hpa-prom-demo
spec:
  selector:
    matchLabels:
      app: nginx-server
  template:
    metadata:
      labels:
        app: nginx-server
    spec:
      containers:
      - name: nginx-demo
        image: cnych/nginx-vts:v1.0
        resources:
          limits:
            cpu: 50m
          requests:
            cpu: 50m
        ports:
        - containerPort: 80
          name: http
---
apiVersion: v1
kind: Service
metadata:
  name: hpa-prom-demo
  annotations:
    prometheus.io/scrape: "true"
    prometheus.io/port: "80"
    prometheus.io/path: "/status/format/prometheus"
spec:
  ports:
  - port: 80
    targetPort: 80
    name: http
  selector:
    app: nginx-server
  type: NodePort
|
Here we are deploying an application that exposes the nginx-vts metric on the /status/format/prometheus endpoint on port 80. We have already configured the auto-discovery of Endpoints in Prometheus, so we directly configure it in the annotations of the Service object. so that we can collect the metric data in Prometheus. For testing purposes, we will use a Service of type NodePort here, and now create the above resource object directly as follows.
 1
 2
 3
 4
 5
 6
 7
 8
 9
10
|
$ kubectl apply -f hpa-prome-demo.yaml
deployment.apps/hpa-prom-demo created
service/hpa-prom-demo created
$ kubectl get pods -l app=nginx-server
NAME                             READY   STATUS    RESTARTS   AGE
hpa-prom-demo-755bb56f85-lvksr   1/1     Running   0          4m52s
$ kubectl get svc
NAME            TYPE        CLUSTER-IP       EXTERNAL-IP   PORT(S)        AGE
hpa-prom-demo   NodePort    10.101.210.158   <none>        80:32408/TCP   5m44s
......
|
After deployment we can test if the application works and if the indicator data interface can be obtained properly using the following commands.
 1
 2
 3
 4
 5
 6
 7
 8
 9
10
11
12
13
14
15
16
17
18
19
20
21
22
23
24
25
26
27
28
29
30
31
32
33
34
35
36
|
$ curl http://k8s.qikqiak.com:32408
<!DOCTYPE html>
<html>
<head>
<title>Welcome to nginx!</title>
<style>
body {
width: 35em;
margin: 0 auto;
font-family: Tahoma, Verdana, Arial, sans-serif;
}
</style>
</head>
<body>
<h1>Welcome to nginx!</h1>
<p>If you see this page, the nginx web server is successfully installed and
working. Further configuration is required.</p>
<p>For online documentation and support please refer to
<a href="http://nginx.org/">nginx.org</a>.<br/>
Commercial support is available at
<a href="http://nginx.com/">nginx.com</a>.</p>
<p><em>Thank you for using nginx.</em></p>
</body>
</html>
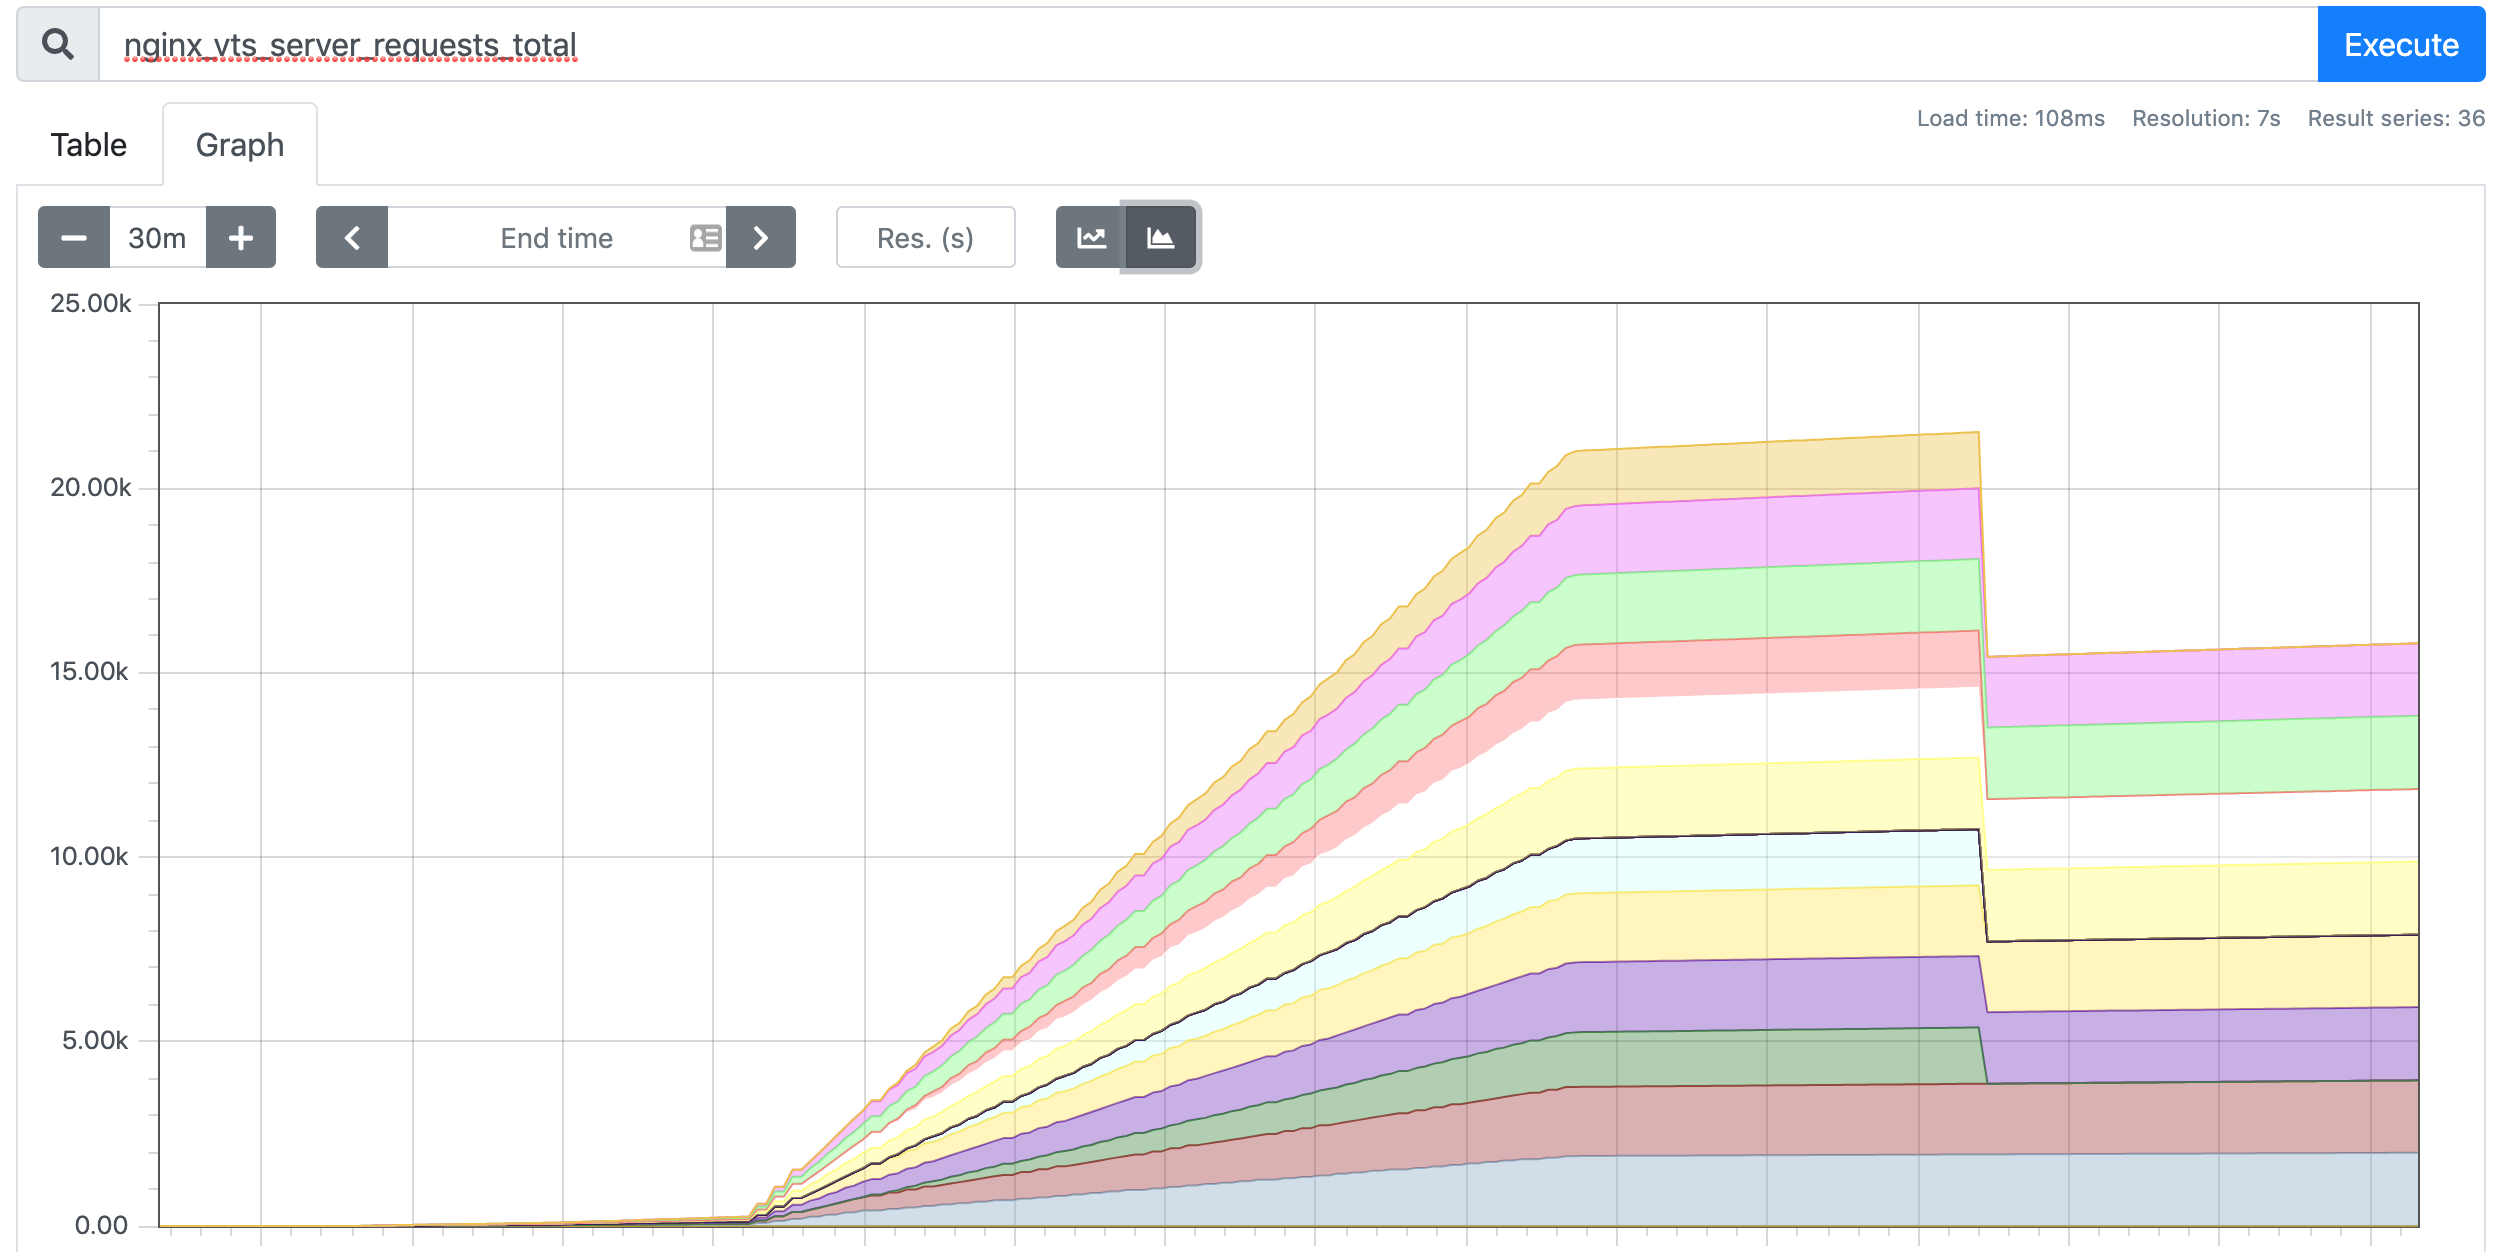
$ curl http://k8s.qikqiak.com:32408/status/format/prometheus
# HELP nginx_vts_info Nginx info
# TYPE nginx_vts_info gauge
nginx_vts_info{hostname="hpa-prom-demo-755bb56f85-lvksr",version="1.13.12"} 1
# HELP nginx_vts_start_time_seconds Nginx start time
# TYPE nginx_vts_start_time_seconds gauge
nginx_vts_start_time_seconds 1586240091.623
# HELP nginx_vts_main_connections Nginx connections
# TYPE nginx_vts_main_connections gauge
......
|
Of the above metrics, we are more interested in the nginx_vts_server_requests_total metric, which represents the total number of requests and is a Counter type metric that we will use to determine whether our application needs to be automatically scaled up or down.
Next we install Prometheus-Adapter into the cluster and add a rule to track requests from Pods. We can use any metric from Prometheus for HPA, but only if you get it (including the metric name and its corresponding value) via a query statement.
Here we define a rule as shown below.
 1
 2
 3
 4
 5
 6
 7
 8
 9
10
11
12
13
|
rules:
- seriesQuery: 'nginx_vts_server_requests_total'
seriesFilters: []
resources:
overrides:
kubernetes_namespace:
resource: namespace
kubernetes_pod_name:
resource: pod
name:
matches: "^(.*)_total"
as: "${1}_per_second"
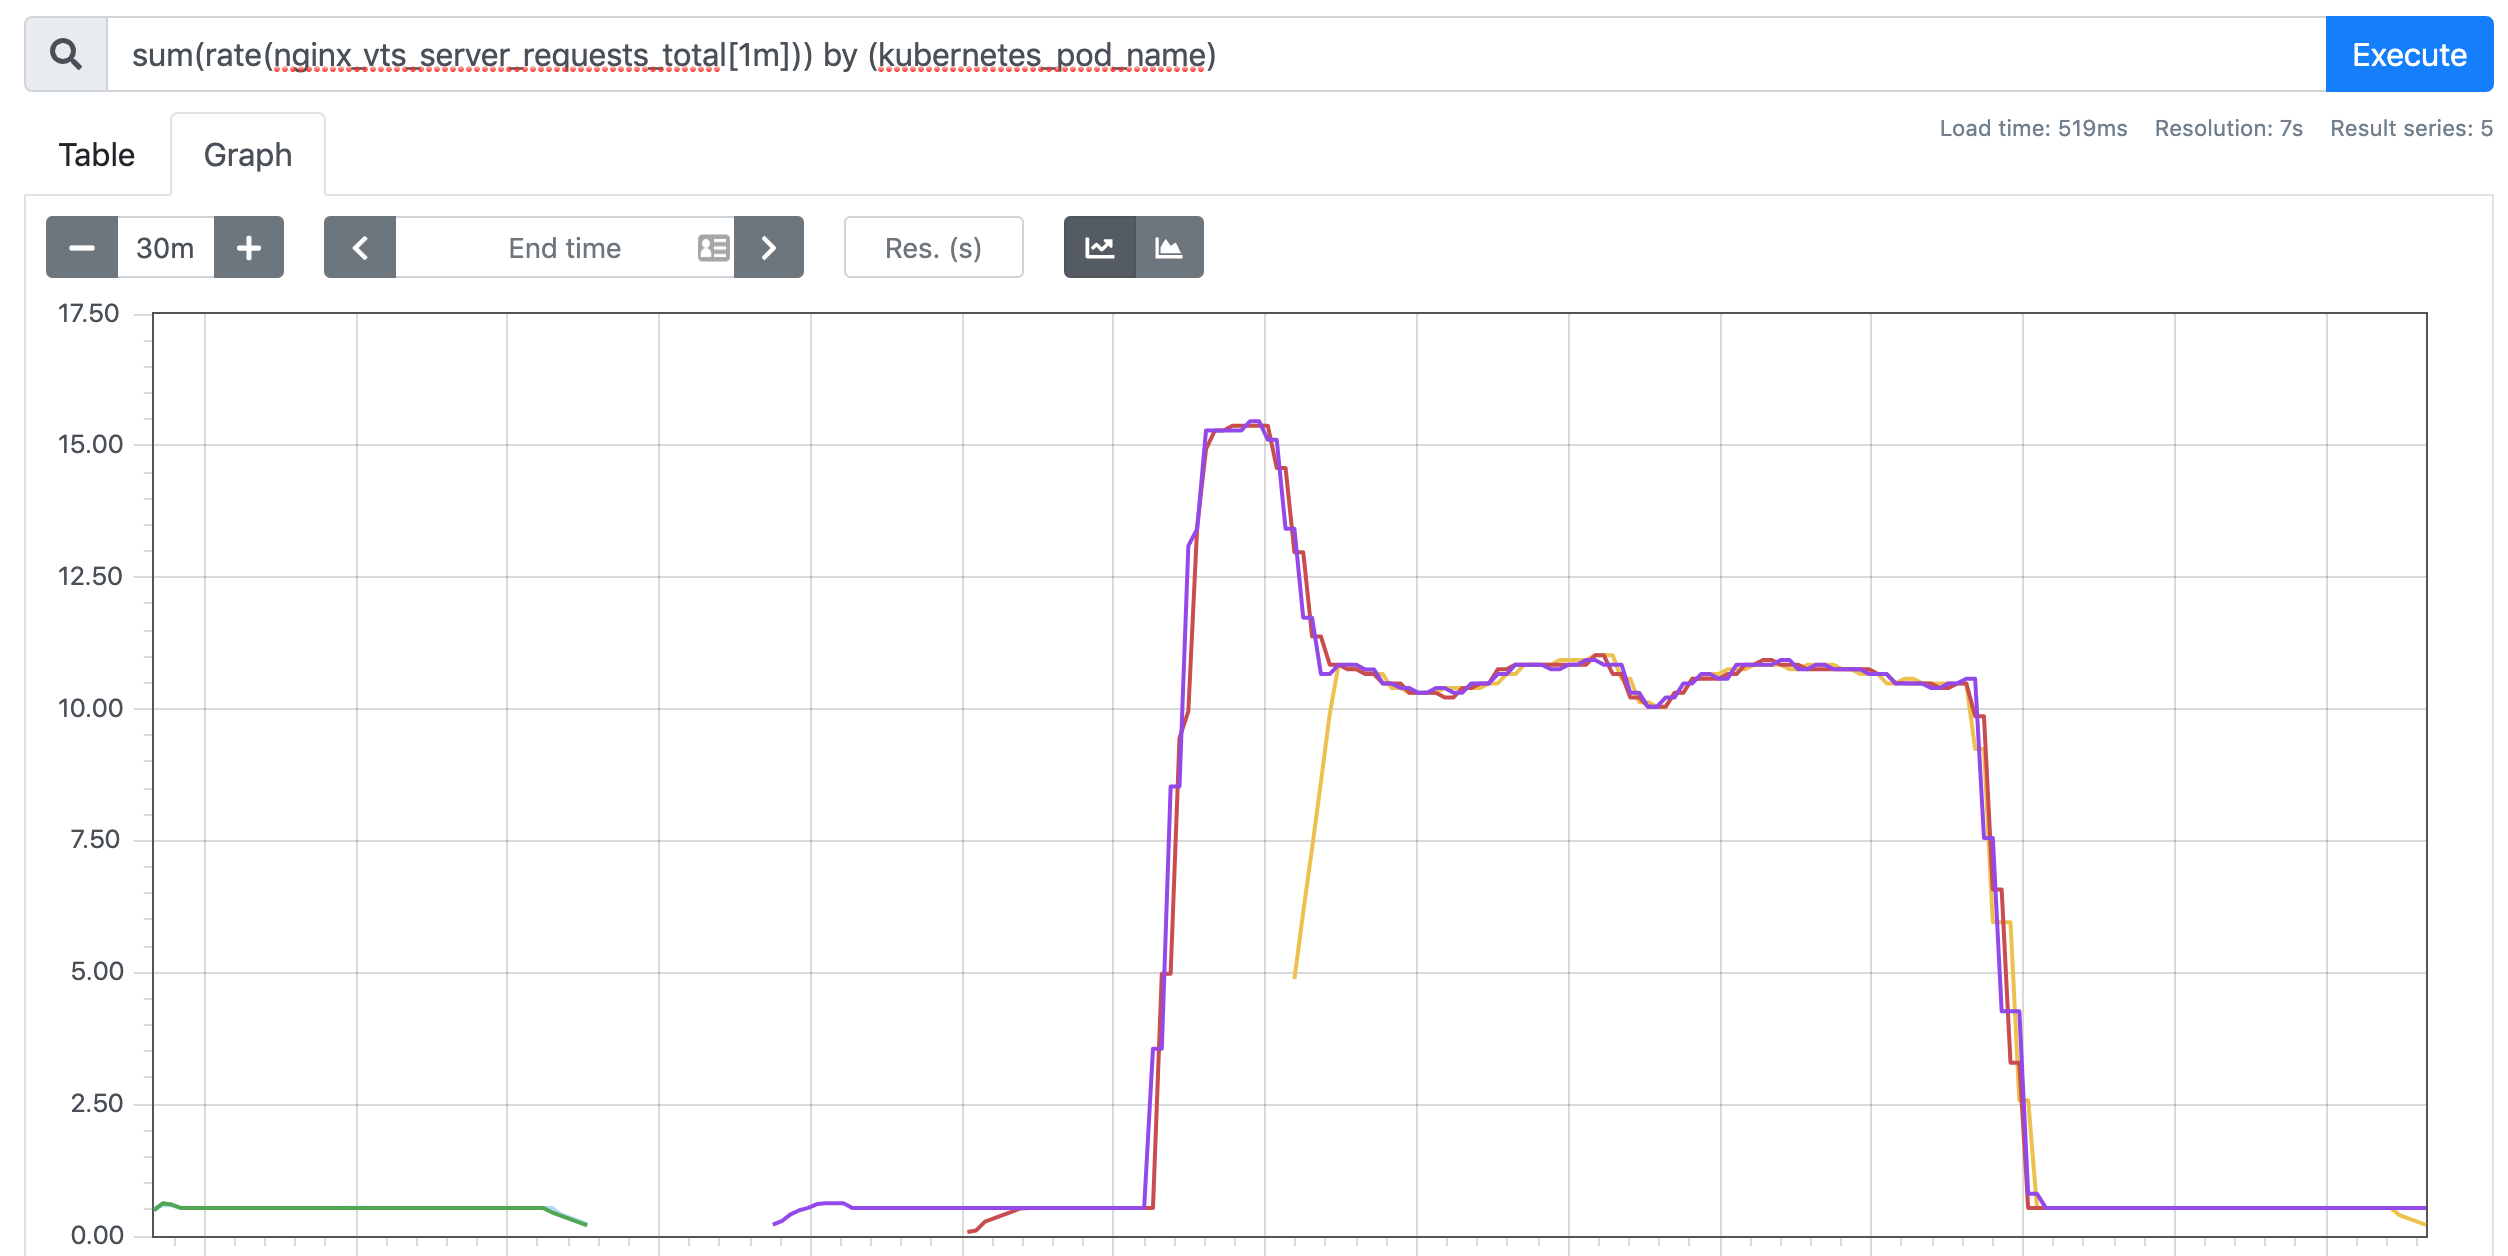
metricsQuery: (sum(rate(<<.Series>>{<<.LabelMatchers>>}[1m])) by (<<.GroupBy>>))
|
This is a Prometheus query with parameters, where.
seriesQuery : a query statement for Prometheus, all metrics queried by this query statement can be used in HPAseriesFilters : The query may contain indicators that are not needed and can be filtered out by it.resources: The metrics queried by seriesQuery are only metrics. If you need to query the metrics of a pod, you must use its name and namespace as the label of the metrics to query, resources is to associate the label of the metrics with the resource type of k8s, the most common ones are pod and namespace. There are two ways to add tags, one is overrides and the other is template.
overrides: It associates the tags in the metrics with k8s resources. The above example associates the pod and namespace tags in the metrics with the pods and namespaces in k8s, because both pods and namespaces are part of the core api group, so there is no need to specify an api group. When we query the metrics for a pod, it automatically adds the pod name and namespace as tags to the query criteria. For example, nginx: {group: "apps", resource: "deployment"} is written to associate the nginx tag in the metric with the deployment resource in the apps api group.- template: via the go template form. For example,
template: "kube_<<.Group>>_<<.Resource>>" means that if <<.Group>> is apps and <<.Resource>> is deployment, then it is associating the kube_apps_deployment tag in the metric with the deployment resource. and the deployment resource.
name: This is used to rename the metric. The reason for renaming the metric is that some metrics are incremental, such as those ending in total. These metrics are meaningless for HPA, we usually calculate its rate and use the rate as the value, then the name can not end with total, so we need to rename it.
matches : match metric names by regular expressions, can be groupedas : The default value is $1, which is the first grouping. An empty as means use the default value.
metricsQuery : This is the query statement of Prometheus, the previous seriesQuery query is to get the HPA metrics. When we want to check the value of a metric, we have to do it with the query statement it specifies. You can see that the query statement uses rates and grouping, which is the solution to the problem of only increasing the metric mentioned above.
Series: indicates the name of the indicatorLabelMatchers : additional labels, currently only pod and namespace are available, so we have to use resources to associate them beforeGroupBy: This is the pod name, which also needs to be associated with resources.
Next, we deploy the Prometheus Adapter via Helm Chart by creating a new hpa-prome-adapter-values.yaml file to override the default Values values, as follows.
 1
 2
 3
 4
 5
 6
 7
 8
 9
10
11
12
13
14
15
16
17
|
rules:
  default: false
  custom:
  - seriesQuery: 'nginx_vts_server_requests_total'
    resources:
      overrides:
        kubernetes_namespace:
          resource: namespace
        kubernetes_pod_name:
          resource: pod
    name:
      matches: "^(.*)_total"
      as: "${1}_per_second"
    metricsQuery: (sum(rate(<<.Series>>{<<.LabelMatchers>>}[1m])) by (<<.GroupBy>>))

prometheus:
  url: http://thanos-querier.kube-mon.svc.cluster.local
|
Here we add a rules rule and specify the address of Prometheus, we are using the Thanos deployed Promethues cluster here, so we use the address of Querier. Install it with one click using the following command.
 1
 2
 3
 4
 5
 6
 7
 8
 9
10
11
12
|
$ helm install prometheus-adapter stable/prometheus-adapter -n kube-mon -f hpa-prome-adapter-values.yaml
NAME: prometheus-adapter
LAST DEPLOYED: Tue Apr  7 15:26:36 2020
NAMESPACE: kube-mon
STATUS: deployed
REVISION: 1
TEST SUITE: None
NOTES:
prometheus-adapter has been deployed.
In a few minutes you should be able to list metrics using the following command(s):

  kubectl get --raw /apis/custom.metrics.k8s.io/v1beta1
|
After waiting a short while for the installation to complete, you can use the following command to check if it has taken effect.
 1
 2
 3
 4
 5
 6
 7
 8
 9
10
11
12
13
14
15
16
17
18
19
20
21
22
23
24
25
26
27
28
29
|
$ kubectl get pods -n kube-mon -l app=prometheus-adapter
NAME                                  READY   STATUS    RESTARTS   AGE
prometheus-adapter-58b559fc7d-l2j6t   1/1     Running   0          3m21s
$  kubectl get --raw="/apis/custom.metrics.k8s.io/v1beta1" | jq
{
  "kind": "APIResourceList",
  "apiVersion": "v1",
  "groupVersion": "custom.metrics.k8s.io/v1beta1",
  "resources": [
    {
      "name": "namespaces/nginx_vts_server_requests_per_second",
      "singularName": "",
      "namespaced": false,
      "kind": "MetricValueList",
      "verbs": [
        "get"
      ]
    },
    {
      "name": "pods/nginx_vts_server_requests_per_second",
      "singularName": "",
      "namespaced": true,
      "kind": "MetricValueList",
      "verbs": [
        "get"
      ]
    }
  ]
}
|
We can see that the nginx_vts_server_requests_per_second metric is available. Now, let’s check the current value of the metric.
 1
 2
 3
 4
 5
 6
 7
 8
 9
10
11
12
13
14
15
16
17
18
19
20
21
22
|
$ kubectl get --raw "/apis/custom.metrics.k8s.io/v1beta1/namespaces/default/pods/*/nginx_vts_server_requests_per_second" | jq .
{
  "kind": "MetricValueList",
  "apiVersion": "custom.metrics.k8s.io/v1beta1",
  "metadata": {
    "selfLink": "/apis/custom.metrics.k8s.io/v1beta1/namespaces/default/pods/%2A/nginx_vts_server_requests_per_second"
  },
  "items": [
    {
      "describedObject": {
        "kind": "Pod",
        "namespace": "default",
        "name": "hpa-prom-demo-755bb56f85-lvksr",
        "apiVersion": "/v1"
      },
      "metricName": "nginx_vts_server_requests_per_second",
      "timestamp": "2020-04-07T09:45:45Z",
      "value": "527m",
      "selector": null
    }
  ]
}
|
A message like the one above indicates that the configuration has been successful. Next, we deploy a HAP resource object for the above custom metrics as follows: (hpa-prome.yaml)
 1
 2
 3
 4
 5
 6
 7
 8
 9
10
11
12
13
14
15
16
|
apiVersion: autoscaling/v2beta1
kind: HorizontalPodAutoscaler
metadata:
  name: nginx-custom-hpa
spec:
  scaleTargetRef:
    apiVersion: apps/v1
    kind: Deployment
    name: hpa-prom-demo
  minReplicas: 2
  maxReplicas: 5
  metrics:
  - type: Pods
    pods:
      metricName: nginx_vts_server_requests_per_second
      targetAverageValue: 10
|
If the number of requests exceeds 10 per second, the application will be scaled up. Create the resource object above directly.
 1
 2
 3
 4
 5
 6
 7
 8
 9
10
11
12
13
14
15
16
17
18
19
20
21
22
23
|
$ kubectl apply -f hpa-prome.yaml
horizontalpodautoscaler.autoscaling/nginx-custom-hpa created
$ kubectl describe hpa nginx-custom-hpa
Name:                                              nginx-custom-hpa
Namespace:                                         default
Labels:                                            <none>
Annotations:                                       kubectl.kubernetes.io/last-applied-configuration:
                                                     {"apiVersion":"autoscaling/v2beta1","kind":"HorizontalPodAutoscaler","metadata":{"annotations":{},"name":"nginx-custom-hpa","namespace":"d...
CreationTimestamp:                                 Tue, 07 Apr 2020 17:54:55 +0800
Reference:                                         Deployment/hpa-prom-demo
Metrics:                                           ( current / target )
  "nginx_vts_server_requests_per_second" on pods:  <unknown> / 10
Min replicas:                                      2
Max replicas:                                      5
Deployment pods:                                   1 current / 2 desired
Conditions:
  Type         Status  Reason            Message
  ----         ------  ------            -------
  AbleToScale  True    SucceededRescale  the HPA controller was able to update the target scale to 2
Events:
  Type    Reason             Age   From                       Message
  ----    ------             ----  ----                       -------
  Normal  SuccessfulRescale  7s    horizontal-pod-autoscaler  New size: 2; reason: Current number of replicas below Spec.MinReplicas
|
You can see that the HPA object is already in effect and will apply the minimum number of copies 2, so a new Pod copy will be added:.
1
2
3
4
|
$ kubectl get pods -l app=nginx-server
NAME                             READY   STATUS    RESTARTS   AGE
hpa-prom-demo-755bb56f85-s5dzf   1/1     Running   0          67s
hpa-prom-demo-755bb56f85-wbpfr   1/1     Running   0          3m30s
|
Next, we also pressure test the application.
1
|
$ while true; do wget -q -O- http://k8s.qikqiak.com:32408; done
|
Open another terminal to observe the changes in the HPA object.
 1
 2
 3
 4
 5
 6
 7
 8
 9
10
11
12
13
14
15
16
17
18
19
20
21
22
23
24
25
26
27
|
$ kubectl get hpa
NAME               REFERENCE                  TARGETS     MINPODS   MAXPODS   REPLICAS   AGE
nginx-custom-hpa   Deployment/hpa-prom-demo   14239m/10   2         5         2          4m27s
$ kubectl describe hpa nginx-custom-hpa
Name:                                              nginx-custom-hpa
Namespace:                                         default
Labels:                                            <none>
Annotations:                                       kubectl.kubernetes.io/last-applied-configuration:
                                                     {"apiVersion":"autoscaling/v2beta1","kind":"HorizontalPodAutoscaler","metadata":{"annotations":{},"name":"nginx-custom-hpa","namespace":"d...
CreationTimestamp:                                 Tue, 07 Apr 2020 17:54:55 +0800
Reference:                                         Deployment/hpa-prom-demo
Metrics:                                           ( current / target )
  "nginx_vts_server_requests_per_second" on pods:  14308m / 10
Min replicas:                                      2
Max replicas:                                      5
Deployment pods:                                   3 current / 3 desired
Conditions:
  Type            Status  Reason              Message
  ----            ------  ------              -------
  AbleToScale     True    ReadyForNewScale    recommended size matches current size
  ScalingActive   True    ValidMetricFound    the HPA was able to successfully calculate a replica count from pods metric nginx_vts_server_requests_per_second
  ScalingLimited  False   DesiredWithinRange  the desired count is within the acceptable range
Events:
  Type    Reason             Age   From                       Message
  ----    ------             ----  ----                       -------
  Normal  SuccessfulRescale  5m2s  horizontal-pod-autoscaler  New size: 2; reason: Current number of replicas below Spec.MinReplicas
  Normal  SuccessfulRescale  61s   horizontal-pod-autoscaler  New size: 3; reason: pods metric nginx_vts_server_requests_per_second above target
|
You can see that the data of indicator nginx_vts_server_requests_per_second has exceeded the threshold and triggered the expansion action, the number of replicas became 3, but it is difficult to continue the expansion, this is because our while command above is not fast enough, 3 replicas can fully meet the threshold of no more than 10 requests per second.
If we need to test better, we can use some compression testing tools, such as ab, fortio, etc. When we interrupt the test, the default is to automatically shrink the capacity after 5 minutes.
 1
 2
 3
 4
 5
 6
 7
 8
 9
10
11
12
13
14
15
16
17
18
19
20
21
22
23
24
25
|
$ kubectl describe hpa nginx-custom-hpa
Name:                                              nginx-custom-hpa
Namespace:                                         default
Labels:                                            <none>
Annotations:                                       kubectl.kubernetes.io/last-applied-configuration:
                                                     {"apiVersion":"autoscaling/v2beta1","kind":"HorizontalPodAutoscaler","metadata":{"annotations":{},"name":"nginx-custom-hpa","namespace":"d...
CreationTimestamp:                                 Tue, 07 Apr 2020 17:54:55 +0800
Reference:                                         Deployment/hpa-prom-demo
Metrics:                                           ( current / target )
  "nginx_vts_server_requests_per_second" on pods:  533m / 10
Min replicas:                                      2
Max replicas:                                      5
Deployment pods:                                   2 current / 2 desired
Conditions:
  Type            Status  Reason            Message
  ----            ------  ------            -------
  AbleToScale     True    ReadyForNewScale  recommended size matches current size
  ScalingActive   True    ValidMetricFound  the HPA was able to successfully calculate a replica count from pods metric nginx_vts_server_requests_per_second
  ScalingLimited  True    TooFewReplicas    the desired replica count is less than the minimum replica count
Events:
  Type    Reason             Age   From                       Message
  ----    ------             ----  ----                       -------
  Normal  SuccessfulRescale  23m   horizontal-pod-autoscaler  New size: 2; reason: Current number of replicas below Spec.MinReplicas
  Normal  SuccessfulRescale  19m   horizontal-pod-autoscaler  New size: 3; reason: pods metric nginx_vts_server_requests_per_second above target
  Normal  SuccessfulRescale  4m2s  horizontal-pod-autoscaler  New size: 2; reason: All metrics below target
|
At this point we are done with the automatic scaling of the application using custom metrics. If Prometheus is installed outside of our Kubernetes cluster, simply ensure that the queried endpoint is accessible from the cluster and update it in the adapter’s deployment manifest. In more complex scenarios, you can get multiple metrics to use in combination to develop a scaling strategy.