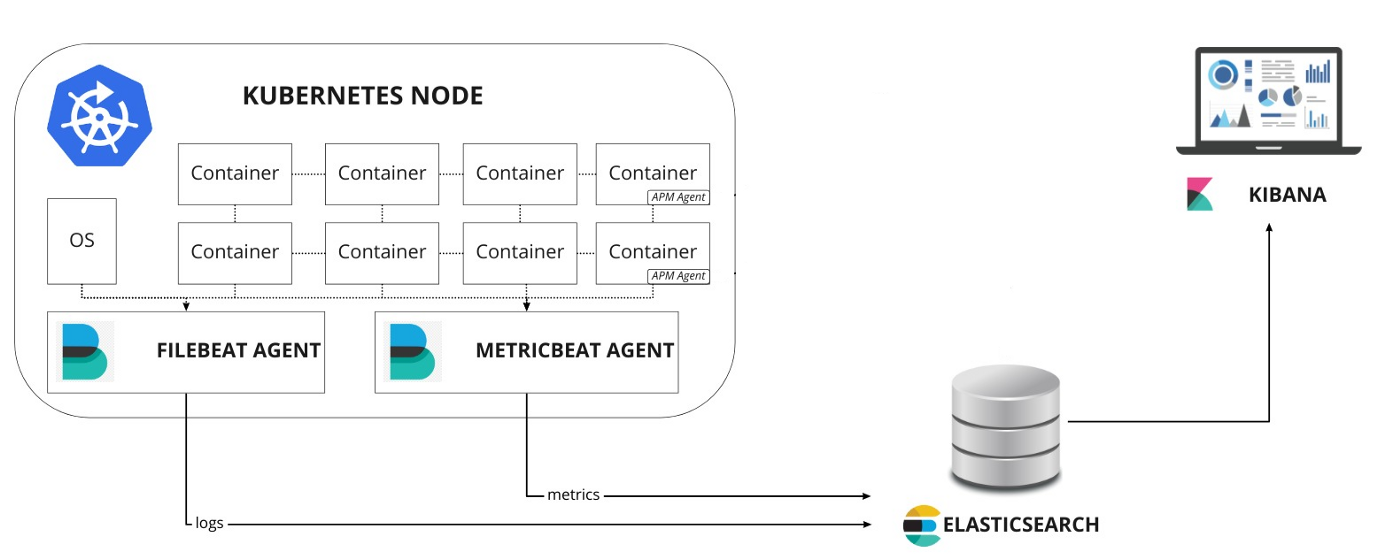
In this series of articles, we will learn how to use the Elastic technology stack to build a monitoring environment for Kubernetes. The goal of observability is to provide an operations tool for production environments to detect when a service is unavailable (e.g., if the service is down, has errors, or is slow to respond) and to keep some troubleshooting information to help us pinpoint the problem. In summary, there are 3 main areas.
- Monitoring metrics provide time-series data for each component of the system, such as CPU, memory, disk, network and other information, which can usually be used to show the overall status of the system and detect abnormal behavior at a certain time
- Logs provide operations and maintenance staff with a data to analyze some of the system’s misbehavior, usually collecting system, service and application logs in the same database centrally
- Tracing or APM (Application Performance Monitoring) provides a more detailed view of the application and can log every request and step performed by the service (e.g. HTTP calls, database queries, etc.) By tracing this data, we can detect the performance of the service and improve or fix our system accordingly.

In this article, we will use the ElasticSearch, Kibana, Filebeat, Metricbeat, and APM-Server technology stack in a Kubernetes cluster to monitor the system environment. To better understand the configuration of these components, we will install them here by hand using a resource manifest file, but we can also use other tools such as Helm to quickly install the configuration.
Next, we’ll learn how to build a Kubernetes monitoring stack using Elastic technology. Our test environment here is a Kubernetes v1.16.2 cluster, where we deploy all resource objects in a namespace called elastic for ease of management.
1
2
|
$ kubectl create ns elastic
namespace/elastic created
|
1. sample application
Here we start by deploying a sample application developed using SpringBoot and MongoDB. First deploy a MongoDB application with the corresponding resource manifest file as shown below.
 1
 2
 3
 4
 5
 6
 7
 8
 9
10
11
12
13
14
15
16
17
18
19
20
21
22
23
24
25
26
27
28
29
30
31
32
33
34
35
36
37
38
39
40
41
42
43
44
45
46
47
48
49
50
|
# mongo.yml
---
apiVersion: v1
kind: Service
metadata:
  name: mongo
  namespace: elastic
  labels:
    app: mongo
spec:
  ports:
  - port: 27017
    protocol: TCP
  selector:
    app: mongo
---
apiVersion: apps/v1
kind: StatefulSet
metadata:
  namespace: elastic
  name: mongo
  labels:
    app: mongo
spec:
  serviceName: "mongo"
  selector:
    matchLabels:
      app: mongo
  template:
    metadata:
      labels:
        app: mongo
    spec:
      containers:
      - name: mongo
        image: mongo
        ports:
        - containerPort: 27017
        volumeMounts:
        - name: data
          mountPath: /data/db
  volumeClaimTemplates:
  - metadata:
      name: data
    spec:
      accessModes: [ "ReadWriteOnce" ]
      storageClassName: rook-ceph-block  # 使用支持 RWO 的 StorageClass
      resources:
        requests:
          storage: 1Gi
|
Here we use a StorageClass object named rook-ceph-block to create the PV automatically, which can be replaced with a StorageClass object that supports RWO in your own cluster. This can be created directly using the resource list above.
1
2
3
4
5
6
|
$ kubectl apply -f mongo.yml
service/mongo created
statefulset.apps/mongo created
$ kubectl get pods -n elastic -l app=mongo
NAME      READY   STATUS    RESTARTS   AGE
mongo-0   1/1     Running   0          34m
|
The mongodb deployment is successful until the Pod becomes Running. Next, we deploy the SpringBoot API application. Here we expose the service through a service of type NodePort, and the corresponding resource manifest file is shown below.
 1
 2
 3
 4
 5
 6
 7
 8
 9
10
11
12
13
14
15
16
17
18
19
20
21
22
23
24
25
26
27
28
29
30
31
32
33
34
35
36
37
38
39
40
41
42
|
# spring-boot-simple.yml
---
apiVersion: v1
kind: Service
metadata:
  namespace: elastic
  name: spring-boot-simple
  labels:
    app: spring-boot-simple
spec:
  type: NodePort
  ports:
  - port: 8080
    protocol: TCP
  selector:
    app: spring-boot-simple
---
apiVersion: apps/v1
kind: Deployment
metadata:
  namespace: elastic
  name: spring-boot-simple
  labels:
    app: spring-boot-simple
spec:
  replicas: 1
  selector:
    matchLabels:
      app: spring-boot-simple
  template:
    metadata:
      labels:
        app: spring-boot-simple
    spec:
      containers:
      - image: cnych/spring-boot-simple:0.0.1-SNAPSHOT
        name: spring-boot-simple
        env:
        - name: SPRING_DATA_MONGODB_HOST  # 指定MONGODB地址
          value: mongo
        ports:
        - containerPort: 8080
|
Again it is straightforward to create the application for the above application at
1
2
3
4
5
6
7
8
9
|
$ kubectl apply -f spring-boot-simple.yaml
service/spring-boot-simple created
deployment.apps/spring-boot-simple created
$ kubectl get pods -n elastic -l app=spring-boot-simple
NAME                                  READY   STATUS    RESTARTS   AGE
spring-boot-simple-64795494bf-hqpcj   1/1     Running   0          24m
$ kubectl get svc -n elastic -l app=spring-boot-simple
NAME                 TYPE       CLUSTER-IP      EXTERNAL-IP   PORT(S)          AGE
spring-boot-simple   NodePort   10.109.55.134   <none>        8080:31847/TCP   84s
|
Once the application has been deployed, we can access the application via the address http://host:31847, which can be simply tested with the following command.
1
2
|
$ curl -X GET  http://k8s.qikqiak.com:31847/
Greetings from Spring Boot!
|
Send a POST request.
1
2
|
$ curl -X POST http://k8s.qikqiak.com:31847/message -d 'hello world'
{"id":"5ef55c130d53190001bf74d2","message":"hello+world=","postedAt":"2020-06-26T02:23:15.860+0000"}
|
Get all message data.
1
2
|
$ curl -X GET http://k8s.qikqiak.com:31847/message
[{"id":"5ef55c130d53190001bf74d2","message":"hello+world=","postedAt":"2020-06-26T02:23:15.860+0000"}]
|
2. ElasticSearch clusters
To build a monitoring stack for Elastic technologies, of course first we need to deploy ElasticSearch, which is the database used to store all the metrics, logs and traces, here we form a cluster through 3 scalable nodes with different roles.
2.1 Installing ElasticSearch Master Node
Set the first node of the cluster as the Master node to control the whole cluster. First, create a ConfigMap object to describe some configuration information of the cluster to facilitate the configuration of the ElasticSearch master node into the cluster and enable the security authentication function. The corresponding resource list file is shown below.
 1
 2
 3
 4
 5
 6
 7
 8
 9
10
11
12
13
14
15
16
17
18
19
20
21
22
23
24
25
26
27
|
# elasticsearch-master.configmap.yaml
---
apiVersion: v1
kind: ConfigMap
metadata:
  namespace: elastic
  name: elasticsearch-master-config
  labels:
    app: elasticsearch
    role: master
data:
  elasticsearch.yml: |-
    cluster.name: ${CLUSTER_NAME}
    node.name: ${NODE_NAME}
    discovery.seed_hosts: ${NODE_LIST}
    cluster.initial_master_nodes: ${MASTER_NODES}

    network.host: 0.0.0.0

    node:
      master: true
      data: false
      ingest: false

    xpack.security.enabled: true
    xpack.monitoring.collection.enabled: true
---
|
Then a Service object is created and under the Master node we only need to communicate through the 9300 port used for cluster communication. The resource list file is shown below.
 1
 2
 3
 4
 5
 6
 7
 8
 9
10
11
12
13
14
15
16
17
18
|
# elasticsearch-master.service.yaml
---
apiVersion: v1
kind: Service
metadata:
  namespace: elastic
  name: elasticsearch-master
  labels:
    app: elasticsearch
    role: master
spec:
  ports:
  - port: 9300
    name: transport
  selector:
    app: elasticsearch
    role: master
---
|
Finally a Deployment object is used to define the Master node application and the resource list file is shown below.
 1
 2
 3
 4
 5
 6
 7
 8
 9
10
11
12
13
14
15
16
17
18
19
20
21
22
23
24
25
26
27
28
29
30
31
32
33
34
35
36
37
38
39
40
41
42
43
44
45
46
47
48
49
50
51
52
53
54
|
# elasticsearch-master.deployment.yaml
---
apiVersion: apps/v1
kind: Deployment
metadata:
  namespace: elastic
  name: elasticsearch-master
  labels:
    app: elasticsearch
    role: master
spec:
  replicas: 1
  selector:
    matchLabels:
      app: elasticsearch
      role: master
  template:
    metadata:
      labels:
        app: elasticsearch
        role: master
    spec:
      containers:
      - name: elasticsearch-master
        image: docker.elastic.co/elasticsearch/elasticsearch:7.8.0
        env:
        - name: CLUSTER_NAME
          value: elasticsearch
        - name: NODE_NAME
          value: elasticsearch-master
        - name: NODE_LIST
          value: elasticsearch-master,elasticsearch-data,elasticsearch-client
        - name: MASTER_NODES
          value: elasticsearch-master
        - name: "ES_JAVA_OPTS"
          value: "-Xms512m -Xmx512m"
        ports:
        - containerPort: 9300
          name: transport
        volumeMounts:
        - name: config
          mountPath: /usr/share/elasticsearch/config/elasticsearch.yml
          readOnly: true
          subPath: elasticsearch.yml
        - name: storage
          mountPath: /data
      volumes:
      - name: config
        configMap:
          name: elasticsearch-master-config
      - name: "storage"
        emptyDir:
          medium: ""
---
|
It is straightforward to create the 3 resource objects above.
 1
 2
 3
 4
 5
 6
 7
 8
 9
10
|
$ kubectl apply  -f elasticsearch-master.configmap.yaml \
                 -f elasticsearch-master.service.yaml \
                 -f elasticsearch-master.deployment.yaml

configmap/elasticsearch-master-config created
service/elasticsearch-master created
deployment.apps/elasticsearch-master created
$ kubectl get pods -n elastic -l app=elasticsearch
NAME                                    READY   STATUS    RESTARTS   AGE
elasticsearch-master-6f666cbbd-r9vtx    1/1     Running   0          111m
|
The master node is installed successfully until the Pod becomes Running.
2.2 Installing the ElasticSearch data node
Now we need to install the cluster’s data node, which is responsible for hosting the cluster’s data and executing queries.
As with the master node, we use a ConfigMap object to configure our data node.
 1
 2
 3
 4
 5
 6
 7
 8
 9
10
11
12
13
14
15
16
17
18
19
20
21
22
23
24
25
26
27
|
# elasticsearch-data.configmap.yaml
---
apiVersion: v1
kind: ConfigMap
metadata:
  namespace: elastic
  name: elasticsearch-data-config
  labels:
    app: elasticsearch
    role: data
data:
  elasticsearch.yml: |-
    cluster.name: ${CLUSTER_NAME}
    node.name: ${NODE_NAME}
    discovery.seed_hosts: ${NODE_LIST}
    cluster.initial_master_nodes: ${MASTER_NODES}

    network.host: 0.0.0.0

    node:
      master: false
      data: true
      ingest: false

    xpack.security.enabled: true
    xpack.monitoring.collection.enabled: true
---
|
You can see that it is very similar to the master configuration above, but note the property node.data=true.
Again, you only need to communicate with the other nodes through port 9300.
 1
 2
 3
 4
 5
 6
 7
 8
 9
10
11
12
13
14
15
16
17
18
|
# elasticsearch-data.service.yaml
---
apiVersion: v1
kind: Service
metadata:
  namespace: elastic
  name: elasticsearch-data
  labels:
    app: elasticsearch
    role: data
spec:
  ports:
  - port: 9300
    name: transport
  selector:
    app: elasticsearch
    role: data
---
|
Finally a controller for the StatefulSet is created, because there may be multiple data nodes, each of which does not have the same data and needs to be stored separately, so a volumeClaimTemplates is also used to create the storage volumes separately, and the corresponding resource list file is shown below.
 1
 2
 3
 4
 5
 6
 7
 8
 9
10
11
12
13
14
15
16
17
18
19
20
21
22
23
24
25
26
27
28
29
30
31
32
33
34
35
36
37
38
39
40
41
42
43
44
45
46
47
48
49
50
51
52
53
54
55
56
57
58
59
60
|
# elasticsearch-data.statefulset.yaml
---
apiVersion: apps/v1
kind: StatefulSet
metadata:
  namespace: elastic
  name: elasticsearch-data
  labels:
    app: elasticsearch
    role: data
spec:
  serviceName: "elasticsearch-data"
  selector:
    matchLabels:
      app: elasticsearch
      role: data
  template:
    metadata:
      labels:
        app: elasticsearch
        role: data
    spec:
      containers:
      - name: elasticsearch-data
        image: docker.elastic.co/elasticsearch/elasticsearch:7.8.0
        env:
        - name: CLUSTER_NAME
          value: elasticsearch
        - name: NODE_NAME
          value: elasticsearch-data
        - name: NODE_LIST
          value: elasticsearch-master,elasticsearch-data,elasticsearch-client
        - name: MASTER_NODES
          value: elasticsearch-master
        - name: "ES_JAVA_OPTS"
          value: "-Xms1024m -Xmx1024m"
        ports:
        - containerPort: 9300
          name: transport
        volumeMounts:
        - name: config
          mountPath: /usr/share/elasticsearch/config/elasticsearch.yml
          readOnly: true
          subPath: elasticsearch.yml
        - name: elasticsearch-data-persistent-storage
          mountPath: /data/db
      volumes:
      - name: config
        configMap:
          name: elasticsearch-data-config
  volumeClaimTemplates:
  - metadata:
      name: elasticsearch-data-persistent-storage
    spec:
      accessModes: [ "ReadWriteOnce" ]
      storageClassName: rook-ceph-block
      resources:
        requests:
          storage: 50Gi
---
|
Simply create the resource object above.
1
2
3
4
5
6
7
|
$ kubectl apply -f elasticsearch-data.configmap.yaml \
                -f elasticsearch-data.service.yaml \
                -f elasticsearch-data.statefulset.yaml

configmap/elasticsearch-data-config created
service/elasticsearch-data created
statefulset.apps/elasticsearch-data created
|
Until the Pod turns into a Running state to prove that the node was started successfully.
1
2
3
4
|
$ kubectl get pods -n elastic -l app=elasticsearch
NAME                                    READY   STATUS    RESTARTS   AGE
elasticsearch-data-0                    1/1     Running   0          90m
elasticsearch-master-6f666cbbd-r9vtx    1/1     Running   0          111m
|
2.3 Installing the ElasticSearch client node
Finally, let’s install and configure the ElasticSearch client node, which is responsible for exposing an HTTP interface to pass query data to the data node for data retrieval.
Again, a ConfigMap object is used to configure this node.
 1
 2
 3
 4
 5
 6
 7
 8
 9
10
11
12
13
14
15
16
17
18
19
20
21
22
23
24
25
26
27
|
# elasticsearch-client.configmap.yaml
---
apiVersion: v1
kind: ConfigMap
metadata:
  namespace: elastic
  name: elasticsearch-client-config
  labels:
    app: elasticsearch
    role: client
data:
  elasticsearch.yml: |-
    cluster.name: ${CLUSTER_NAME}
    node.name: ${NODE_NAME}
    discovery.seed_hosts: ${NODE_LIST}
    cluster.initial_master_nodes: ${MASTER_NODES}

    network.host: 0.0.0.0

    node:
      master: false
      data: false
      ingest: true

    xpack.security.enabled: true
    xpack.monitoring.collection.enabled: true
---
|
The client node needs to expose two ports, port 9300 for communication with other nodes in the cluster and port 9200 for the HTTP API. the corresponding Service object is shown below.
 1
 2
 3
 4
 5
 6
 7
 8
 9
10
11
12
13
14
15
16
17
18
19
20
|
# elasticsearch-client.service.yaml
---
apiVersion: v1
kind: Service
metadata:
  namespace: elastic
  name: elasticsearch-client
  labels:
    app: elasticsearch
    role: client
spec:
  ports:
  - port: 9200
    name: client
  - port: 9300
    name: transport
  selector:
    app: elasticsearch
    role: client
---
|
Use a Deployment object to describe the client node.
 1
 2
 3
 4
 5
 6
 7
 8
 9
10
11
12
13
14
15
16
17
18
19
20
21
22
23
24
25
26
27
28
29
30
31
32
33
34
35
36
37
38
39
40
41
42
43
44
45
46
47
48
49
50
51
52
53
54
55
|
# elasticsearch-client.deployment.yaml
---
apiVersion: apps/v1
kind: Deployment
metadata:
  namespace: elastic
  name: elasticsearch-client
  labels:
    app: elasticsearch
    role: client
spec:
  selector:
    matchLabels:
      app: elasticsearch
      role: client
  template:
    metadata:
      labels:
        app: elasticsearch
        role: client
    spec:
      containers:
      - name: elasticsearch-client
        image: docker.elastic.co/elasticsearch/elasticsearch:7.8.0
        env:
        - name: CLUSTER_NAME
          value: elasticsearch
        - name: NODE_NAME
          value: elasticsearch-client
        - name: NODE_LIST
          value: elasticsearch-master,elasticsearch-data,elasticsearch-client
        - name: MASTER_NODES
          value: elasticsearch-master
        - name: "ES_JAVA_OPTS"
          value: "-Xms256m -Xmx256m"
        ports:
        - containerPort: 9200
          name: client
        - containerPort: 9300
          name: transport
        volumeMounts:
        - name: config
          mountPath: /usr/share/elasticsearch/config/elasticsearch.yml
          readOnly: true
          subPath: elasticsearch.yml
        - name: storage
          mountPath: /data
      volumes:
      - name: config
        configMap:
          name: elasticsearch-client-config
      - name: "storage"
        emptyDir:
          medium: ""
---
|
Again, the above resource object is created directly to deploy the client node.
1
2
3
4
5
6
7
|
$ kubectl apply  -f elasticsearch-client.configmap.yaml \
                 -f elasticsearch-client.service.yaml \
                 -f elasticsearch-client.deployment.yaml

configmap/elasticsearch-client-config created
service/elasticsearch-client created
deployment.apps/elasticsearch-client created
|
Until all nodes are deployed successfully, the cluster installation is proven to be successful.
1
2
3
4
5
|
$ kubectl get pods -n elastic -l app=elasticsearch
NAME                                    READY   STATUS    RESTARTS   AGE
elasticsearch-client-788bffcc98-hh2s8   1/1     Running   0          83m
elasticsearch-data-0                    1/1     Running   0          91m
elasticsearch-master-6f666cbbd-r9vtx    1/1     Running   0          112m
|
Changes in the status of the cluster can be viewed by using the following command as shown below.
1
2
3
4
5
|
$ kubectl logs -f -n elastic \
  $(kubectl get pods -n elastic | grep elasticsearch-master | sed -n 1p | awk '{print $1}') \
  | grep "Cluster health status changed from"

{"type": "server", "timestamp": "2020-06-26T03:31:21,353Z", "level": "INFO", "component": "o.e.c.r.a.AllocationService", "cluster.name": "elasticsearch", "node.name": "elasticsearch-master", "message": "Cluster health status changed from [RED] to [GREEN] (reason: [shards started [[.monitoring-es-7-2020.06.26][0]]]).", "cluster.uuid": "SS_nyhNiTDSCE6gG7z-J4w", "node.id": "BdVScO9oQByBHR5rfw-KDA"  }
|
2.4 Generating passwords
We have enabled the xpack security module to protect our cluster, so we need an initialized password. We can run the bin/elasticsearch-setup-passwords command inside the client node container to generate the default username and password by executing the command shown below.
 1
 2
 3
 4
 5
 6
 7
 8
 9
10
11
12
13
14
15
16
17
18
19
20
21
22
23
24
|
$ kubectl exec $(kubectl get pods -n elastic | grep elasticsearch-client | sed -n 1p | awk '{print $1}') \
    -n elastic \
    -- bin/elasticsearch-setup-passwords auto -b

Changed password for user apm_system
PASSWORD apm_system = 3Lhx61s6woNLvoL5Bb7t

Changed password for user kibana_system
PASSWORD kibana_system = NpZv9Cvhq4roFCMzpja3

Changed password for user kibana
PASSWORD kibana = NpZv9Cvhq4roFCMzpja3

Changed password for user logstash_system
PASSWORD logstash_system = nNnGnwxu08xxbsiRGk2C

Changed password for user beats_system
PASSWORD beats_system = fen759y5qxyeJmqj6UPp

Changed password for user remote_monitoring_user
PASSWORD remote_monitoring_user = mCP77zjCATGmbcTFFgOX

Changed password for user elastic
PASSWORD elastic = wmxhvsJFeti2dSjbQEAH
|
Note that the elastic username and password need to be added to the Kubernetes Secret object as well.
1
2
3
4
|
$ kubectl create secret generic elasticsearch-pw-elastic \
    -n elastic \
    --from-literal password=wmxhvsJFeti2dSjbQEAH
secret/elasticsearch-pw-elastic created
|
3. Kibana
Once the ElasticSearch cluster is installed, we can then deploy Kibana, the data visualization tool for ElasticSearch, which provides various features to manage the ElasticSearch cluster and visualize the data.
Again first we use the ConfigMap object to provide a file file that includes access to ElasticSearch (host, username, and password), which is configured via environment variables. The corresponding resource list file is shown below.
 1
 2
 3
 4
 5
 6
 7
 8
 9
10
11
12
13
14
15
16
17
18
|
# kibana.configmap.yaml
---
apiVersion: v1
kind: ConfigMap
metadata:
  namespace: elastic
  name: kibana-config
  labels:
    app: kibana
data:
  kibana.yml: |-
    server.host: 0.0.0.0

    elasticsearch:
      hosts: ${ELASTICSEARCH_HOSTS}
      username: ${ELASTICSEARCH_USER}
      password: ${ELASTICSEARCH_PASSWORD}
---
|
The Kibana service is then exposed through a NodePort-type service:
 1
 2
 3
 4
 5
 6
 7
 8
 9
10
11
12
13
14
15
16
17
|
# kibana.service.yaml
---
apiVersion: v1
kind: Service
metadata:
  namespace: elastic
  name: kibana
  labels:
    app: kibana
spec:
  type: NodePort
  ports:
  - port: 5601
    name: webinterface
  selector:
    app: kibana
---
|
Finally, to deploy the Kibana service via Deployment, we use the Secret object created above as a reference since we need to provide the password via environment variables.
 1
 2
 3
 4
 5
 6
 7
 8
 9
10
11
12
13
14
15
16
17
18
19
20
21
22
23
24
25
26
27
28
29
30
31
32
33
34
35
36
37
38
39
40
41
42
43
44
|
# kibana.deployment.yaml
---
apiVersion: apps/v1
kind: Deployment
metadata:
  namespace: elastic
  name: kibana
  labels:
    app: kibana
spec:
  selector:
    matchLabels:
      app: kibana
  template:
    metadata:
      labels:
        app: kibana
    spec:
      containers:
      - name: kibana
        image: docker.elastic.co/kibana/kibana:7.8.0
        ports:
        - containerPort: 5601
          name: webinterface
        env:
        - name: ELASTICSEARCH_HOSTS
          value: "http://elasticsearch-client.elastic.svc.cluster.local:9200"
        - name: ELASTICSEARCH_USER
          value: "elastic"
        - name: ELASTICSEARCH_PASSWORD
          valueFrom:
            secretKeyRef:
              name: elasticsearch-pw-elastic
              key: password
        volumeMounts:
        - name: config
          mountPath: /usr/share/kibana/config/kibana.yml
          readOnly: true
          subPath: kibana.yml
      volumes:
      - name: config
        configMap:
          name: kibana-config
---
|
Again, the above list of resources can be deployed by directly creating.
1
2
3
4
5
6
7
|
$ kubectl apply  -f kibana.configmap.yaml \
                 -f kibana.service.yaml \
                 -f kibana.deployment.yaml

configmap/kibana-config created
service/kibana created
deployment.apps/kibana created
|
After a successful deployment, you can see the status of Kibana by looking at the Pod’s logs.
1
2
3
4
|
$ kubectl logs -f -n elastic $(kubectl get pods -n elastic | grep kibana | sed -n 1p | awk '{print $1}') \
     | grep "Status changed from yellow to green"

{"type":"log","@timestamp":"2020-06-26T04:20:38Z","tags":["status","plugin:elasticsearch@7.8.0","info"],"pid":6,"state":"green","message":"Status changed from yellow to green - Ready","prevState":"yellow","prevMsg":"Waiting for Elasticsearch"}
|
Once the status changes to green, we can access the Kibana service in the browser via NodePort port 30474:
1
2
3
|
$ kubectl get svc kibana -n elastic
NAME     TYPE       CLUSTER-IP      EXTERNAL-IP   PORT(S)          AGE
kibana   NodePort   10.101.121.31   <none>        5601:30474/TCP   8m18s
|
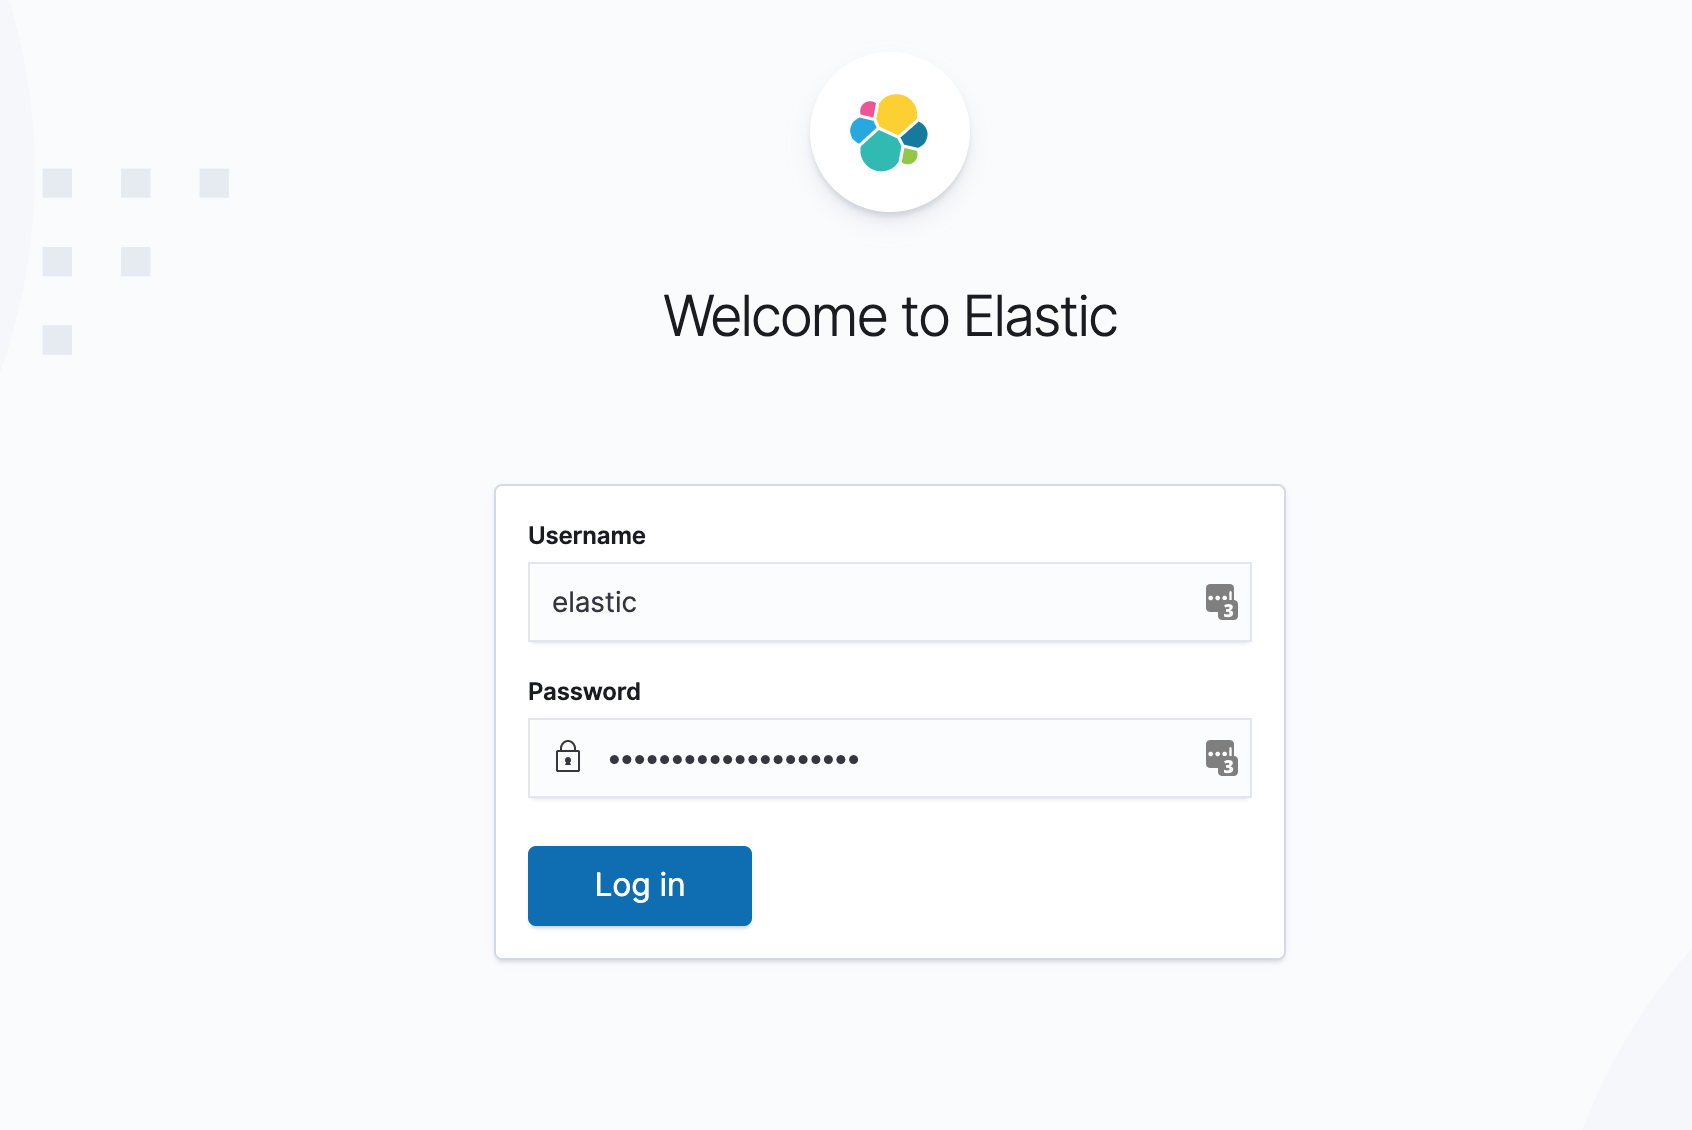
As you can see in the figure below, you can log in using the elastic user and the generated password of the Secret object we created above.
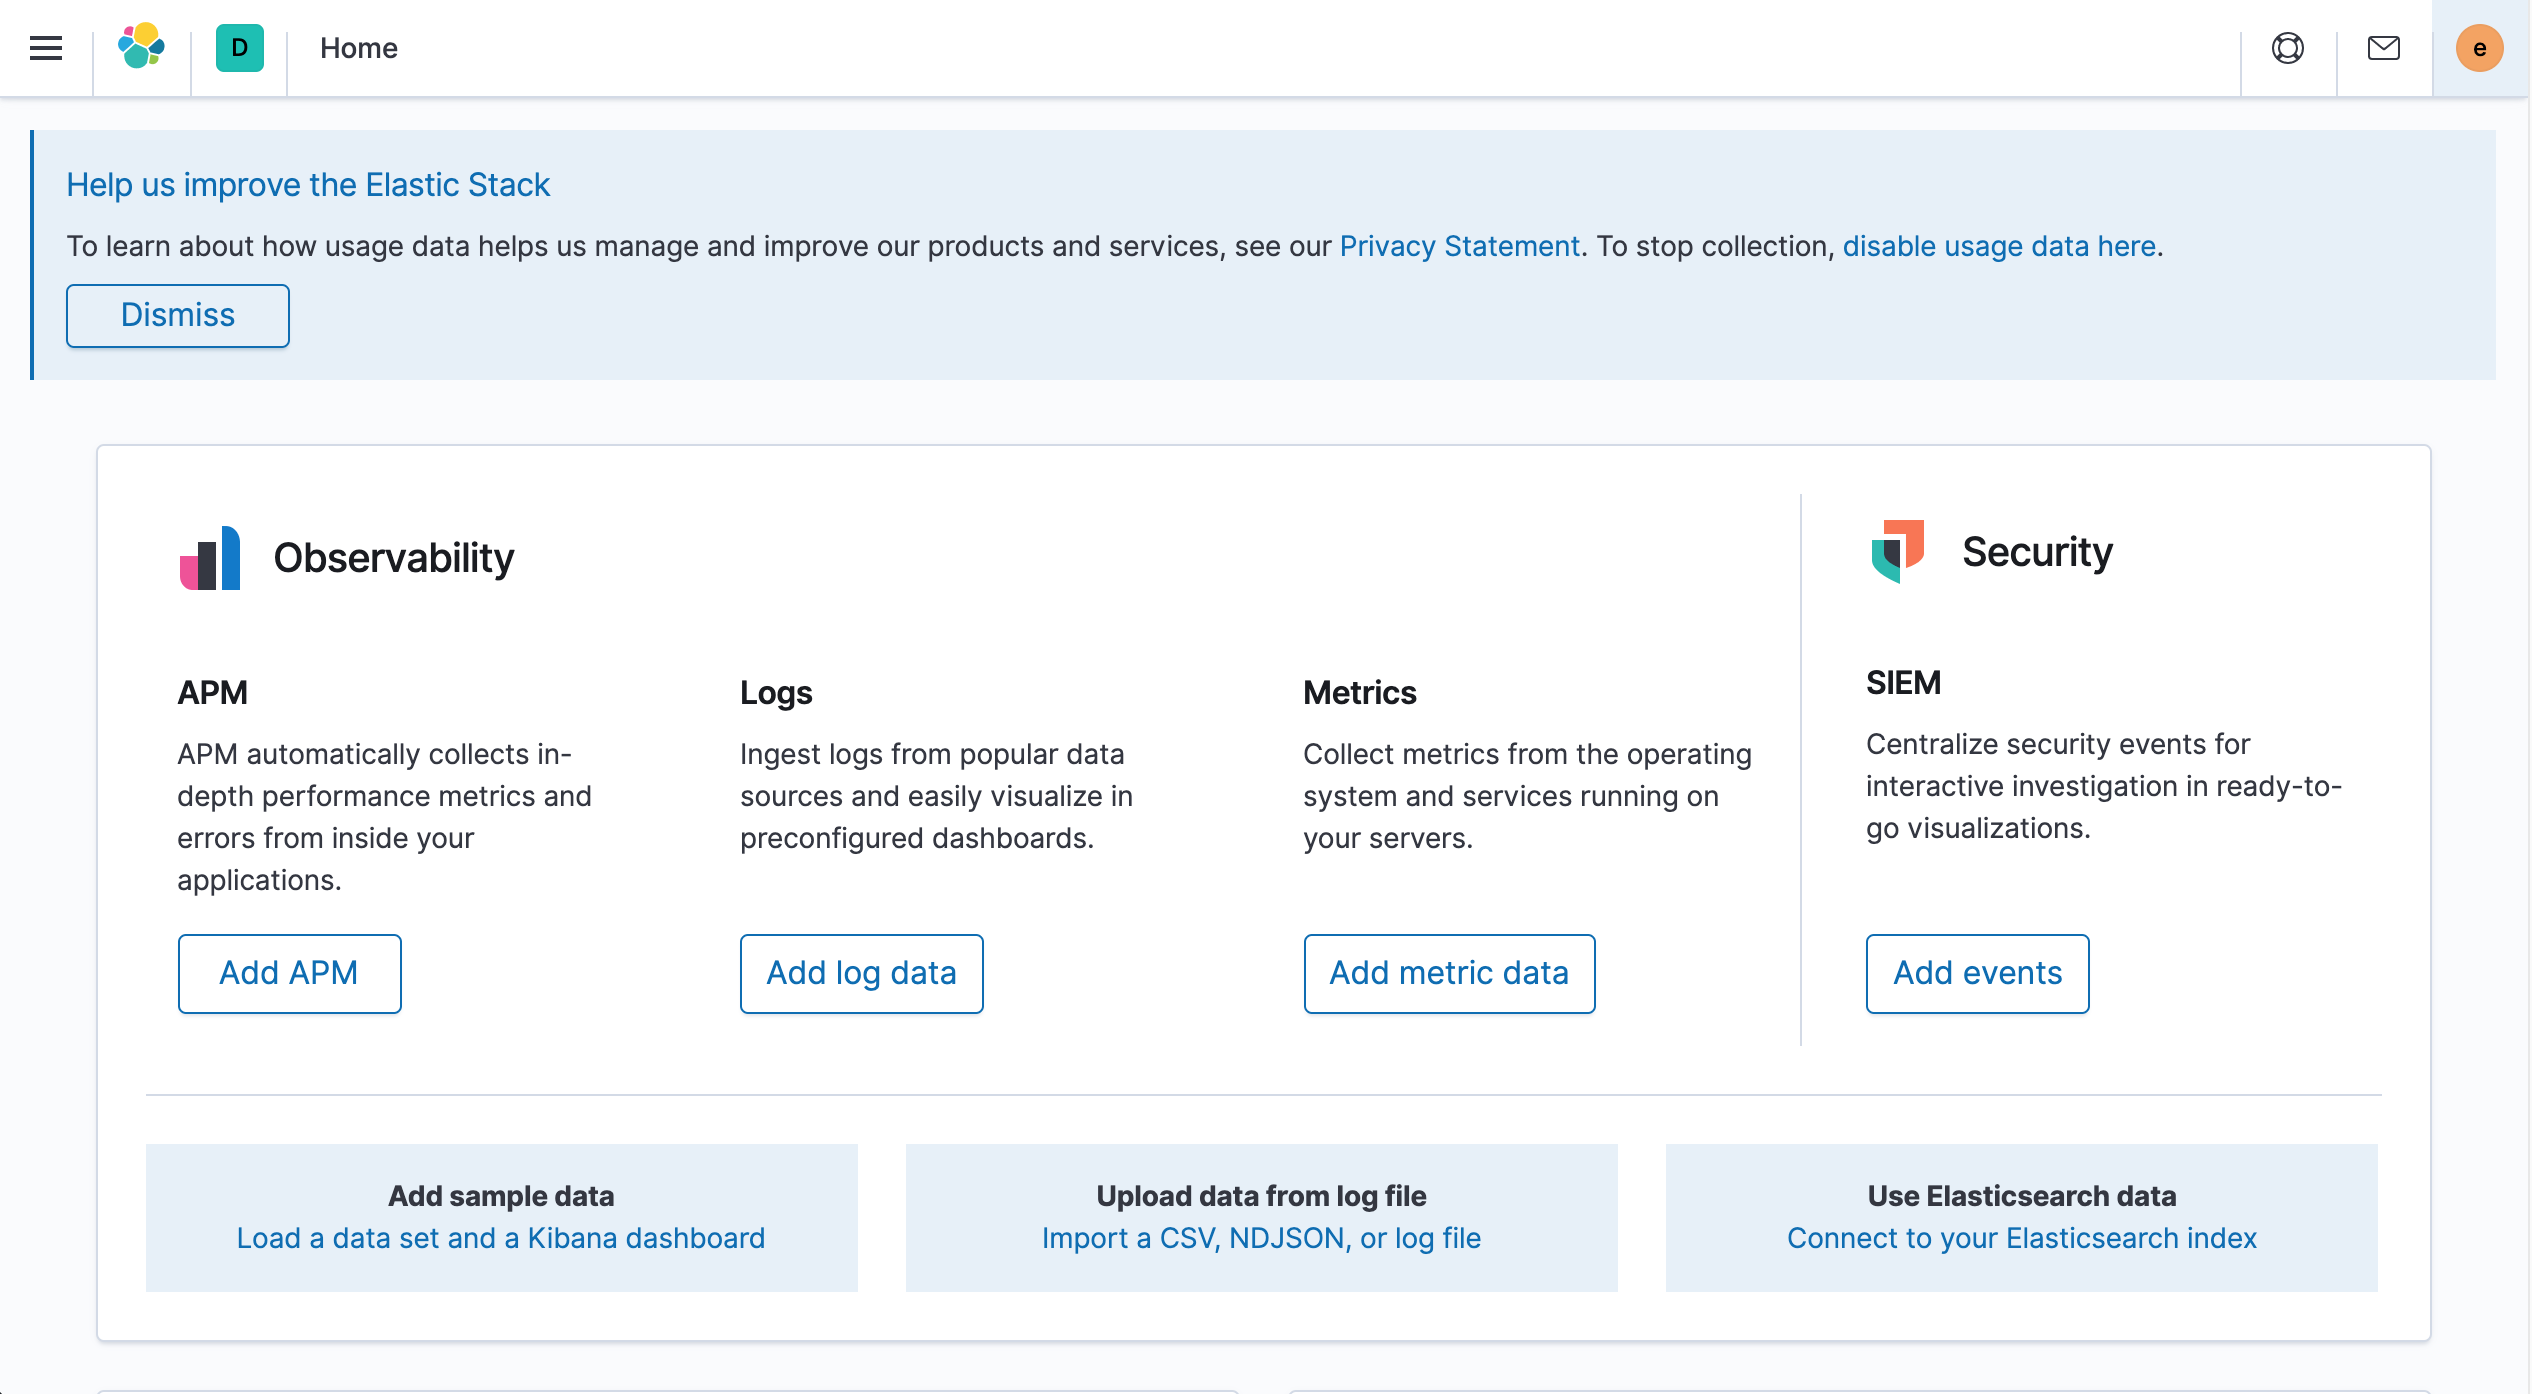
After successful login, you will automatically be redirected to the Kibana home page at
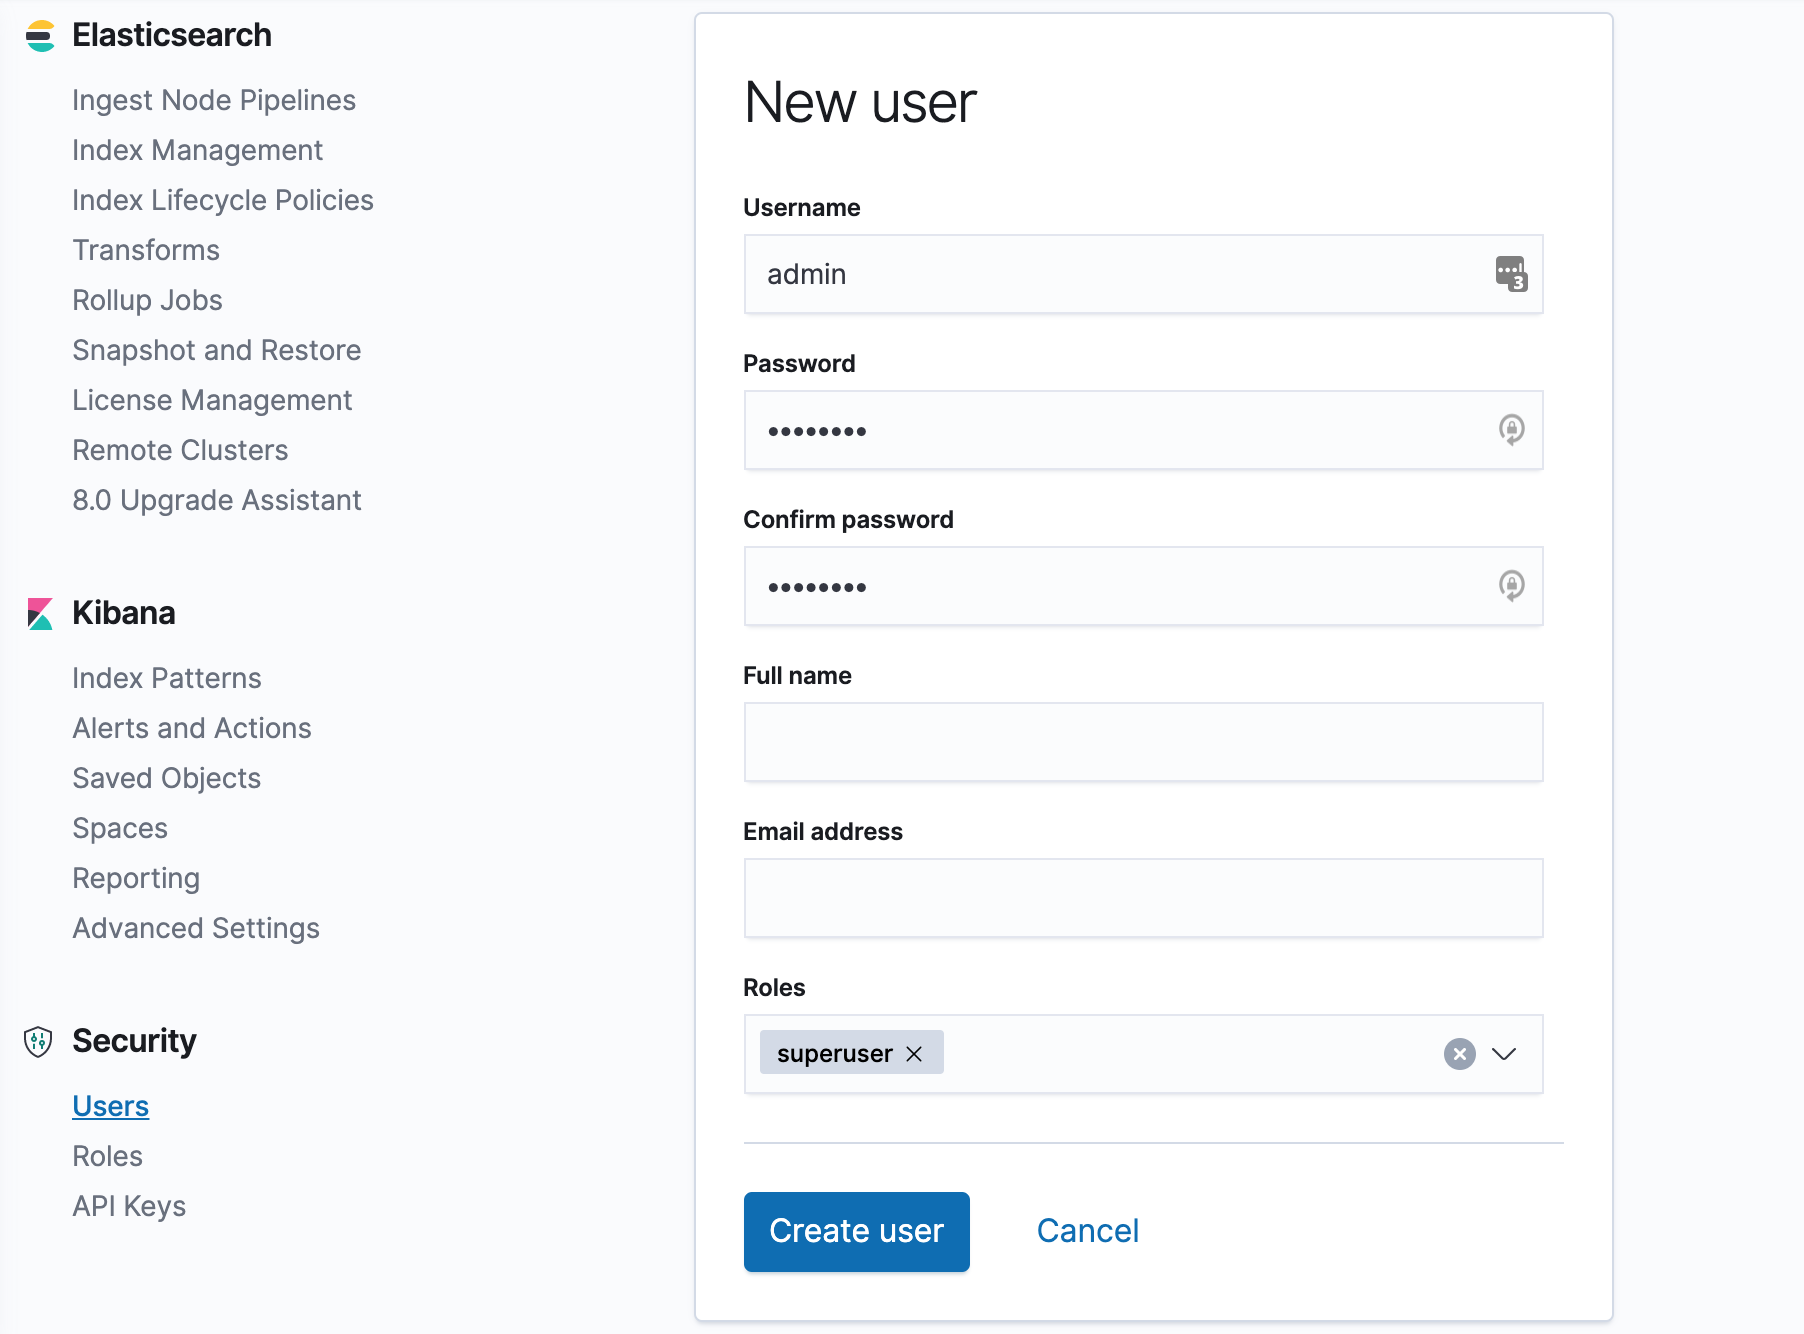
You can also create a new superuser yourself, Management → Stack Management → Create User.
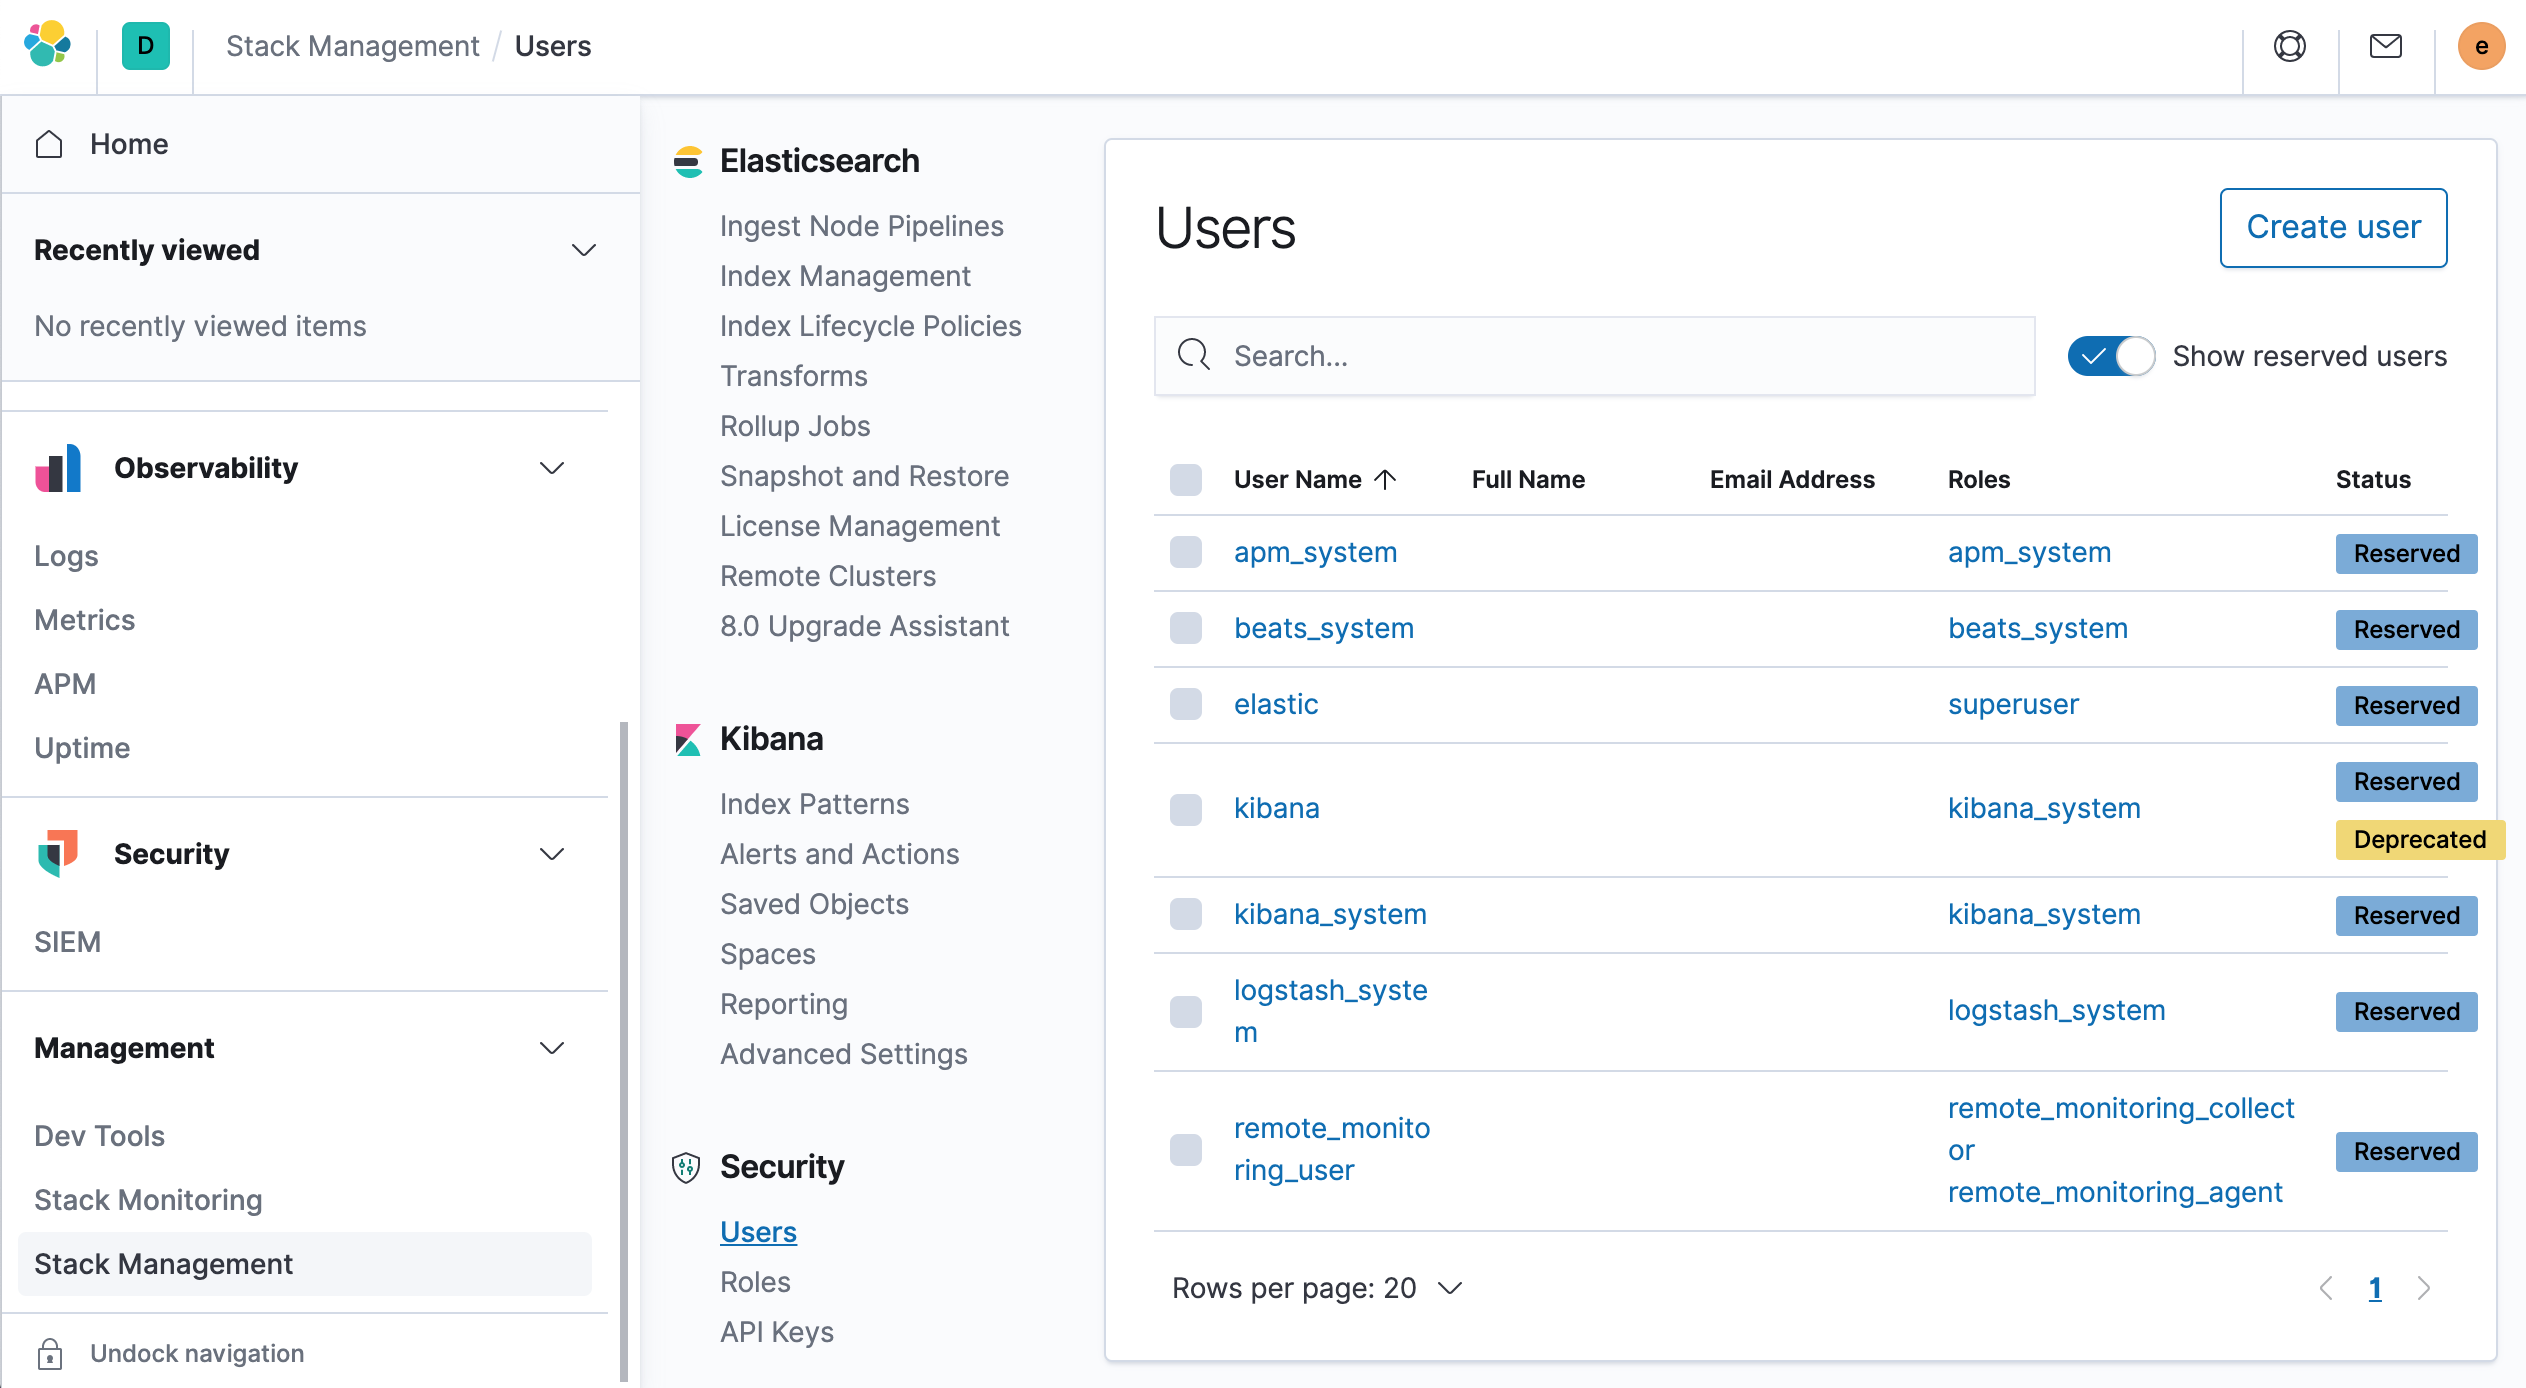
Create a new user by selecting the role superuser with a new username and password.
Once created, you can log in to Kibana using the new user created above, and finally, you can view the health of the entire cluster via the Management → Stack Monitoring page at
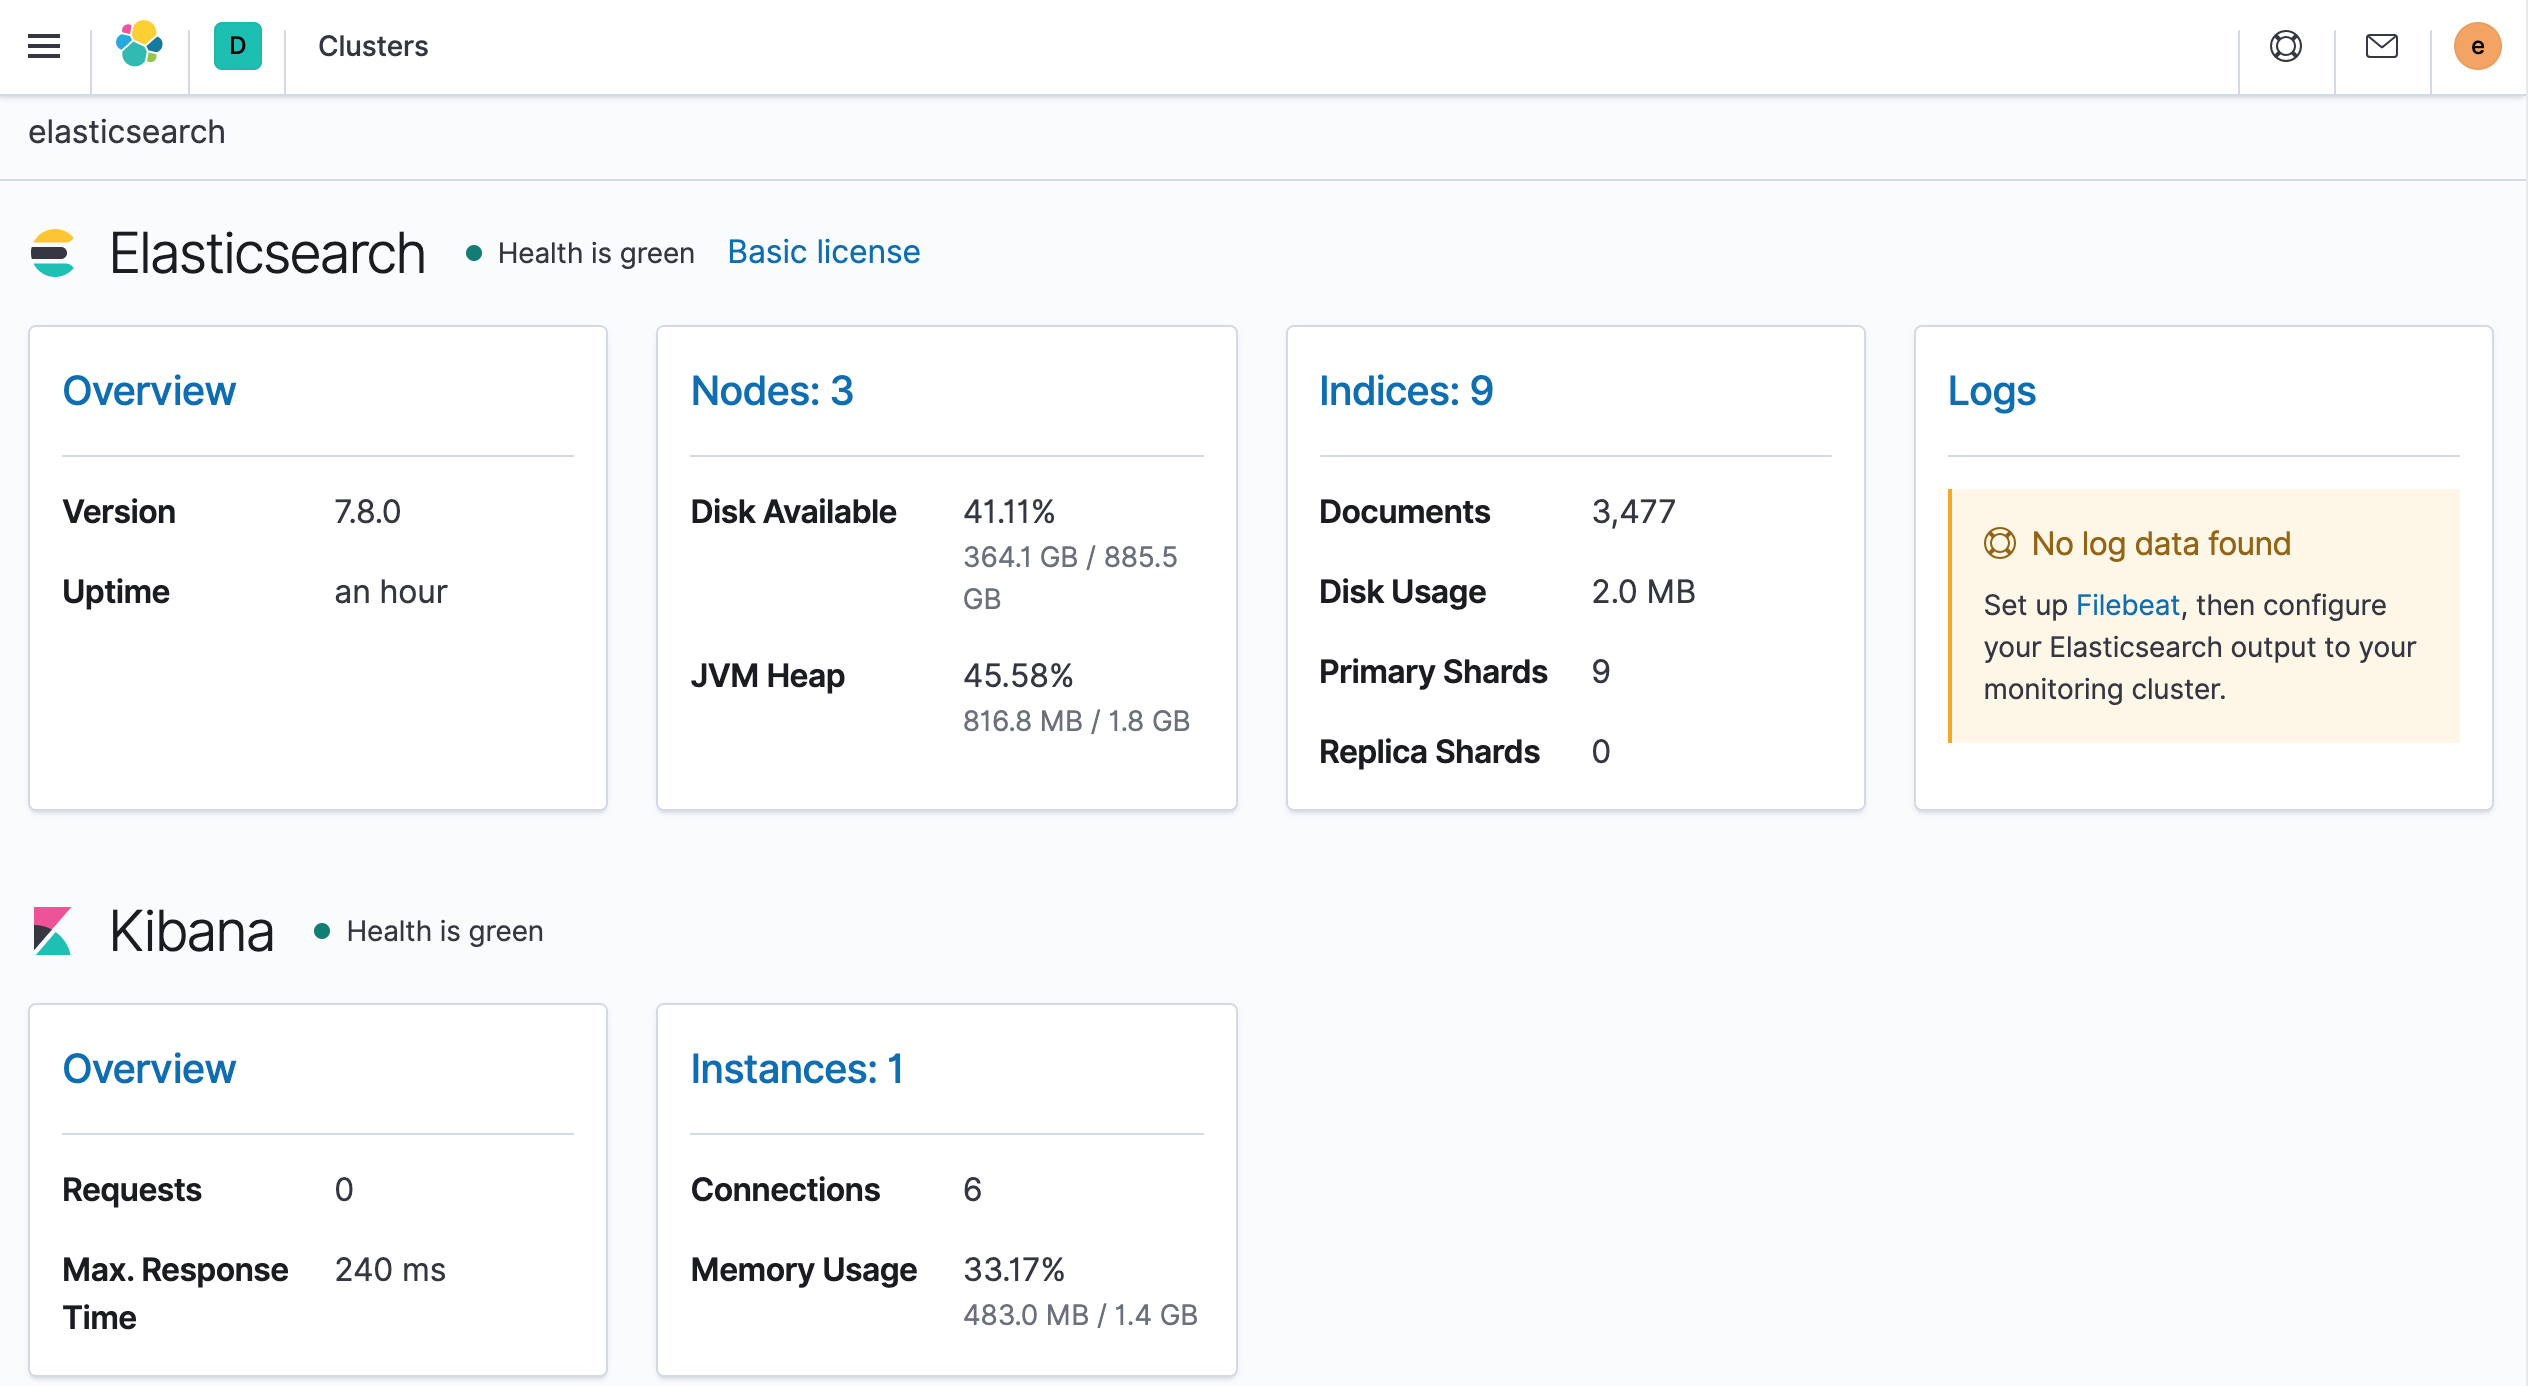
At this point we have successfully installed ElasticSearch and Kibana, which will serve us to store and visualize our application data (monitoring metrics, logs, and traces).
In the next article, we will learn how to install and configure Metricbeat to collect metrics for monitoring Kubernetes clusters through Elastic Metribeat.