In this article, we will use Metricbeat to monitor Kubernetes clusters, as we have already installed and configured the ElasticSearch cluster in the previous article. Metricbeat is a lightweight collector on the server that is used to collect monitoring metrics for hosts and services on a regular basis. This is the first part of our build of Kubernetes full-stack monitoring.
Metribeat collects system metrics by default, but also includes a large number of other modules to collect metrics about services such as Nginx, Kafka, MySQL, Redis, etc. The full list of supported modules can be viewed on the official Elastic website at https://www.elastic.co/guide/en/beats/metricbeat/current/metricbeat-modules.html.
kube-state-metrics
First, we need to install kube-state-metrics, a component that is a service that listens to the Kubernetes API and exposes metrics data about the state of each resource object.
To install kube-state-metrics is also very simple, there is a corresponding installation resource manifest file under the corresponding GitHub repository at
 1
 2
 3
 4
 5
 6
 7
 8
 9
10
11
12
|
$ git clone https://github.com/kubernetes/kube-state-metrics.git
$ cd kube-state-metrics
# 执行安装命令
$ kubectl apply -f examples/standard/
clusterrolebinding.rbac.authorization.k8s.io/kube-state-metrics configured
clusterrole.rbac.authorization.k8s.io/kube-state-metrics configured
deployment.apps/kube-state-metrics configured
serviceaccount/kube-state-metrics configured
service/kube-state-metrics configured
$ kubectl get pods -n kube-system -l app.kubernetes.io/name=kube-state-metrics
NAME                                  READY   STATUS    RESTARTS   AGE
kube-state-metrics-6d7449fc78-mgf4f   1/1     Running   0          88s
|
The installation is successful when the Pod becomes Running.
Metricbeat
Since we need to monitor all nodes, we need to use a DaemonSet controller to install Metricbeat.
First, use a ConfigMap to configure Metricbeat, and then mount the object in /etc/metricbeat.yaml in the container via Volume. The configuration file contains the ElasticSearch address, username and password, as well as information about the Kibana configuration, the modules we want to enable and the crawl frequency.
 1
 2
 3
 4
 5
 6
 7
 8
 9
10
11
12
13
14
15
16
17
18
19
20
21
22
23
24
25
26
27
28
29
30
31
32
33
34
35
36
37
38
39
40
41
42
43
44
45
46
47
48
49
50
51
52
53
54
55
56
57
58
59
60
61
62
63
64
65
66
67
68
69
70
71
72
73
74
75
76
77
78
79
|
# metricbeat.settings.configmap.yml
---
apiVersion: v1
kind: ConfigMap
metadata:
  namespace: elastic
  name: metricbeat-config
  labels:
    app: metricbeat
data:
  metricbeat.yml: |-

    # 模块配置
    metricbeat.modules:
    - module: system
      period: ${PERIOD}
      metricsets: ["cpu", "load", "memory", "network", "process", "process_summary", "core", "diskio", "socket"]
      processes: ['.*']
      process.include_top_n:
        by_cpu: 5      # 根据 CPU 计算的前5个进程
        by_memory: 5   # 根据内存计算的前5个进程

    - module: system
      period: ${PERIOD}
      metricsets:  ["filesystem", "fsstat"]
      processors:
      - drop_event.when.regexp:
          system.filesystem.mount_point: '^/(sys|cgroup|proc|dev|etc|host|lib)($|/)'

    - module: docker
      period: ${PERIOD}
      hosts: ["unix:///var/run/docker.sock"]
      metricsets: ["container", "cpu", "diskio", "healthcheck", "info", "memory", "network"]

    - module: kubernetes  # 抓取 kubelet 监控指标
      period: ${PERIOD}
      node: ${NODE_NAME}
      hosts: ["https://${NODE_NAME}:10250"]
      metricsets: ["node", "system", "pod", "container", "volume"]
      bearer_token_file: /var/run/secrets/kubernetes.io/serviceaccount/token
      ssl.verification_mode: "none"

    - module: kubernetes  # 抓取 kube-state-metrics 数据
      period: ${PERIOD}
      node: ${NODE_NAME}
      metricsets: ["state_node", "state_deployment", "state_replicaset", "state_pod", "state_container"]
      hosts: ["kube-state-metrics.kube-system.svc.cluster.local:8080"]

    # 根据 k8s deployment 配置具体的服务模块
    metricbeat.autodiscover:
      providers:
      - type: kubernetes
        node: ${NODE_NAME}
        templates:
        - condition.equals:
            kubernetes.labels.app: mongo
          config:
          - module: mongodb
            period: ${PERIOD}
            hosts: ["mongo.elastic:27017"]
            metricsets: ["dbstats", "status", "collstats", "metrics", "replstatus"]

    # ElasticSearch 连接配置
    output.elasticsearch:
      hosts: ['${ELASTICSEARCH_HOST:elasticsearch}:${ELASTICSEARCH_PORT:9200}']
      username: ${ELASTICSEARCH_USERNAME}
      password: ${ELASTICSEARCH_PASSWORD}

    # 连接到 Kibana
    setup.kibana:
      host: '${KIBANA_HOST:kibana}:${KIBANA_PORT:5601}'

    # 导入已经存在的 Dashboard
    setup.dashboards.enabled: true

    # 配置 indice 生命周期
    setup.ilm:
      policy_file: /etc/indice-lifecycle.json
---
|
The indice lifecycle of ElasticSearch represents a set of rules that can be applied to your indice based on the size or length of the indice. For example, indices can be rotated every day or every time they exceed 1GB in size, and we can also configure different phases based on the rules. Since monitoring generates a lot of data, most likely more than tens of gigabytes a day, so to prevent large amounts of data storage, we can use the indice lifecycle to configure data retention, this is similarly done in Prometheus.
In the file shown below, we configure the indice to rotate every day or every time it exceeds 5GB, and delete all indice files older than 10 days, which is perfectly sufficient for us to keep only 10 days of monitoring data.
 1
 2
 3
 4
 5
 6
 7
 8
 9
10
11
12
13
14
15
16
17
18
19
20
21
22
23
24
25
26
27
28
29
30
31
32
|
# metricbeat.indice-lifecycle.configmap.yml
---
apiVersion: v1
kind: ConfigMap
metadata:
  namespace: elastic
  name: metricbeat-indice-lifecycle
  labels:
    app: metricbeat
data:
  indice-lifecycle.json: |-
    {
      "policy": {
        "phases": {
          "hot": {
            "actions": {
              "rollover": {
                "max_size": "5GB" ,
                "max_age": "1d"
              }
            }
          },
          "delete": {
            "min_age": "10d",
            "actions": {
              "delete": {}
            }
          }
        }
      }
    }
---
|
The next step is to write a list of DaemonSet resource objects for Metricbeat, as follows.
 1
 2
 3
 4
 5
 6
 7
 8
 9
10
11
12
13
14
15
16
17
18
19
20
21
22
23
24
25
26
27
28
29
30
31
32
33
34
35
36
37
38
39
40
41
42
43
44
45
46
47
48
49
50
51
52
53
54
55
56
57
58
59
60
61
62
63
64
65
66
67
68
69
70
71
72
73
74
75
76
77
78
79
80
81
82
83
84
85
86
87
88
89
90
91
92
93
94
95
96
97
98
99
|
# metricbeat.daemonset.yml
---
apiVersion: apps/v1
kind: DaemonSet
metadata:
  namespace: elastic
  name: metricbeat
  labels:
    app: metricbeat
spec:
  selector:
    matchLabels:
      app: metricbeat
  template:
    metadata:
      labels:
        app: metricbeat
    spec:
      serviceAccountName: metricbeat
      terminationGracePeriodSeconds: 30
      hostNetwork: true
      dnsPolicy: ClusterFirstWithHostNet
      containers:
      - name: metricbeat
        image: docker.elastic.co/beats/metricbeat:7.8.0
        args: [
          "-c", "/etc/metricbeat.yml",
          "-e", "-system.hostfs=/hostfs"
        ]
        env:
        - name: ELASTICSEARCH_HOST
          value: elasticsearch-client.elastic.svc.cluster.local
        - name: ELASTICSEARCH_PORT
          value: "9200"
        - name: ELASTICSEARCH_USERNAME
          value: elastic
        - name: ELASTICSEARCH_PASSWORD
          valueFrom:
            secretKeyRef:
              name: elasticsearch-pw-elastic
              key: password
        - name: KIBANA_HOST
          value: kibana.elastic.svc.cluster.local
        - name: KIBANA_PORT
          value: "5601"
        - name: NODE_NAME
          valueFrom:
            fieldRef:
              fieldPath: spec.nodeName
        - name: PERIOD
          value: "10s"
        securityContext:
          runAsUser: 0
        resources:
          limits:
            memory: 200Mi
          requests:
            cpu: 100m
            memory: 100Mi
        volumeMounts:
        - name: config
          mountPath: /etc/metricbeat.yml
          readOnly: true
          subPath: metricbeat.yml
        - name: indice-lifecycle
          mountPath: /etc/indice-lifecycle.json
          readOnly: true
          subPath: indice-lifecycle.json
        - name: dockersock
          mountPath: /var/run/docker.sock
        - name: proc
          mountPath: /hostfs/proc
          readOnly: true
        - name: cgroup
          mountPath: /hostfs/sys/fs/cgroup
          readOnly: true
      volumes:
      - name: proc
        hostPath:
          path: /proc
      - name: cgroup
        hostPath:
          path: /sys/fs/cgroup
      - name: dockersock
        hostPath:
          path: /var/run/docker.sock
      - name: config
        configMap:
          defaultMode: 0600
          name: metricbeat-config
      - name: indice-lifecycle
        configMap:
          defaultMode: 0600
          name: metricbeat-indice-lifecycle
      - name: data
        hostPath:
          path: /var/lib/metricbeat-data
          type: DirectoryOrCreate
---
|
Since Metricbeat needs to get information about the host, we also mount some host files to the container, such as proc directory, cgroup directory and dockersock file.
Since Metricbeat needs to get the resource object information of the Kubernetes cluster, it also needs the corresponding RBAC permission declaration, which is globally scoped, so here we use ClusterRole to declare.
 1
 2
 3
 4
 5
 6
 7
 8
 9
10
11
12
13
14
15
16
17
18
19
20
21
22
23
24
25
26
27
28
29
30
31
32
33
34
35
36
37
38
39
40
41
42
43
44
45
46
47
48
49
50
51
52
53
54
|
# metricbeat.permissions.yml
---
apiVersion: rbac.authorization.k8s.io/v1beta1
kind: ClusterRoleBinding
metadata:
  name: metricbeat
subjects:
- kind: ServiceAccount
  name: metricbeat
  namespace: elastic
roleRef:
  kind: ClusterRole
  name: metricbeat
  apiGroup: rbac.authorization.k8s.io
---
apiVersion: rbac.authorization.k8s.io/v1beta1
kind: ClusterRole
metadata:
  name: metricbeat
  labels:
    app: metricbeat
rules:
- apiGroups: [""]
  resources:
  - nodes
  - namespaces
  - events
  - pods
  verbs: ["get", "list", "watch"]
- apiGroups: ["extensions"]
  resources:
  - replicasets
  verbs: ["get", "list", "watch"]
- apiGroups: ["apps"]
  resources:
  - statefulsets
  - deployments
	- replicasets
  verbs: ["get", "list", "watch"]
- apiGroups:
  - ""
  resources:
  - nodes/stats
  verbs:
  - get
---
apiVersion: v1
kind: ServiceAccount
metadata:
  namespace: elastic
  name: metricbeat
  labels:
    app: metricbeat
---
|
It is straightforward to create several of the resource objects above.
 1
 2
 3
 4
 5
 6
 7
 8
 9
10
11
12
13
14
15
16
17
18
19
|
$ kubectl apply  -f metricbeat.settings.configmap.yml \
                 -f metricbeat.indice-lifecycle.configmap.yml \
                 -f metricbeat.daemonset.yml \
                 -f metricbeat.permissions.yml

configmap/metricbeat-config configured
configmap/metricbeat-indice-lifecycle configured
daemonset.extensions/metricbeat created
clusterrolebinding.rbac.authorization.k8s.io/metricbeat created
clusterrole.rbac.authorization.k8s.io/metricbeat created
serviceaccount/metricbeat created
$ kubectl get pods -n elastic -l app=metricbeat
NAME               READY   STATUS    RESTARTS   AGE
metricbeat-2gstq   1/1     Running   0          18m
metricbeat-99rdb   1/1     Running   0          18m
metricbeat-9bb27   1/1     Running   0          18m
metricbeat-cgbrg   1/1     Running   0          18m
metricbeat-l2csd   1/1     Running   0          18m
metricbeat-lsrgv   1/1     Running   0          18m
|
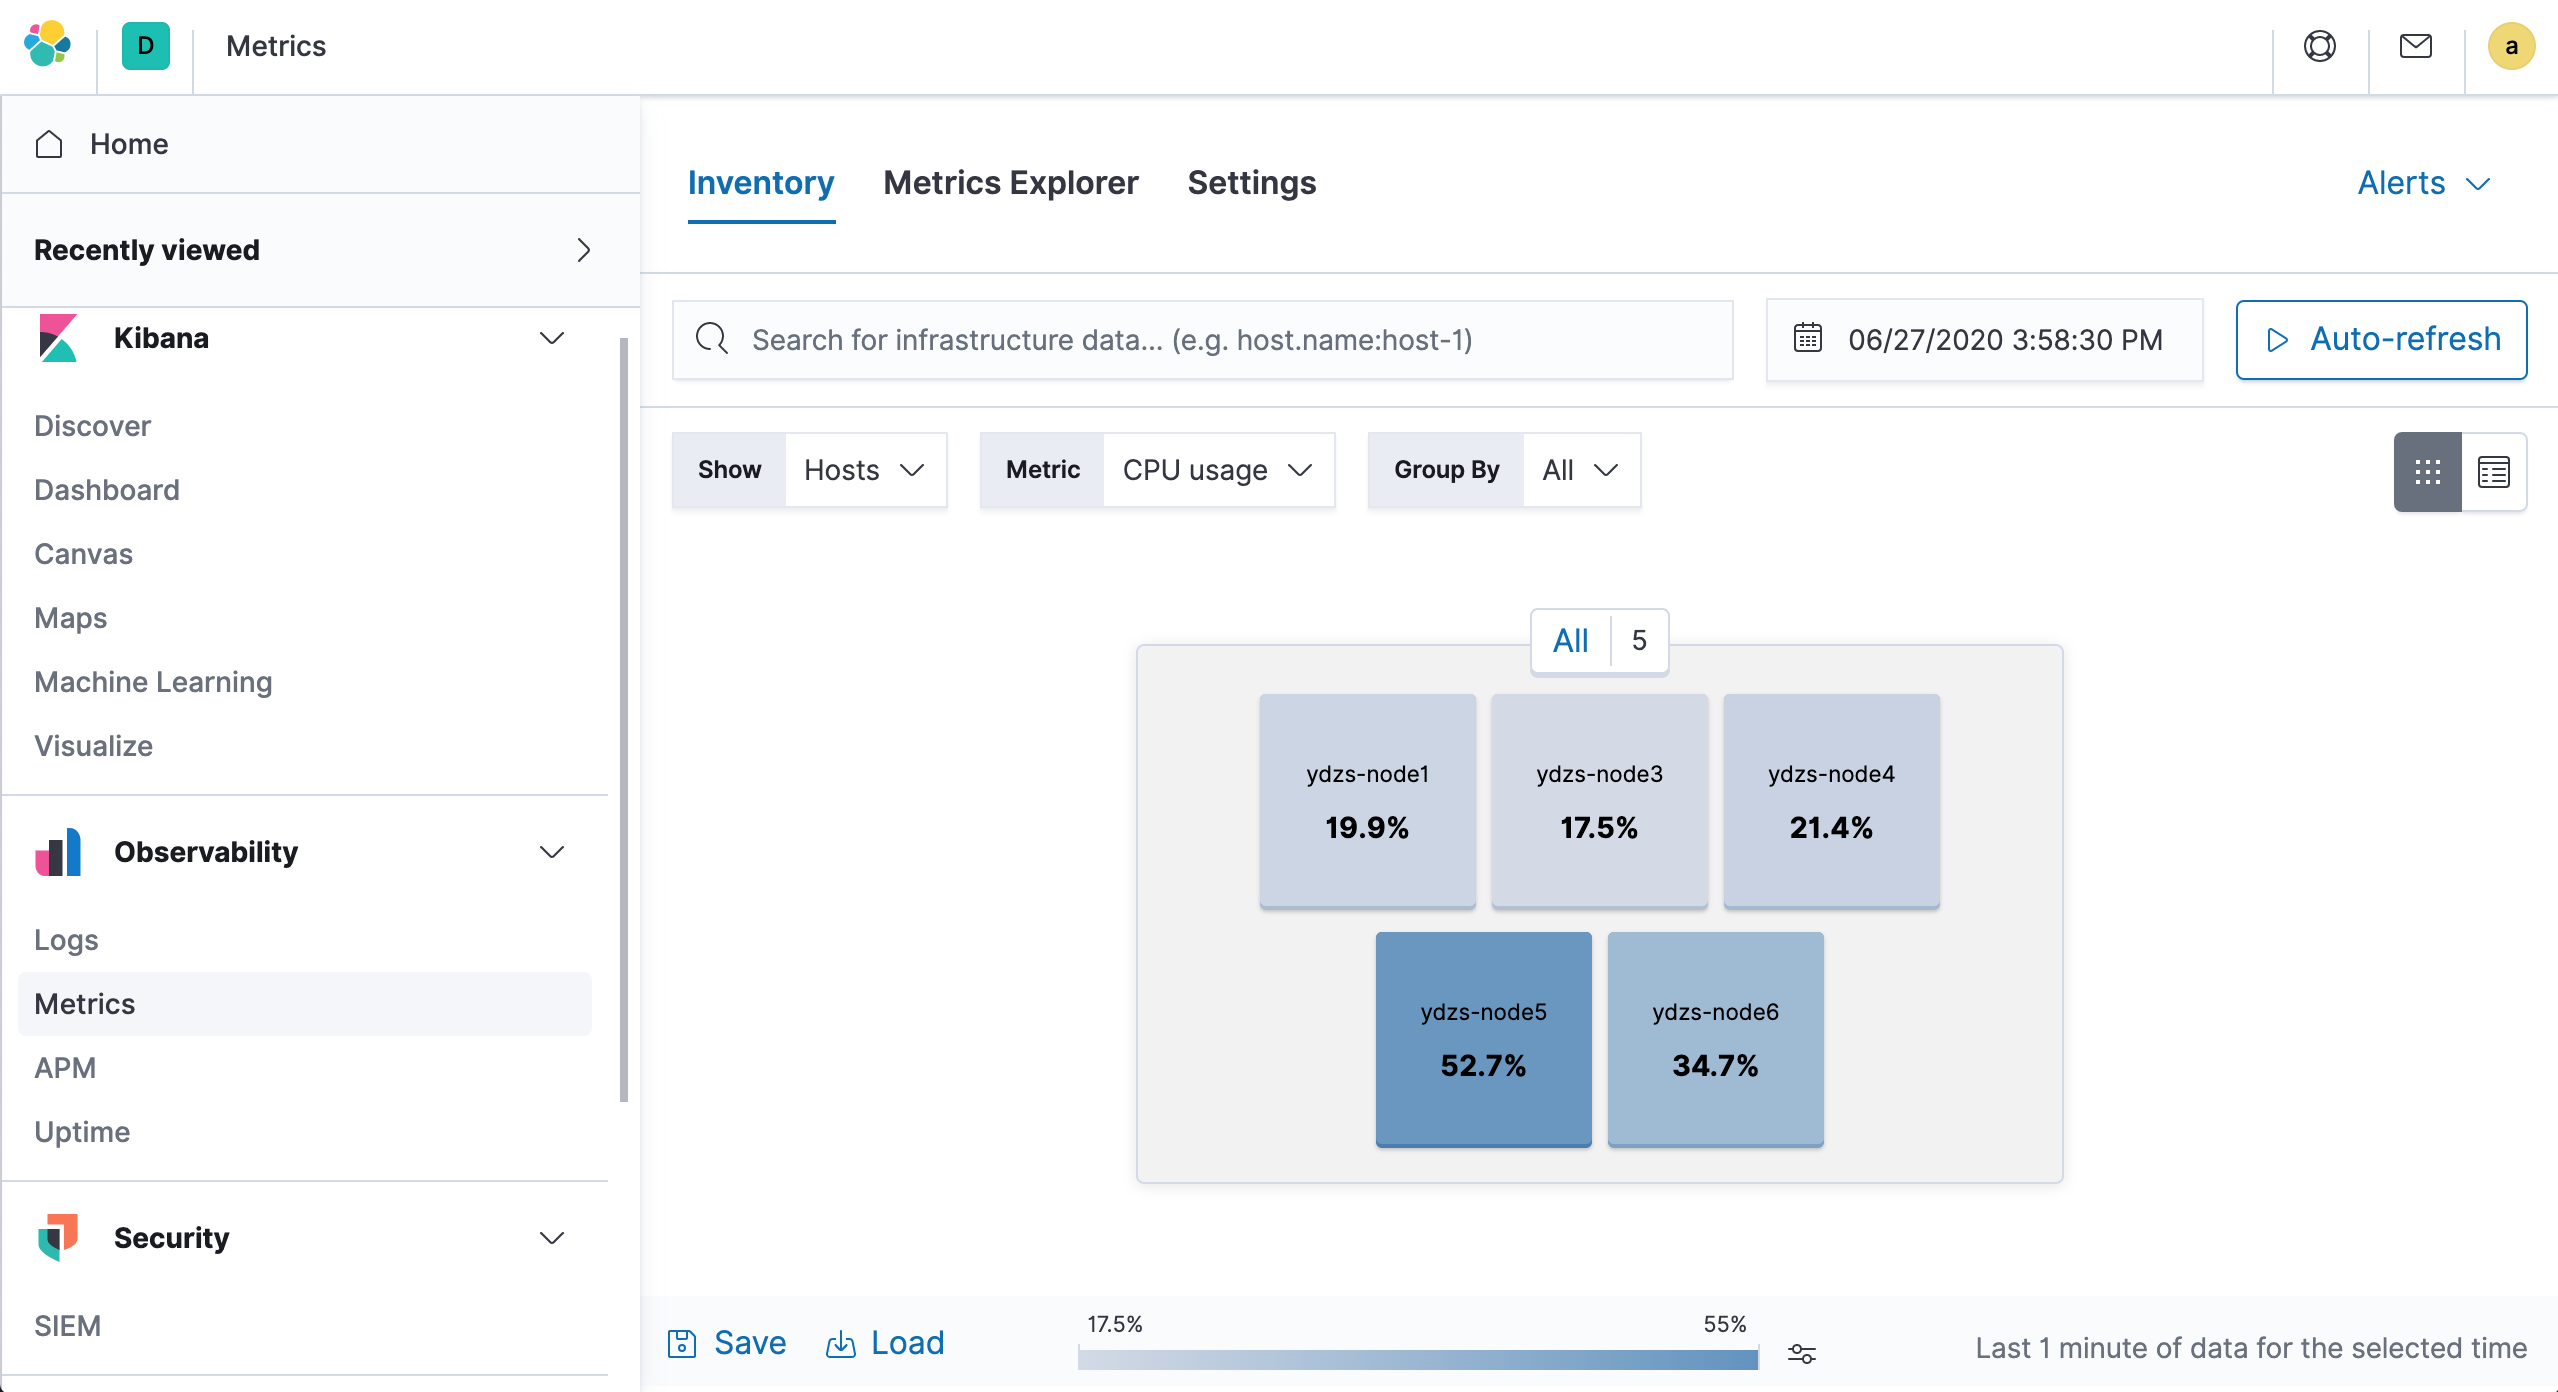
Once Metricbeat’s Pod becomes Running, we can normally go to Kibana to see the corresponding monitoring information.
On the left side of Kibana, go to Observability → Metrics to access the metrics monitoring page, and you can see some monitoring data.
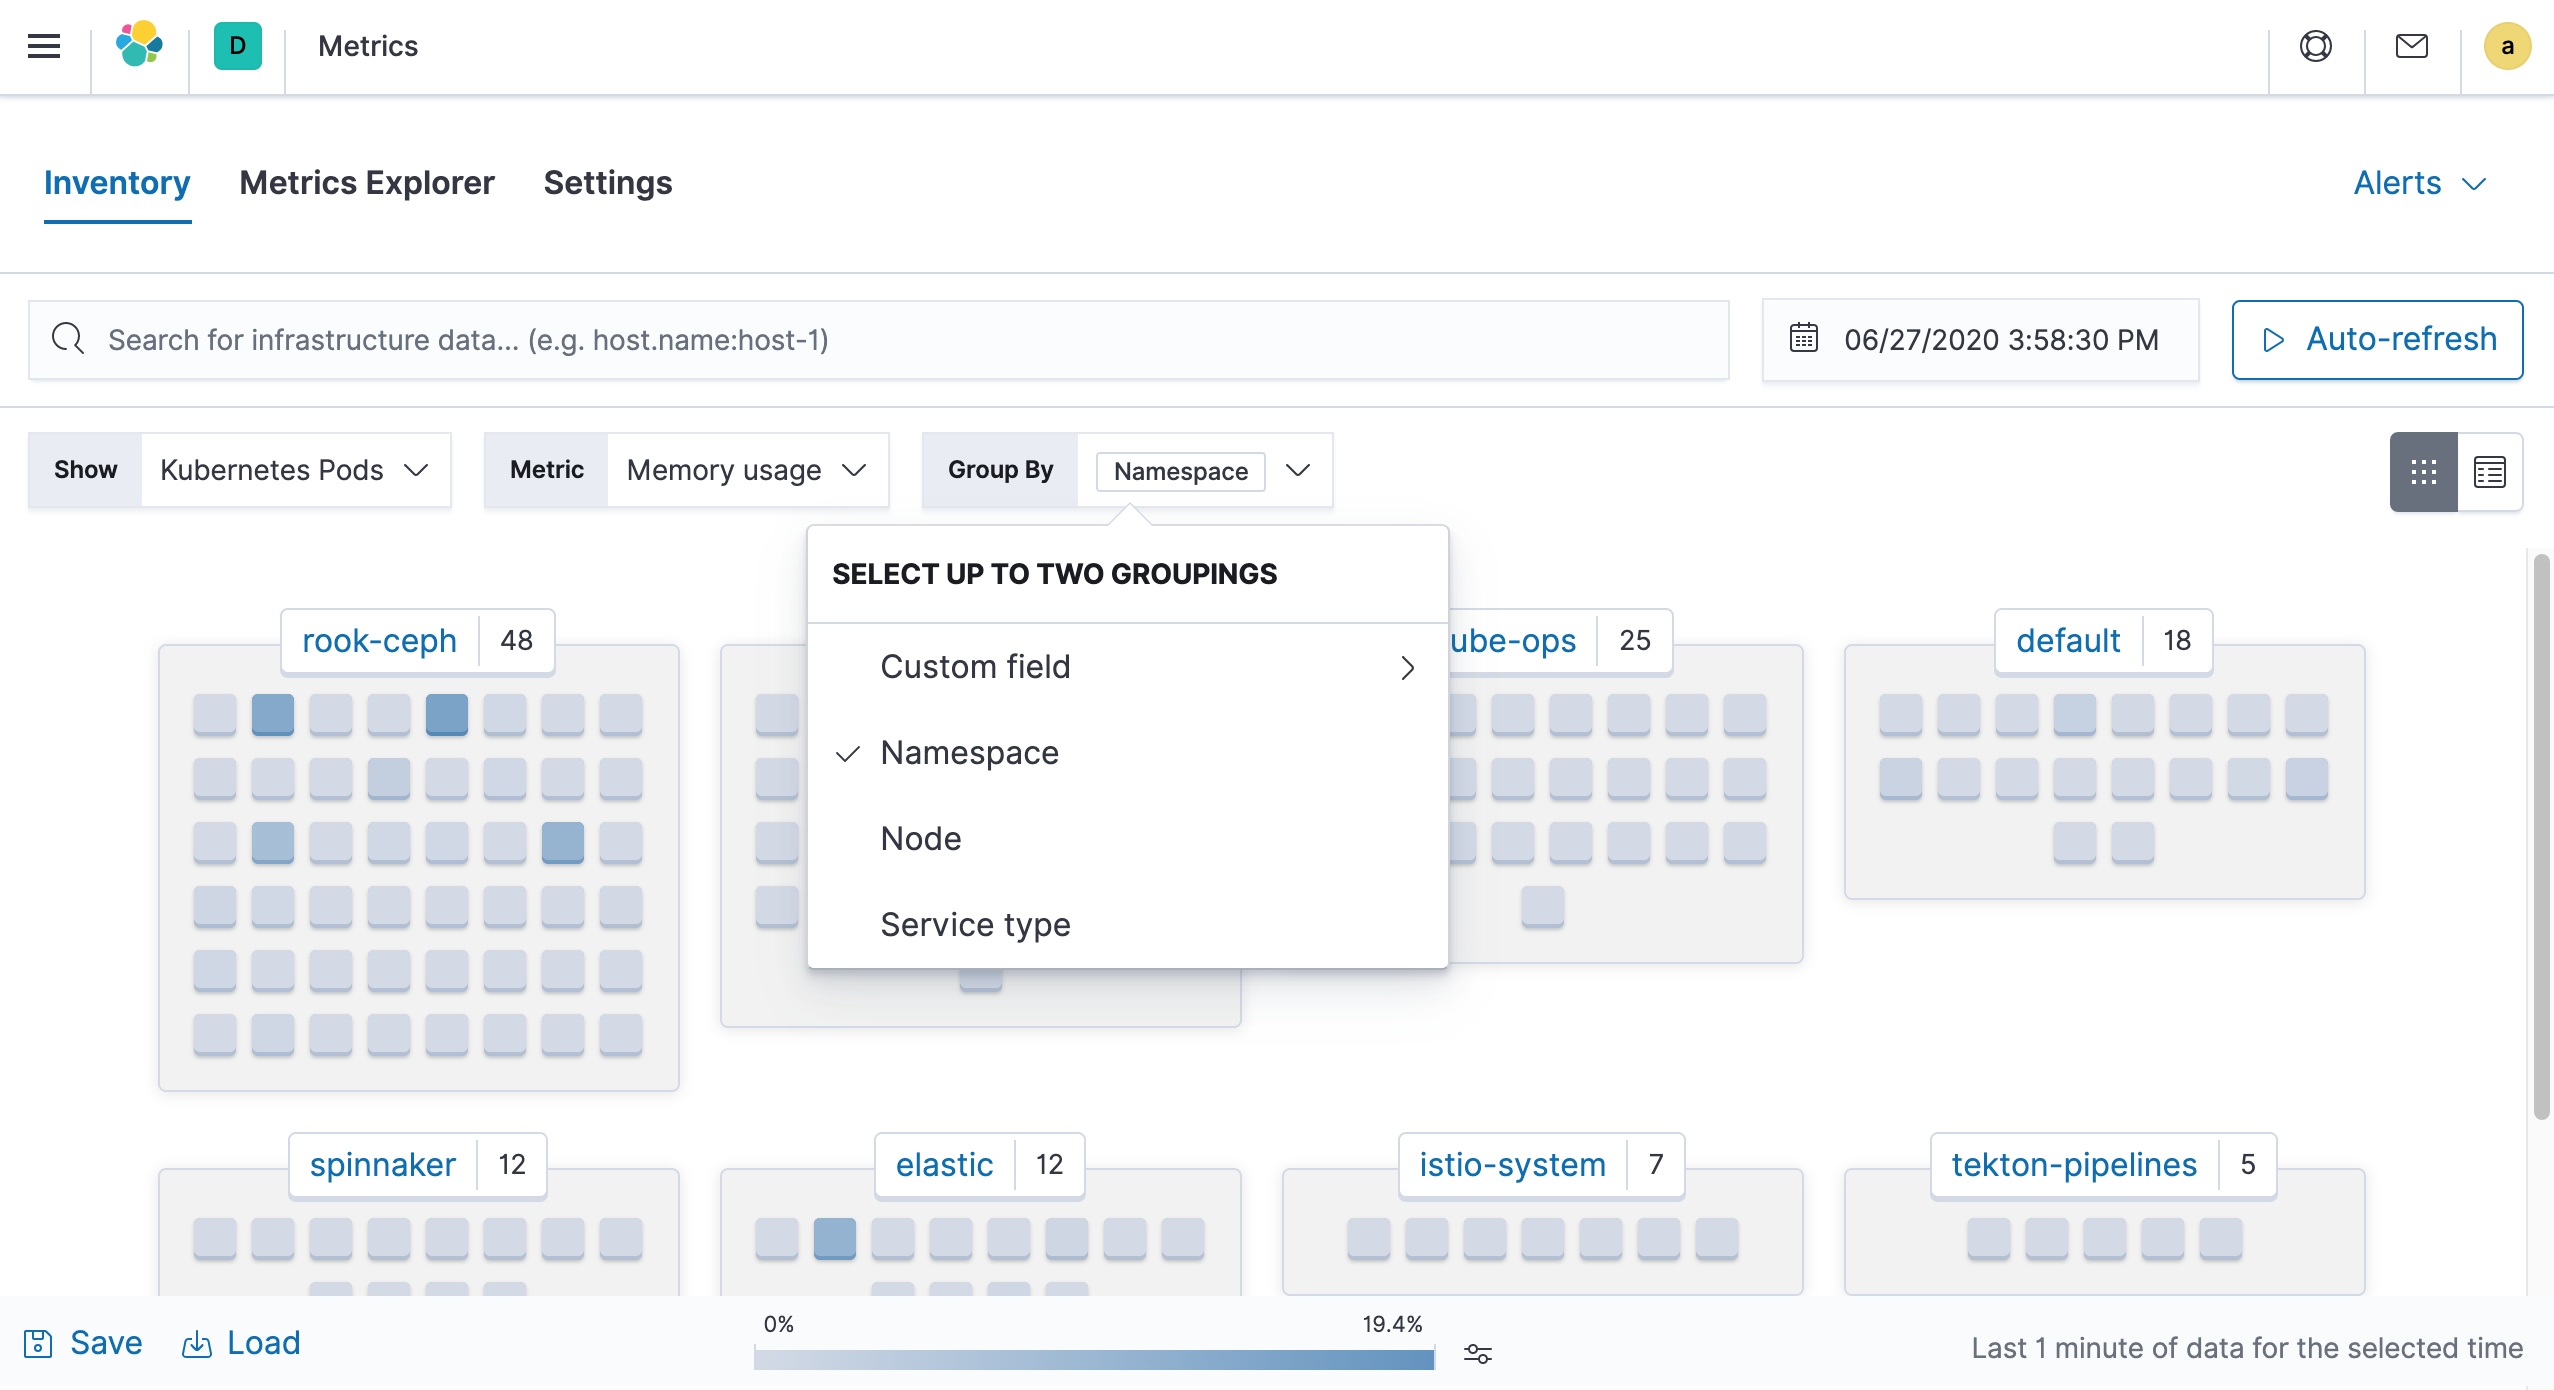
You can also filter according to your needs, for example, we can group by Kubernetes Namespace as a view to see monitoring information.
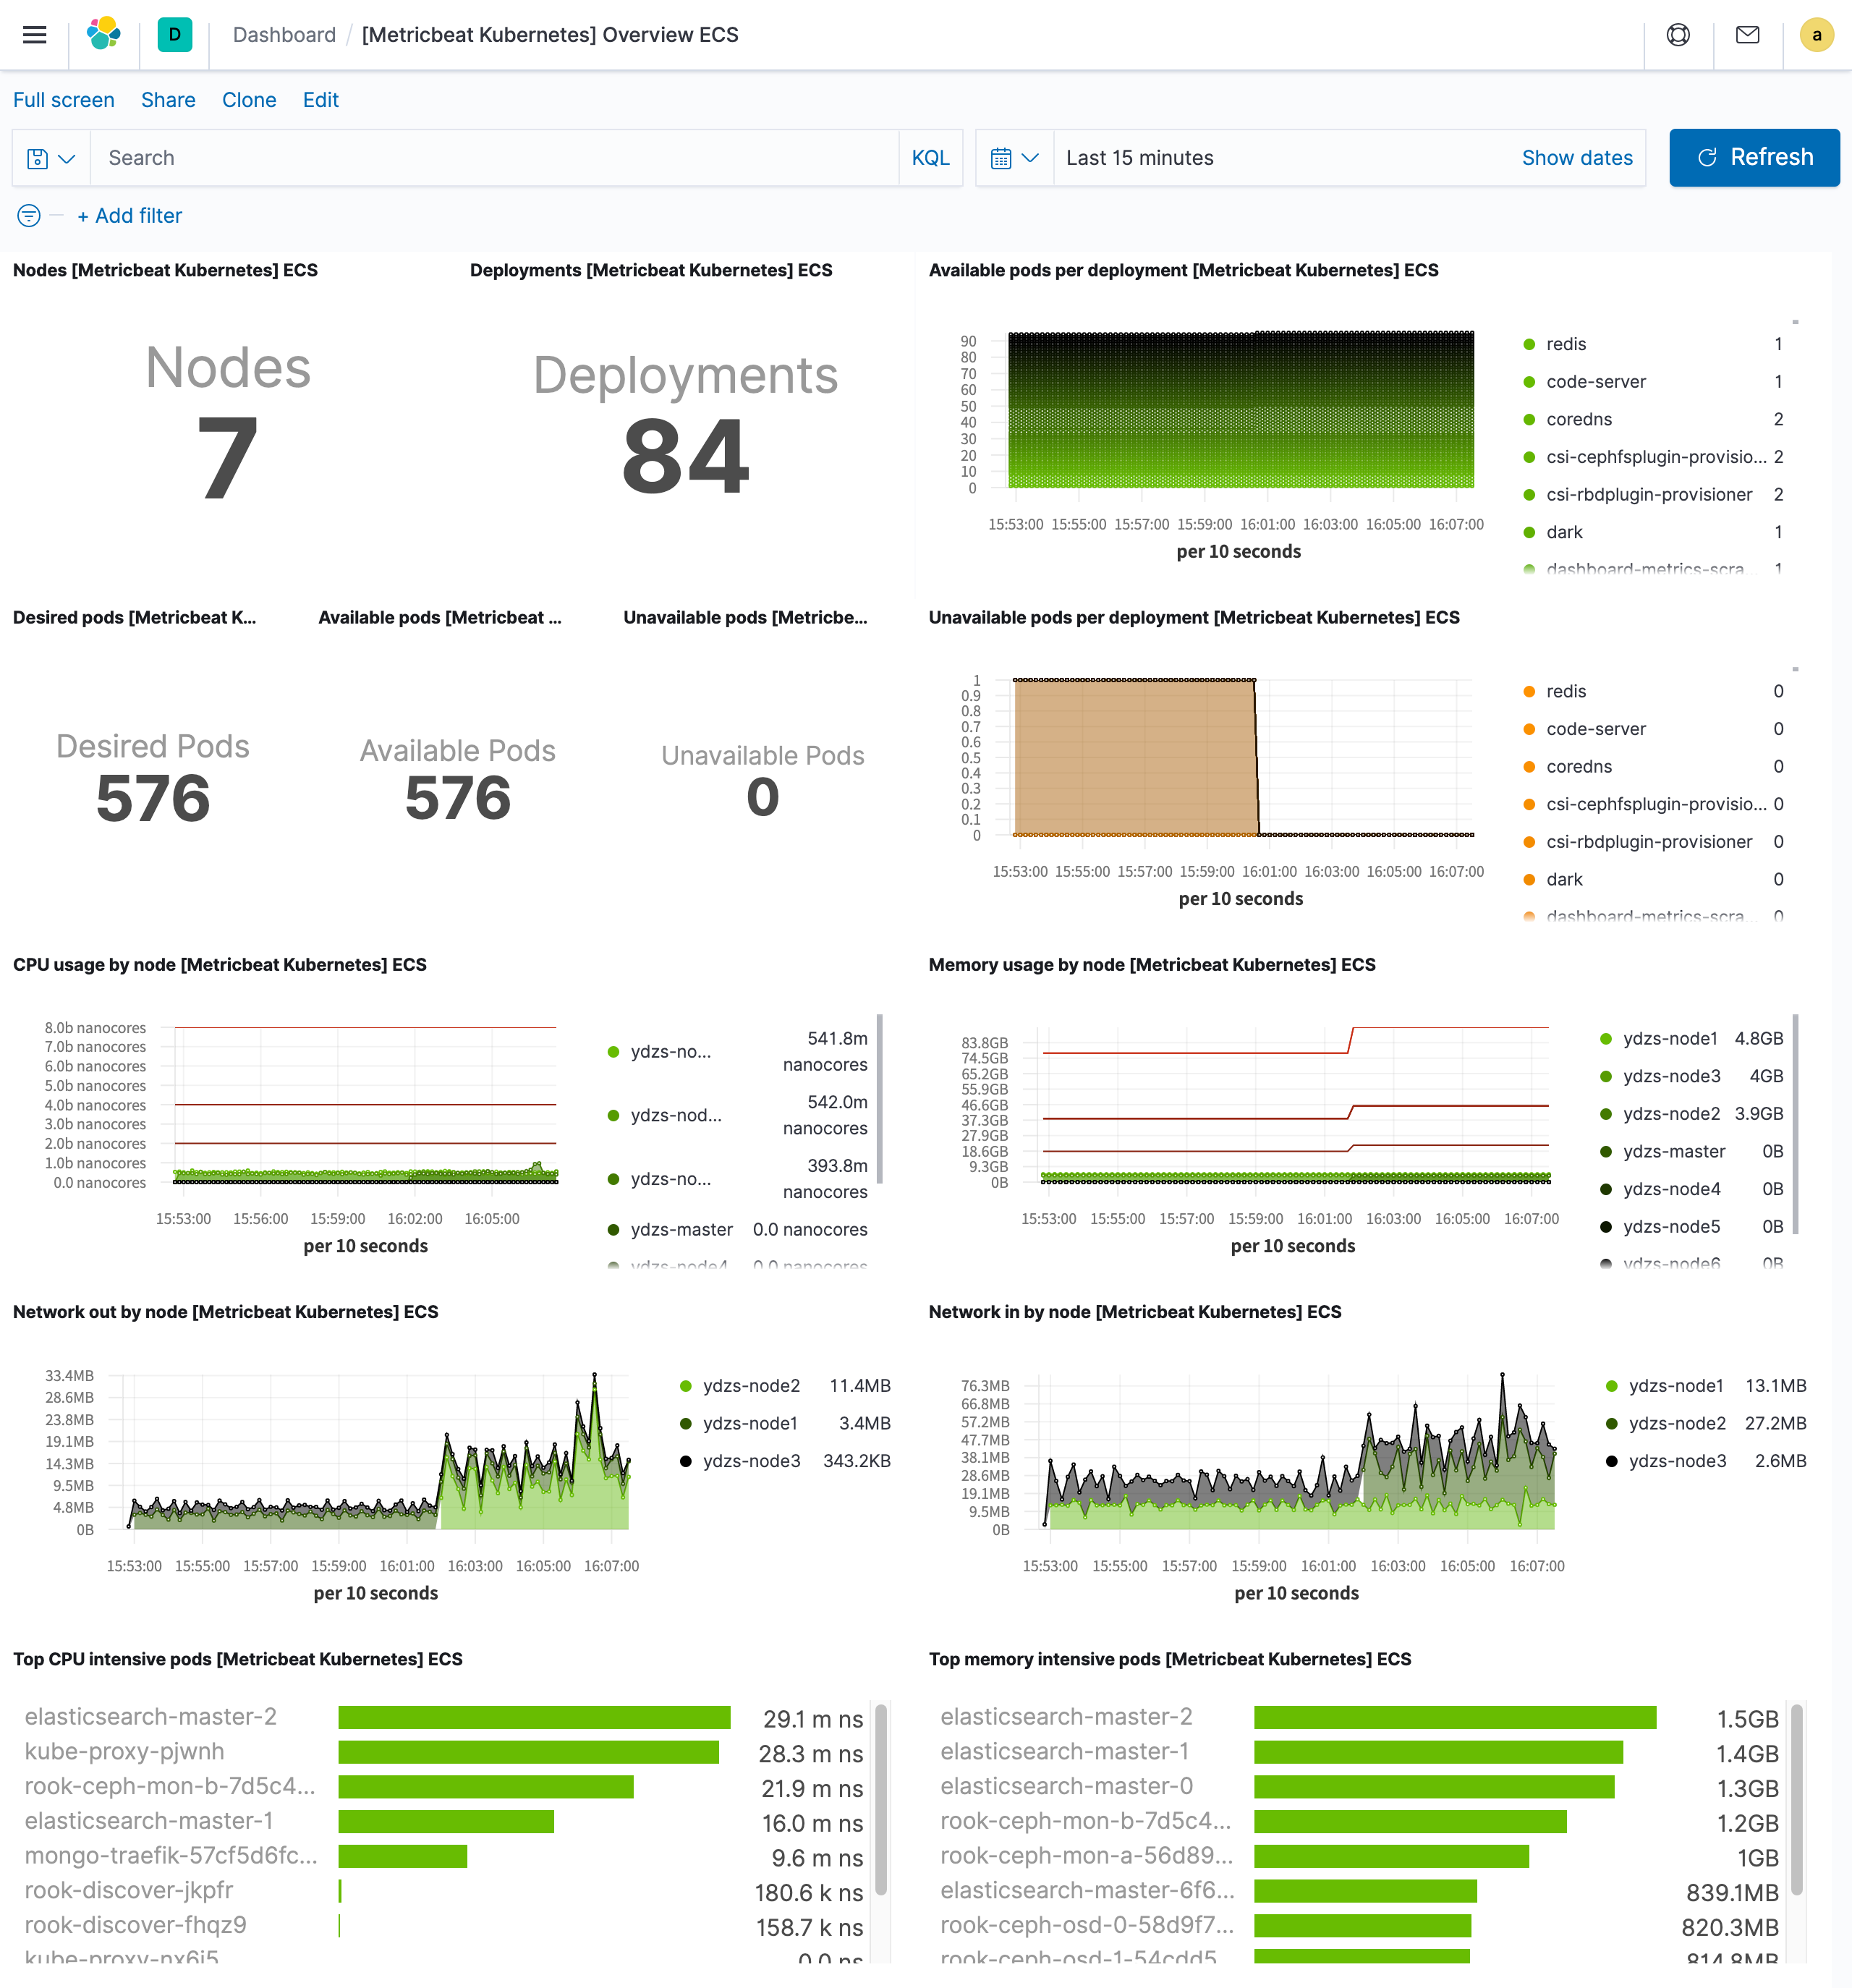
Since we have set the property setup.dashboards.enabled=true in the configuration file, Kibana will import some pre-existing Dashboards. For example, if we want to see information about cluster nodes, we can check the [Metricbeat Kubernetes] Overview ECS dashboard: [Metricbeat Kubernetes] Overview ECS.
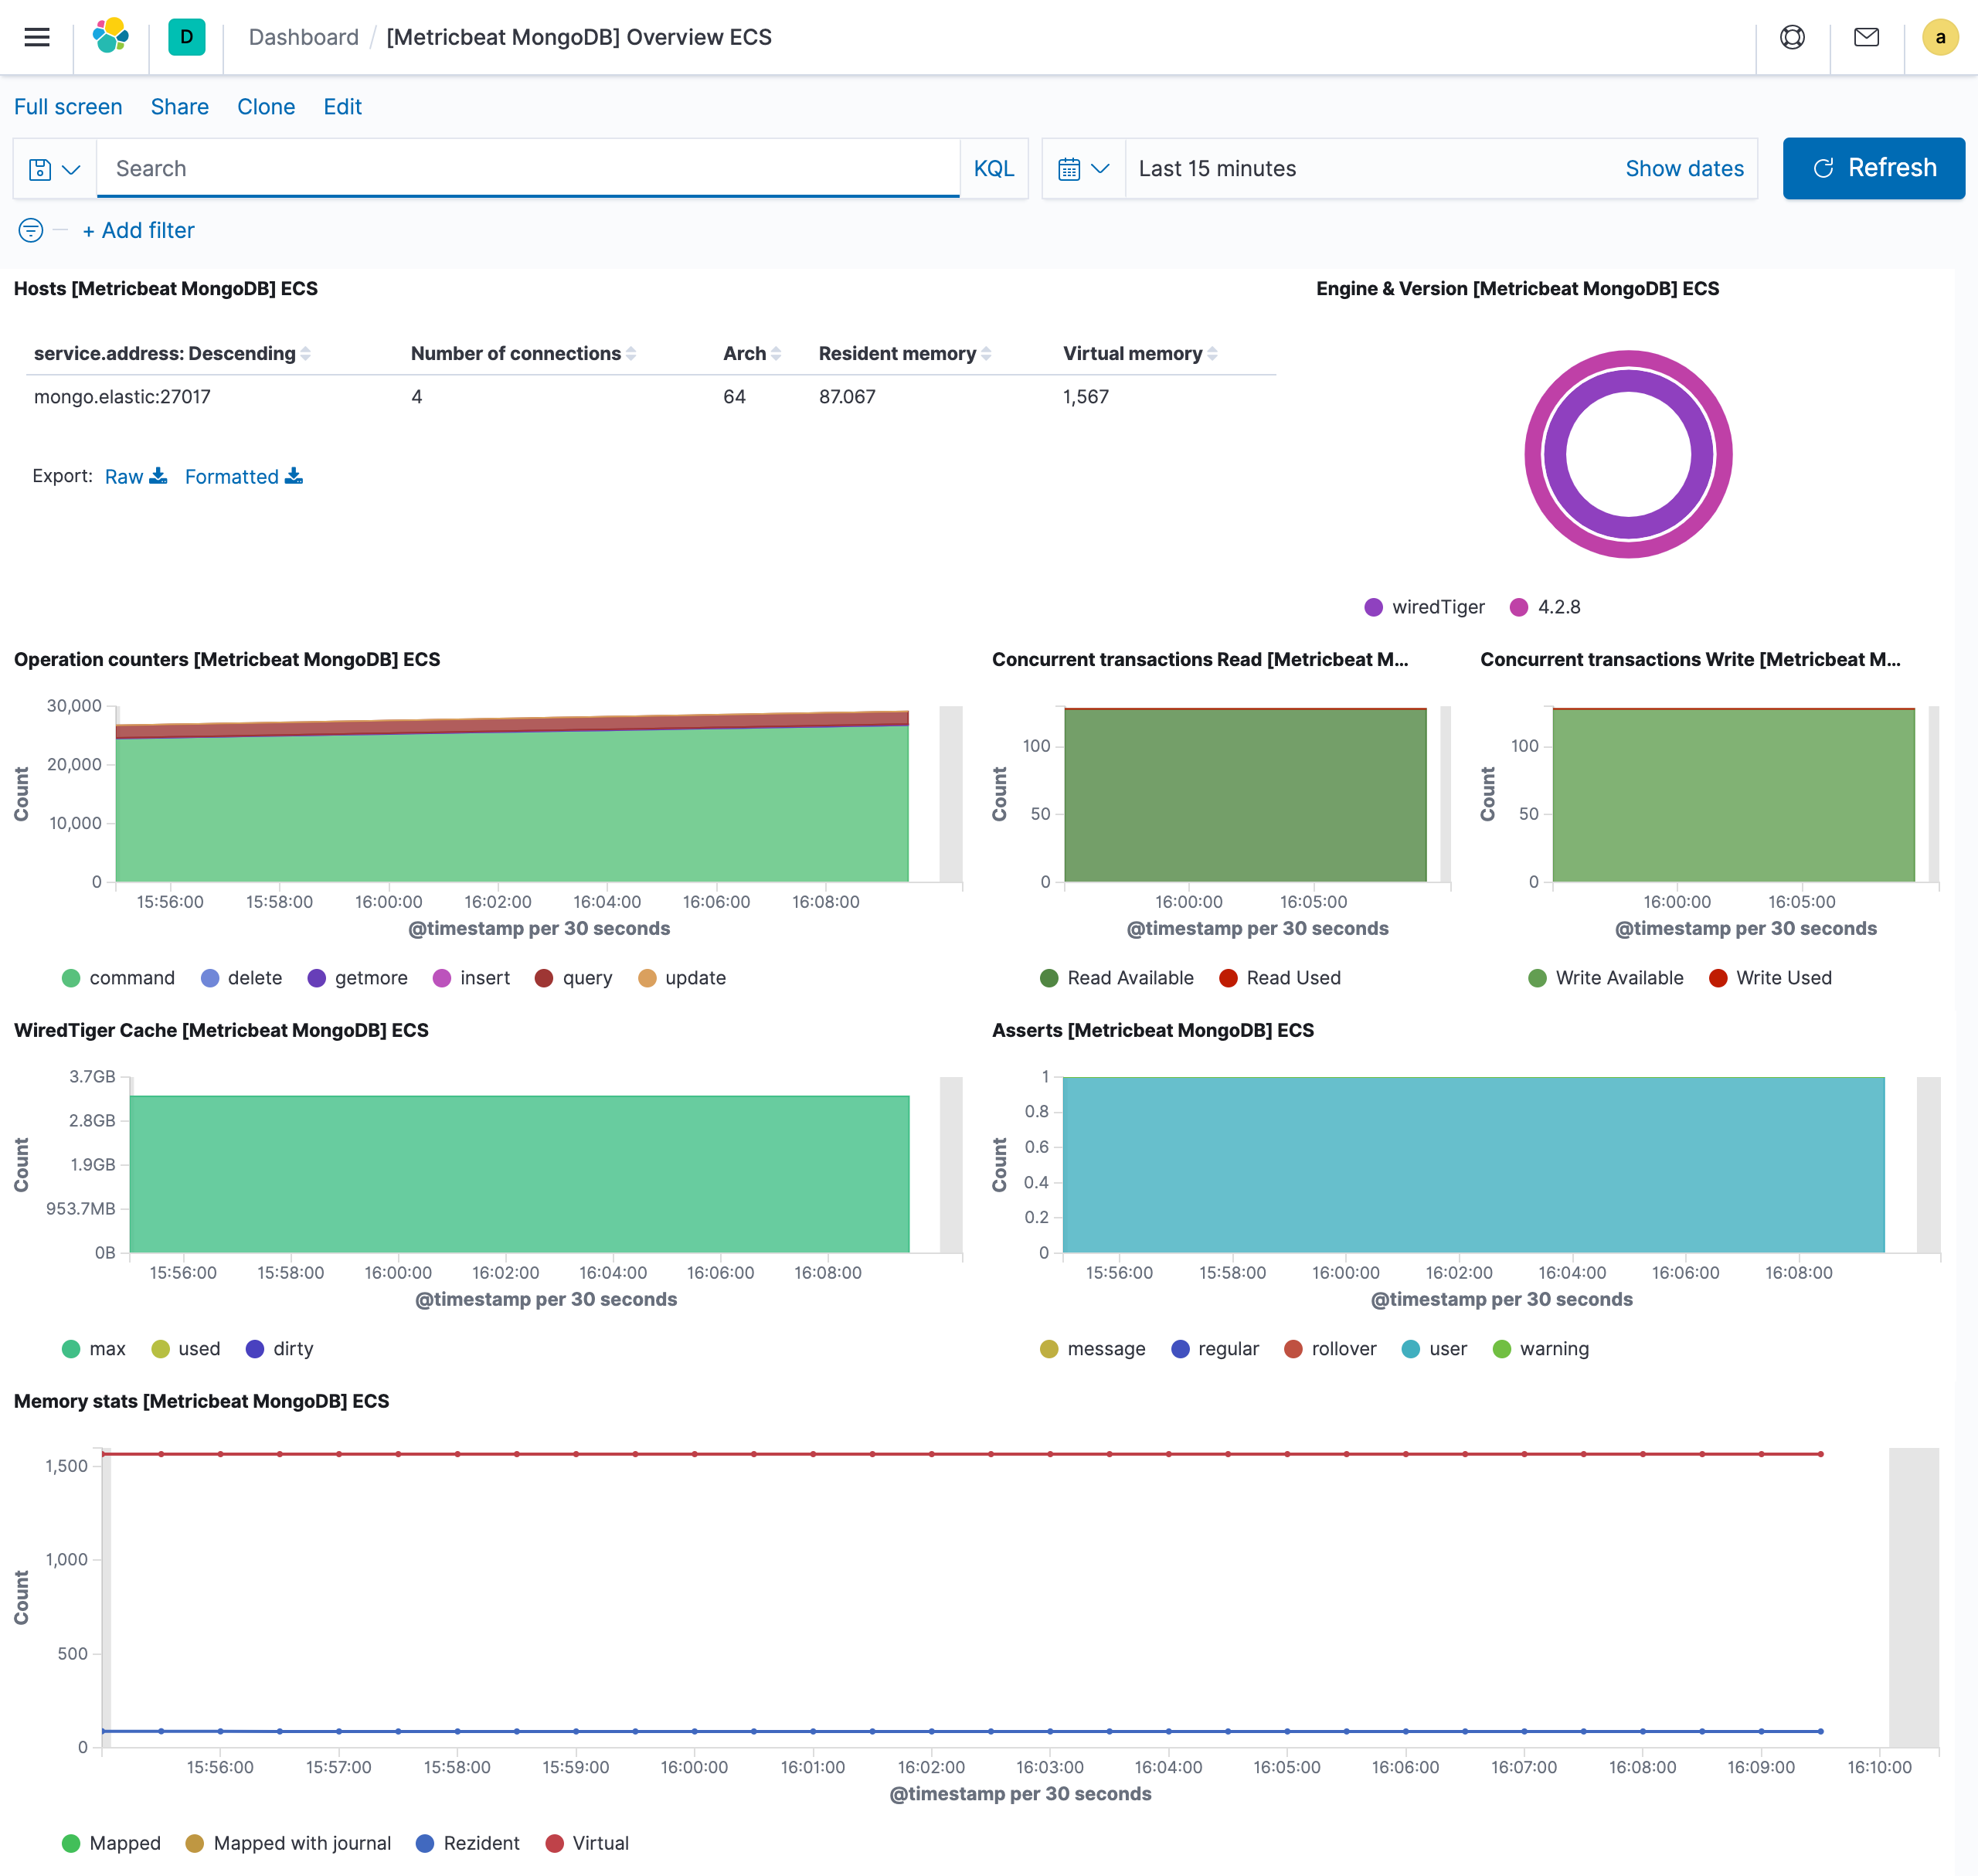
We have also enabled the mongodb module separately, and we can use the [Metricbeat MongoDB] Overview ECS dashboard to see the monitoring information.
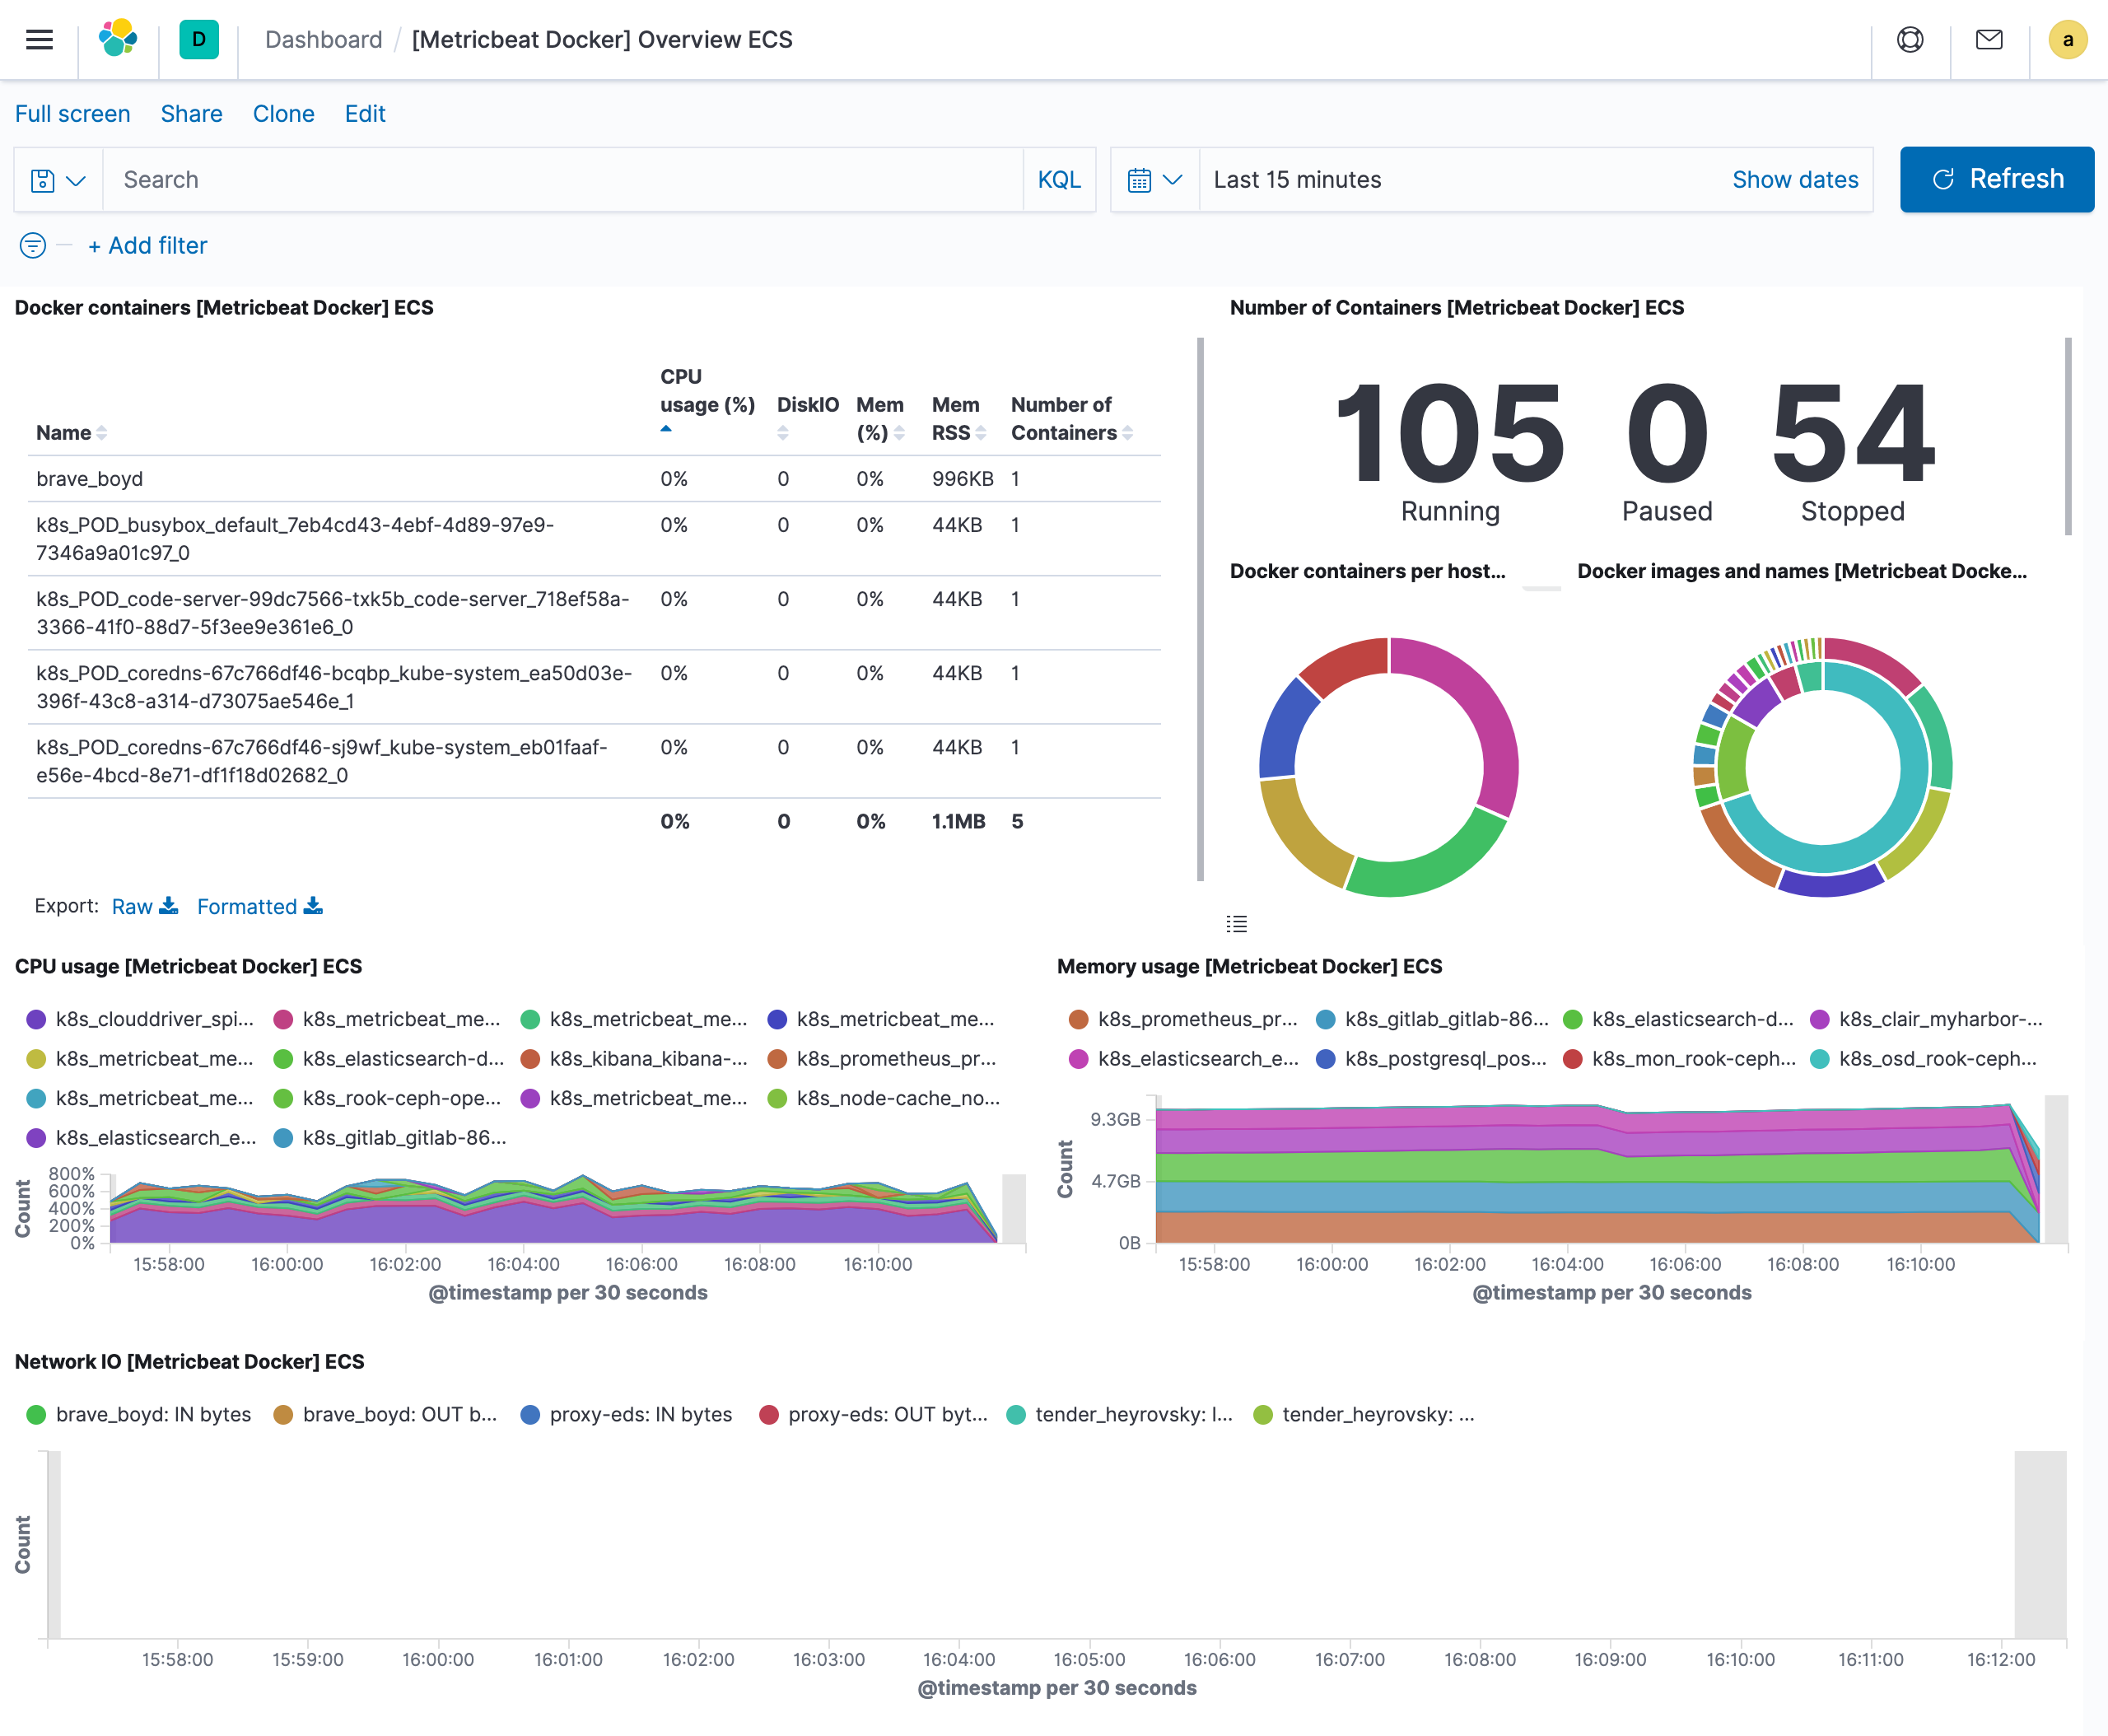
We have also enabled the docker module and can also use the [Metricbeat Docker] Overview ECS dashboard to view monitoring information.
At this point we’ve finished using Metricbeat to monitor Kubernetes cluster information, and in the following we’ll learn how to use Filebeat to collect logs to monitor Kubernetes clusters.