When we use Grafana Dashboard to display our monitoring charts, we often go to someone else’s Dashboard and change it, but this also causes many people using Grafana to have no idea how to customize a Dashboard, although it is not very difficult. Here we introduce a relatively new tool: DARK, full name Dashboards As Resources in Kubernetes., which means that through the Kubernetes resource object to define Grafana Dashboard, the implementation principle is also very simple, that is, the CRD to define the Dashboard, and then through the interaction with Grafana’s API Token to achieve the CRUD of the Dashboard.
Let’s look at how to use DARK to define a Grafana Dashboard.
First Clone the project code.
1
|
$ git clone https://github.com/K-Phoen/dark.git
|
Then install the CRD resources
1
|
$ kubectl apply -f k8s/crd.yaml
|
Then create Grafana’s API KEYS from the Secret object. In the Grafana main interface, select the Configuration menu on the left -> API Keys to create API Keys, and select the Editor role to.
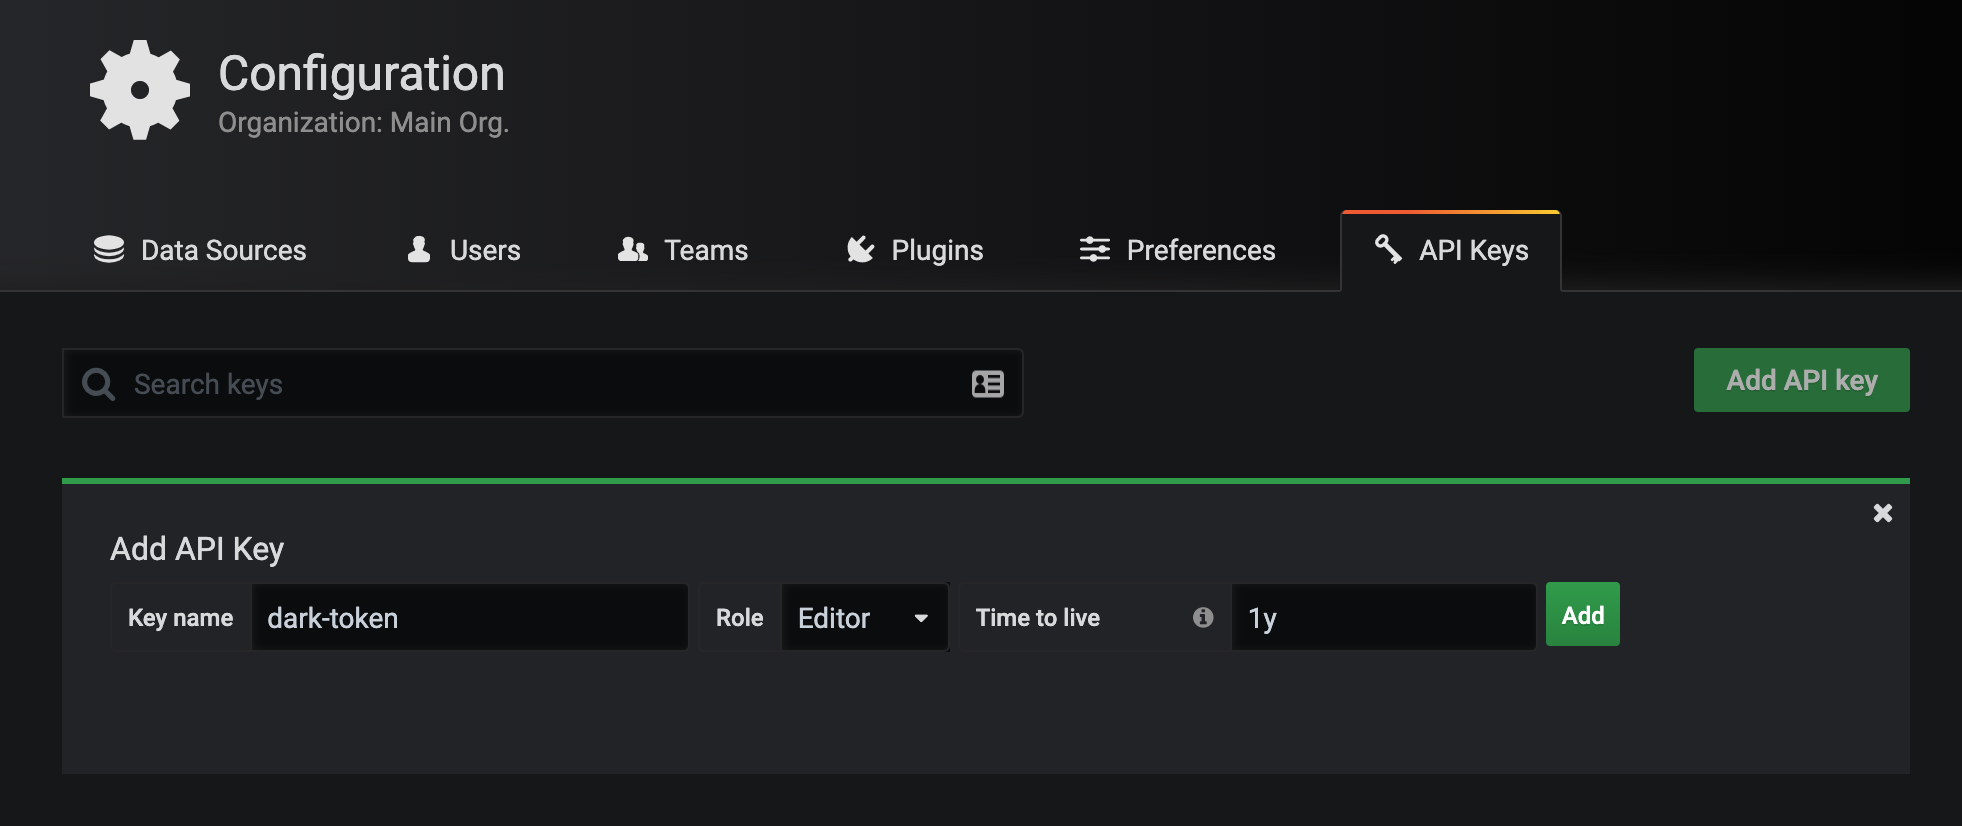
Once created, a dialog box will pop up with the corresponding API Keys, use this KEY to create a corresponding Secret object.
1
|
$ kubectl create secret generic dark-tokens --from-literal=grafana=<替换成APIKEY>
|
Then modify the k8s/cluster-role.yaml file as follows.
 1
 2
 3
 4
 5
 6
 7
 8
 9
10
11
12
13
14
15
16
17
18
19
20
21
22
23
24
25
26
27
28
29
|
apiVersion: v1
kind: ServiceAccount
metadata:
  name: dark
---
kind: ClusterRole
apiVersion: rbac.authorization.k8s.io/v1
metadata:
  name: dashboards-viewer
rules:
- apiGroups: ["k8s.kevingomez.fr"]
  resources: ["grafanadashboards"]
  verbs: ["get", "watch", "list"]
- apiGroups: [""]
  resources: ["events"]
  verbs: ["create", "patch"]
---
apiVersion: rbac.authorization.k8s.io/v1
kind: ClusterRoleBinding
metadata:
  name: dashboards-viewer-cluster
subjects:
  - kind: ServiceAccount
    name: dark
    namespace: default
roleRef:
  kind: ClusterRole
  name: dashboards-viewer
  apiGroup: rbac.authorization.k8s.io
|
Then create the resource object above.
1
|
$ kubectl apply -f k8s/cluster-role.yaml
|
Modify the k8s/deployment.yaml file, change the GRAFANA_HOST environment variable to your own Grafana address, and since I have Grafana installed in the Kubernetes cluster here, I directly configure it with DNS, and then add the dark created above ServiceAccount.
 1
 2
 3
 4
 5
 6
 7
 8
 9
10
11
12
13
14
15
16
17
18
19
20
21
22
23
24
25
26
27
28
29
30
31
|
apiVersion: apps/v1
kind: Deployment
metadata:
  name: dark
  labels:
    app: dark
spec:
  selector:
    matchLabels:
      app: dark
  template:
    metadata:
      labels:
        app: dark
    spec:
      volumes:
      - name: dark-tokens
        secret:
          secretName: dark-tokens
      serviceAccountName: dark
      containers:
      - name: dark
        image: kphoen/dark:latest
        env:
        - name: GRAFANA_HOST
          value: http://grafana.kube-mon:3000
        - name: GRAFANA_TOKEN
          valueFrom:
            secretKeyRef:
              key: grafana
              name: dark-tokens
|
Create the above Controller directly after the modification is completed.
1
2
3
4
|
$ kubectl apply -f k8s/deployment.yaml
$ kubectl get pods -l app=dark
NAME                    READY   STATUS    RESTARTS   AGE
dark-6bd956b8d6-755p2   1/1     Running   0          36m
|
Now that the Controller is defined, we can actually go through the CRD object to define the Grafana Dashboard, as shown below to define a GrafanaDashboard object, in which we can define the content according to our needs, such as defining annotations, variables, graph, table can be defined, but of course the most important thing is to have the correct data source and query statement: (example-dashboards.yaml)
 1
 2
 3
 4
 5
 6
 7
 8
 9
10
11
12
13
14
15
16
17
18
19
20
21
22
23
24
25
26
27
28
29
30
31
32
33
34
35
36
37
38
39
40
41
42
43
44
45
46
47
48
49
50
51
52
53
54
55
56
57
58
59
60
61
62
63
64
65
66
67
68
69
70
71
72
73
74
75
76
77
78
79
80
81
82
83
84
85
86
87
88
89
90
91
92
93
|
apiVersion: k8s.kevingomez.fr/v1
kind: GrafanaDashboard
metadata:
  name: example-dashboard
folder: "Test folder"
spec:
  title: Awesome dashboard
  editable: true
  shared_crosshair: true
  tags: [generated, yaml]
  auto_refresh: 10s
  tags_annotations:
    - name: Deployments
      datasource: "Prometheus"
      color: "#5794F2"
      tags: ["deploy", "production"]
  variables:
    - interval:
        name: interval
        label: Interval
        values: ["30s", "1m", "5m", "10m", "30m", "1h", "6h", "12h"]
    - query:
        name: status
        label: HTTP status
        datasource: Prometheus
        request: "label_values(prometheus_http_requests_total, code)"
    - const:
        name: percentile
        label: Percentile
        default: 80
        values_map:
          50th: "50"
          75th: "75"
          80th: "80"
          85th: "85"
          90th: "90"
          95th: "95"
          99th: "99"
    - custom:
        name: vX
        default: v2
        values_map:
          v1: v1
          v2: v2
  rows:
    - name: Prometheus
      panels:
        - graph:
            title: HTTP Rate
            height: 400px
            datasource: Prometheus
            targets:
              - prometheus:
                  query: "rate(promhttp_metric_handler_requests_total[$interval])"
                  legend: "{{handler}} - {{ code }}"
        - graph:
            title: Heap allocations
            height: 400px
            datasource: Prometheus
            targets:
              - prometheus:
                  query: "go_memstats_heap_alloc_bytes"
                  legend: "{{job}}"
                  ref: A
        - table:
            title: Threads
            datasource: Prometheus
            targets:
              - prometheus:
                  query: "go_threads"
            hidden_columns: ["Time"]
            time_series_aggregations:
              - label: AVG
                type: avg
              - label: Current
                type: current
        - single_stat:
            title: Heap Allocations
            datasource: Prometheus
            targets:
              - prometheus:
                  query: 'go_memstats_heap_alloc_bytes{job="prometheus"}'
            unit: bytes
            thresholds: ["26000000", "28000000"]
            color: ["value"]
    - name: "Some text, because it might be useful"
      panels:
        - text:
            title: Some awesome text?
            markdown: "Markdown syntax help: [commonmark.org/help](https://commonmark.org/help/)\n${percentile}"
        - text:
            title: Some awesome html?
            html: "Some <b>awesome</b> html?"
|
Again, create the above example file directly.
 1
 2
 3
 4
 5
 6
 7
 8
 9
10
11
12
13
|
$ kubectl apply -f example-dashboards.yaml
$ kubectl get dashboards
NAME                AGE
example-dashboard   35m
$ kubectl logs -f dark-6bd956b8d6-755p2
W0327 11:10:24.356194       1 client_config.go:543] Neither --kubeconfig nor --master was specified.  Using the inClusterConfig.  This might not work.
I0327 11:10:24.360886       1 controller.go:87] Setting up event handlers
I0327 11:10:24.362305       1 controller.go:118] Starting dark-controller
I0327 11:10:24.362341       1 controller.go:121] Waiting for informer caches to sync
I0327 11:10:24.462733       1 controller.go:126] Starting workers
I0327 11:10:24.462820       1 controller.go:132] Started workers
I0327 11:13:22.641706       1 controller.go:197] Successfully synced 'default/example-dashboard'
I0327 11:13:22.643061       1 event.go:278] Event(v1.ObjectReference{Kind:"GrafanaDashboard", Namespace:"default", Name:"example-dashboard", UID:"efc6f96f-c7fc-40b5-8b8f-831a95b0a042", APIVersion:"k8s.kevingomez.fr/v1", ResourceVersion:"48490732", FieldPath:""}): type: 'Normal' reason: 'Synced' GrafanaDashboard synced successfully
|
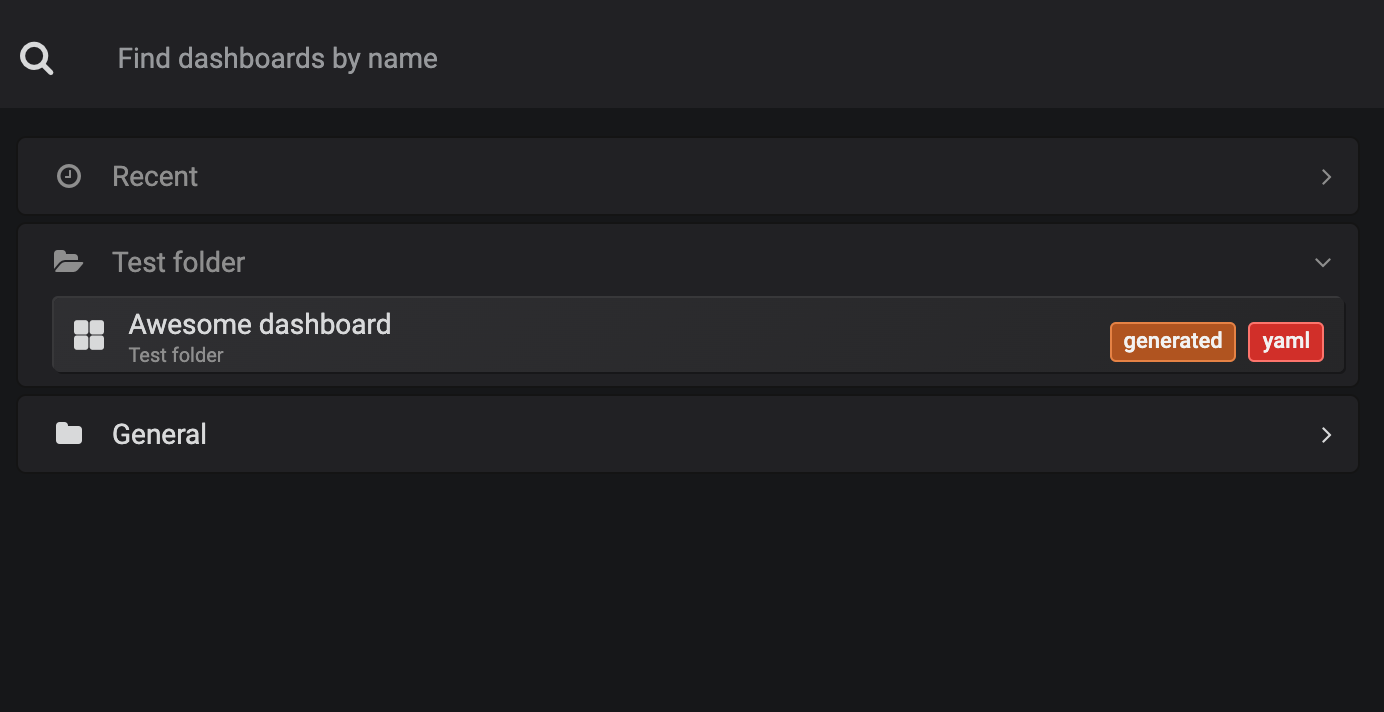
You can also see the corresponding logging information in the Controller. After the resource object is created successfully, you can now check the Grafana page to see that a new Test folder folder and Awesome dashboard have been added.
Looking at the Dashboard, you can see the same information as the various charts defined in the CRD above.
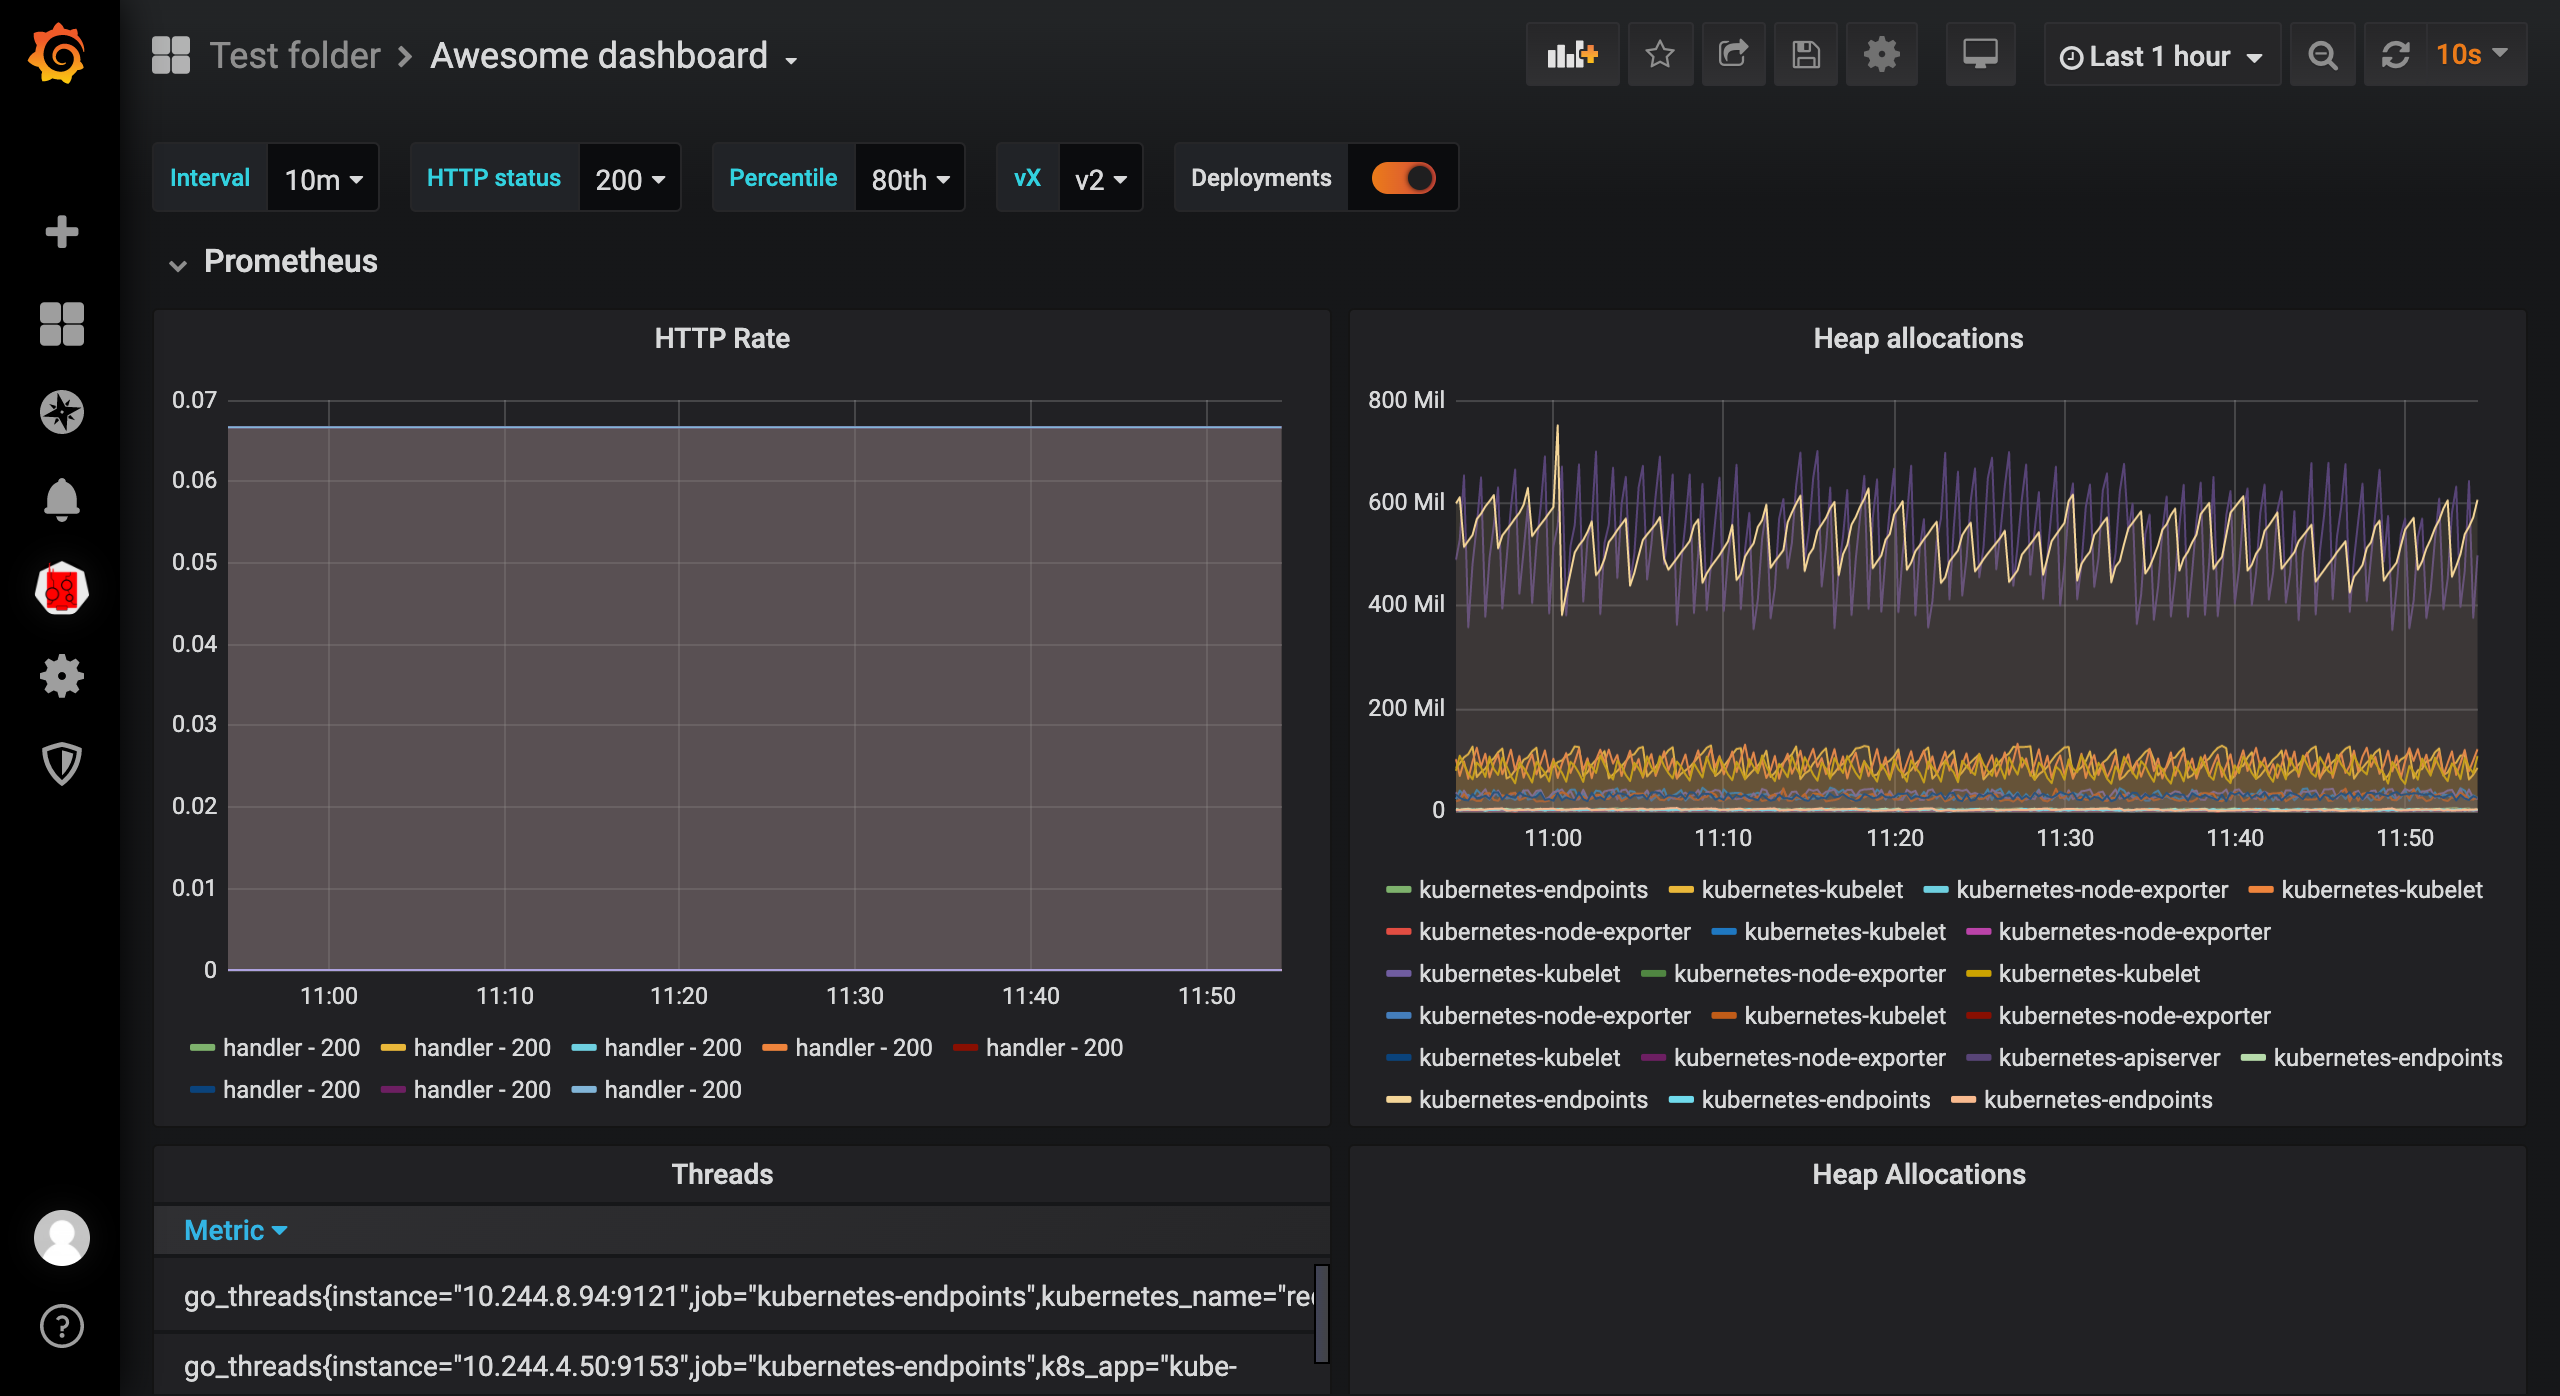
This way we define the Grafana Dashboard using Kubernetes resource objects, which is obviously more elegant than going directly to the page and configuring it manually, and is in line with the everything as code idea 🤯.