When using Prometheus for monitoring, alerting is done through AlertManager, but there are many people who are confused about the configuration related to alerting and are not quite sure when exactly it will be done. Here we will briefly introduce a few confusing parameters in AlertManager.
First of all, there are two global parameters scrape_interval and evaluation_interval in Prometheus. The scrape_interval parameter represents the time interval at which Prometheus grabs metrics data from various metrics interfaces, and the evaluation_interval parameter represents the time interval at which Prometheus calculates the evaluation of an alarm rule.
When an alarm rule is evaluated, its status may be one of inactive, pending, or firing. After evaluation, the status is sent to the associated AlertManager to potentially start or stop the delivery of alert notifications.
This is where the group_by parameter configured in the AlertManager comes into play. To avoid sending similar alert notifications in succession, related alerts can be grouped into the same group for alerting. In some cases, such as when a large number of alarms are triggered at the same time due to system downtime, the grouping mechanism can combine these triggered alarms into a single alert notification to avoid receiving a large number of alerts at once.
|
|
When a new alarm group is created, it needs to wait at least group_wait to initialize the alarms.
This effectively buffers the alerts sent from Prometheus to AlertManager by grouping them under the same label instead of sending them all.
But this may also lead to longer waiting time for incoming alert notifications. Another problem is that the next time we evaluate an alarm rule, we will receive the same group alarm notification again, and we can use the group_interval parameter to configure that after the last alarm notification is sent to a group, we wait for the group_interval time before sending the triggered alarm and the resolved alarm to the receiver. resolved alarms to the receiver.
In addition there is a repeat_interval parameter, this parameter is mainly used to configure the alarm information has been sent successfully, and then triggered to send the time interval, generally different types of alarm business to change the parameter configuration is not quite the same, for the more important and urgent can be set to change the parameter slightly smaller, for less urgent can be set slightly larger.
These are some of the global parameters configured in Prometheus or AlertManager, for specific alert rules there is still time to configure, as shown in the following alert rules.
|
|
Above we have defined a grouping of alarm rules named test-node-mem, an alarm rule consists of the following parts.
alert: the name of the alarm ruleexpr: is used to make the alarm rule PromQL query statementfor: evaluates the waiting time (Pending Duration), used to indicate that the alarm will be sent only when the trigger condition lasts for a certain period of time, and the new alarm status generated during the waiting period ispending.labels: custom tabs, allowing users to specify a list of additional tabs to be attached to the alertannotations: specifies another set of tags that are not used as identifiers for alarm instances, but are often used to store additional information for alarm message presentation and such
The for field also affects our alarm arrival time, this parameter is used to indicate that the alarm is sent only when the trigger condition lasts for a certain period of time, and the new alarm status generated during the waiting period is pending, this parameter is mainly used for noise reduction, many metrics like response time are jittered, by specifying Pending Duration, we can filter out these transient jitter, which allows us to focus on issues that really have a lasting impact.
So in some cases, we can calculate that some of the indicators on our monitoring charts have reached the alert threshold, but they do not necessarily trigger the alert rule, for example, if we set the Pending Duration of 1 minute in the rule above, the alert will not be triggered for the following case, because the duration is too short, not reaching one minute.
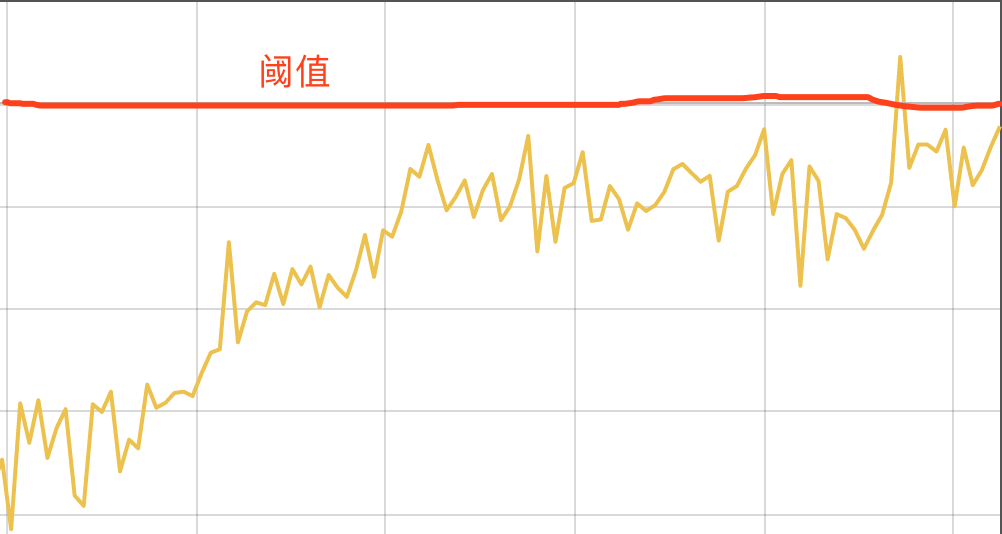
If the alarm rule exceeds the threshold for more than Pending Duration then the alarm will be triggered, and after the alarm is generated, it will go through Alertmanager’s grouping, suppression processing, silent processing, de-duplication processing and noise reduction processing before it is sent to the receiver. So from the time an alarm rule is evaluated to the time it triggers an alarm to the time it is sent to the recipient, there are a series of factors that intervene in between, so it is not surprising that sometimes you see on the monitoring chart that the threshold has been reached and you do not receive a monitoring alarm in the end.