DevOpsProdigy KubeGraf is an excellent Grafana Kubernetes plugin, an update to Grafana’s official Kubernetes Plugin. The plugin can be used to visualize and analyze the performance of a Kubernetes cluster, visually displaying the metrics and characteristics of the main services of the Kubernetes cluster through various graphs, and can also be used to examine the application lifecycle and error logs.
Environment Requirements
To install and use the DevOpsProdigy KubeGraf plugin you need to meet the following requirements.
- Grafana > version 5.0.0
- Need to deploy Prometheus + node-exporter + kube-state-metrics on a Kubernetes cluster
- Reliance on the Grafana-piechart-panel plugin
Features
The plugin contains 3 main information pages with detailed information about Kubernetes clusters.
Application Overview
This plugin displays some basic monitoring information for the applications on top of a Kubernetes cluster.
- Application logic diagram
- Distribution of Kubernetes objects
- Visualization of the application lifecycle and basic feature information
- descriptive information about the service ports that are allowed to be accessed in the cluster

Cluster Status
- Cluster and cluster node status information
- Detailed information on the lifecycle of the monitored applications
- Visualization of the location of services in the cluster

Node Overview
- Cluster node information
- Information on used and allocated resources (memory, CPU utilization) and number of containers
- Physical distribution of Pods

Dashboards
In addition to the usual information provided on the plugin’s homepage, the plugin provides five additional Dashboards for us to track various performance metrics of the cluster.
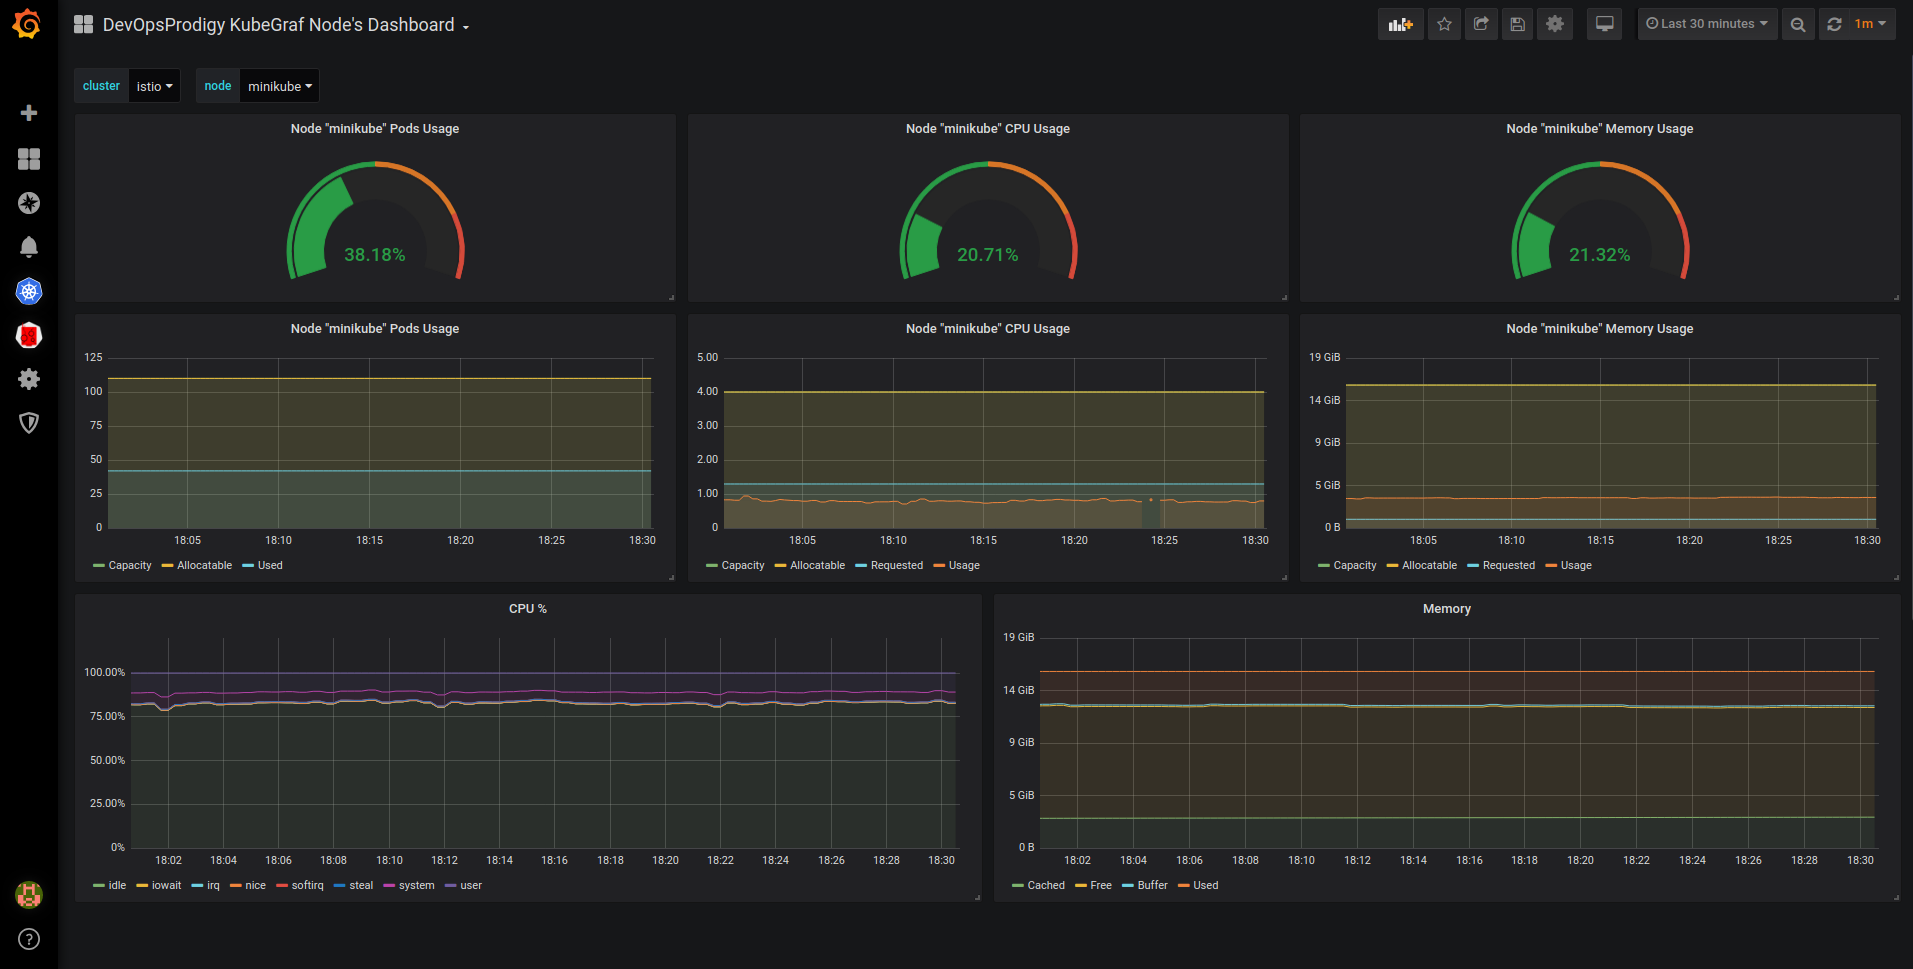
- node dashboard
This is a Dashboard with node metrics that shows resource usage, such as CPU utilization, memory consumption, percentage of CPU time in idle/iowait mode, and disk and network status.
- pod dashboard
You can display the corresponding resource usage according to the selected Pod.

- deployments dashboard
The Deployment dimension displays the resource usage associated with the corresponding resource object.

- statefulsets dashboard
- daemonsets dashboard
The above three Dashboards show the number of copies of available/unavailable applications and the container status of those applications, and also track container restarts.
Installation
We have Grafana here also installed on top of a Kubernetes cluster, so we need to go into the container to install it:.
|
|
After the plugin is installed, you need to restart Grafana before it takes effect. We are a Pod here, so you can just delete the Pod rebuild (provided of course that the plugin directory is well persisted):
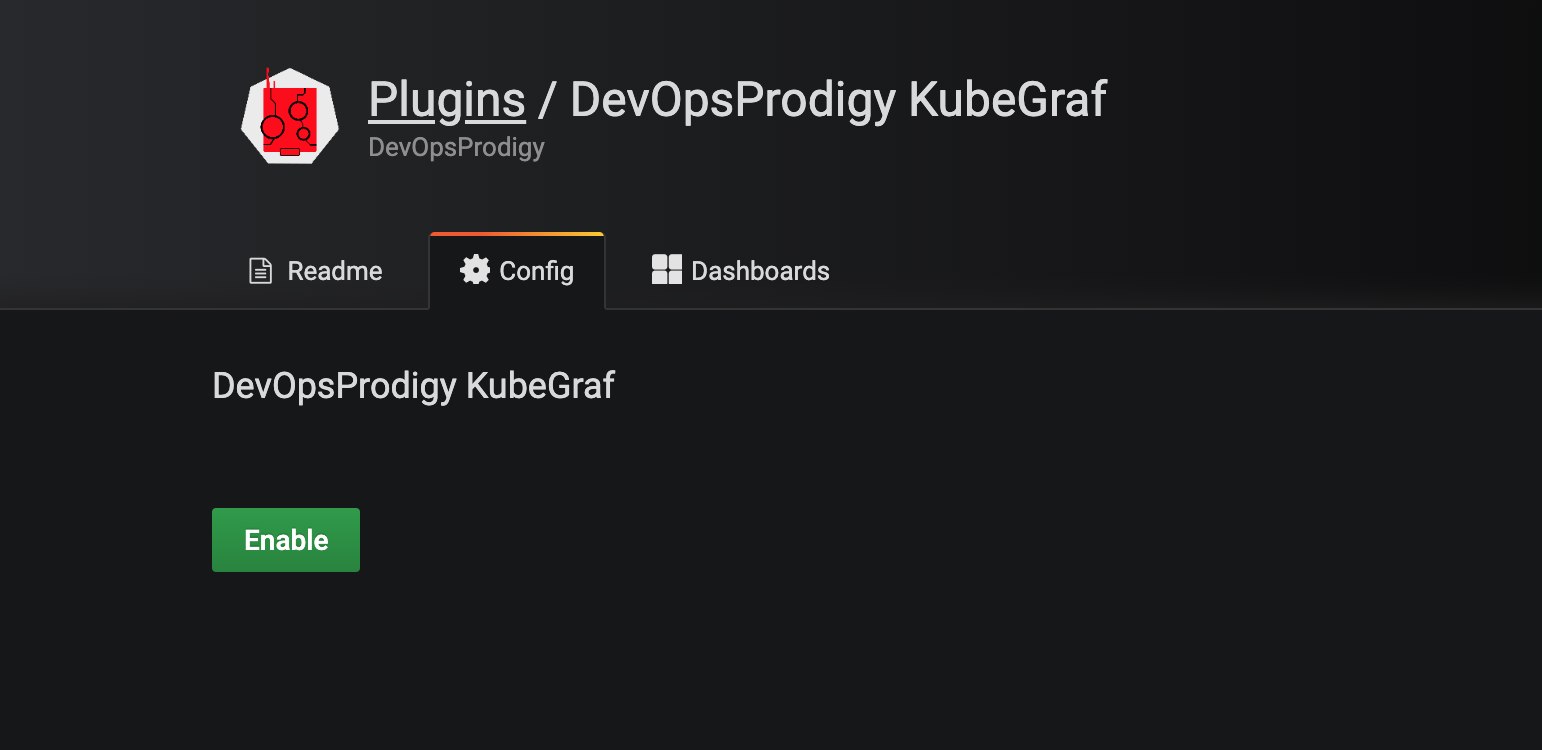
Once the Pod removal rebuild is complete, the plugin is installed successfully. Then open Grafana in your browser and find the plugin and click enable to enable the plugin.
Click Set up your first k8s-cluster to create a new Kubernetes cluster:
- Just use the Kubernetes Service address for the URL: https://kubernetes.default:443
- Access access mode is used:
Server(default) - Since the plugin accesses various resource objects information of the Kubernetes cluster, we need to configure the access rights, here we can simply use kubectl’s
kubeconfigto configure it. - Check the
TLS Client AuthandWith CA Certoptions under Auth - The value under
TLS Auth Detailscorresponds to the certificate information inkubeconfig. For example, ourkubeconfigfile here is in the following format.
|
|
Then the value of CA Cert corresponds to the base64 decoded value of <certificate-authority-data> in kubeconfig; the value of Client Cert corresponds to the base64 decoded value of <client-certificate-data>; the value of Client Key corresponds to the base64 decoded value of <client-key-data>; and the value of Client Key corresponds to the base64 decoded value of The value of Client Key corresponds to the value of <client-key-data> after base64 decoding.
For base64 decoding, we recommend using some online services such as https://www.base64decode.org/ , which is very convenient.
- Finally, select the prometheus datasource from the
additional datasourcesdrop-down list. - Click
Save & Testto save it successfully.
Once the plugin is configured, the DevOpsProdigy KubeGraf plugin portal will appear in the left sidebar, and you can view the status of the entire cluster and the related Dashboard monitoring charts through the plugin page.
