You should be careful about setting the CPU limit for loads in k8s. A value that is too small can introduce extra, meaningless latency into your program, and a value that is too large can introduce too large a blast radius and weaken the overall stability of the cluster.
request and limit
One of the major benefits of k8s is resource isolation. By setting the request and limit of the load, we can easily allow different programs to coexist on the right node.
The request is for scheduling, which ensures that the combined CPU request and memory request for all loads on the node are no greater than the CPU and memory that the node itself can provide, and the limit is for the node (kubelet), which ensures that the load only uses so much CPU and memory on the node. For example, the following configuration means that a single load will be dispatched to a node with a remaining CPU request greater than 0.1 cores and a remaining request memory greater than 200MB, and that the load can run with no more than 0.4 cores of CPU usage (exceeding this will result in a flow limit) and no more than 300MB of memory usage (exceeding this will result in an OOM kill and restart).
CPU utilization
Unlike memory, CPU is quantitative and has only two states, “in use” and “idle”.
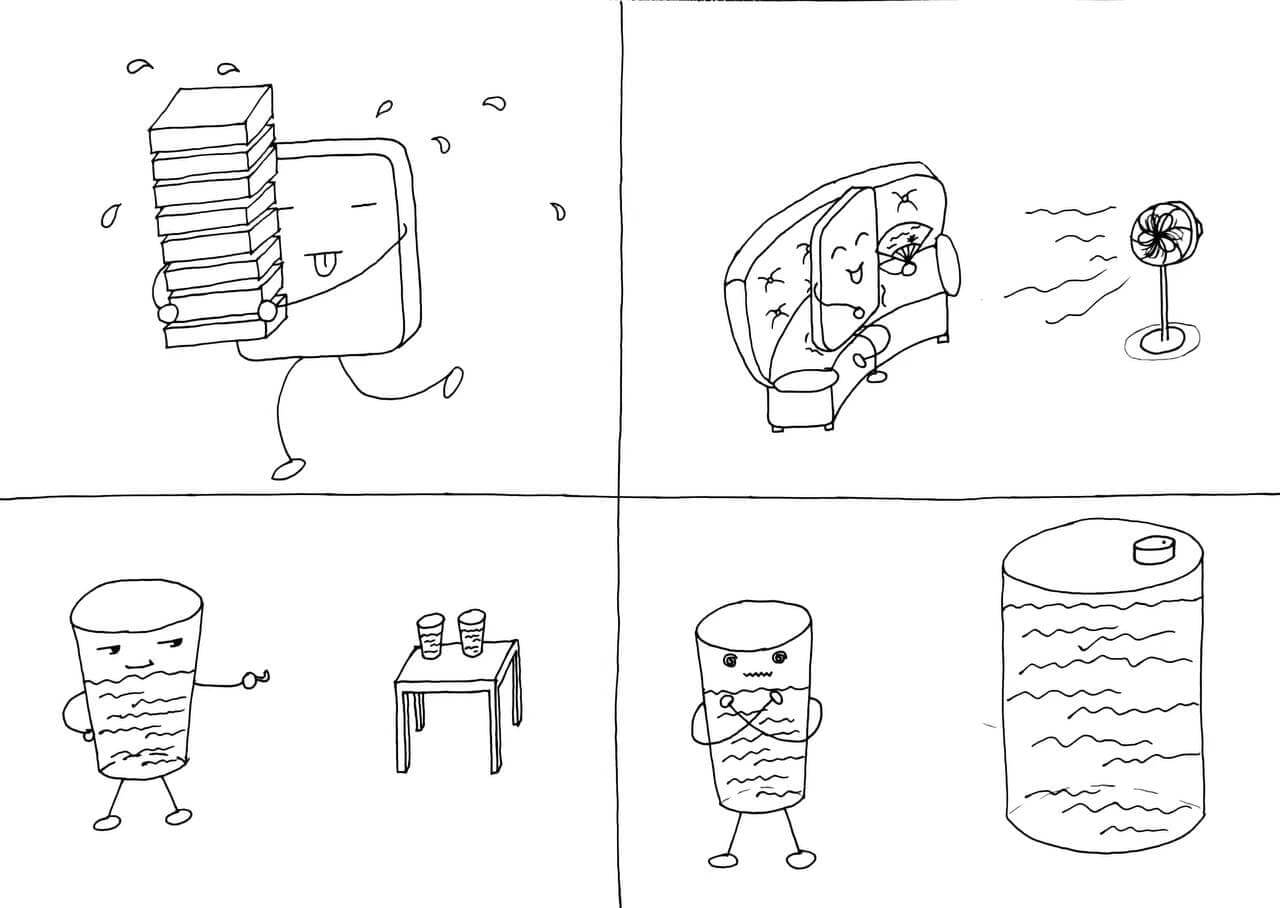
I talked to my wife about the difference between CPU and RAM, and she helped me draw an illustration Photo/my wife
When we say that the memory usage is 60%, we are saying that 60% of the memory on space has been used, and 40% of the space is available to put in load. But when we say that a core of the CPU is 60% utilized, we are saying that this core of the CPU is busy 60% of the time at time during the sampled time period, and 40% of the time is asleep.
When you set the CPU limit for a load, this temporal difference may have an unexpected effect on you - excessive slowdown and limiting, where the node CPU is obviously not busy, but the node deliberately does not allow your load to use the CPU at full speed, and the service latency rises.
CPU limiting
k8s uses CFS (Completely Fair Scheduler) to limit the CPU usage of the load, the mechanism of CFS itself is more complex, but the k8s documentation gives a concise explanation, the gist of which is as follows.
- CPU usage is measured in 100ms cycles.
- CPU limit determines the upper limit of CPU time that can be used by the container per metering cycle (100ms).
- If the CPU time usage of the container reaches the upper limit in this cycle, CPU limit starts and the container can only continue execution in the next cycle.
- 1 CPU = 100ms CPU time per metered cycle, and so on, 0.2 CPU = 20ms CPU time per metered cycle, 2.5 CPU = 250ms CPU time per metered cycle.
- If the program uses multiple cores, the CPU time statistics are accumulated.
As an example, suppose an API service uses two threads A, B (2 cores) in response to a request, using 60ms and 80ms respectively, where thread B is triggered 20ms late, we see that the API service can give a response after 100ms.

If the CPU limit is set to 1 core, i.e. a maximum of 100ms CPU time is used in every 100ms, thread B of the API service is limited once (grey part) and the service responds after 140ms with.
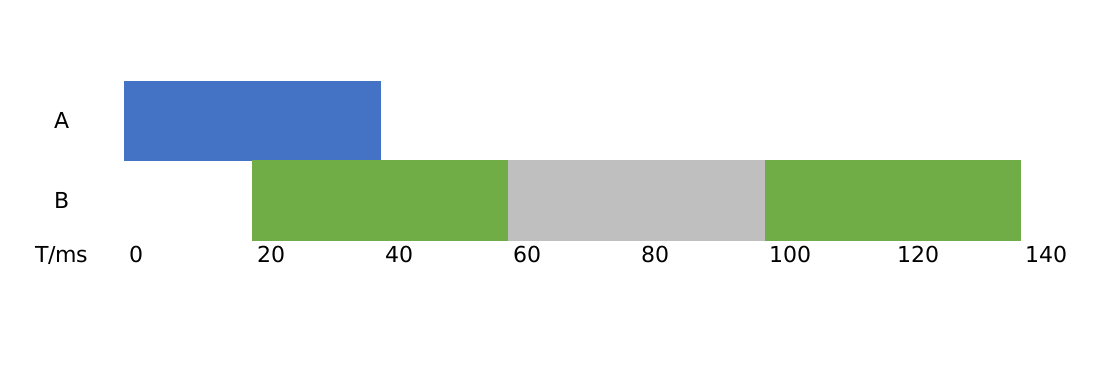
If the CPU limit is set to 0.6 cores, i.e. a maximum of 60ms CPU time is used in every 100ms, thread A of the API service is limited once (grey part), thread B is limited twice and the service responds after 220ms with.

Note that flow limiting will execute just the same even if the CPU has no other work to do at that moment , which is a rigid and unaccommodating mechanism.
This is a rather exaggerated example, the average API service is IO intensive and CPU time usage is not that high (you’re running model inference?). Forget I said it), but still, you can see that limiting the flow will realistically extend the latency of the API service. Therefore, for latency-sensitive services, we should all try to avoid triggering k8s’ flow limiting mechanism.
The graph below shows the CPU usage and CPU Throttling ratio of an API service at the pod level in my work. We see that CPU Throttling exists most of the day, with the Throttling ratio fluctuating around 10%, which means that the service’s work is not done at full speed, and is discounted by 10% in terms of speed. It is worth mentioning that the node where the pod is located still has spare CPU resources at this time, and the overall CPU usage of the node does not exceed 50%.
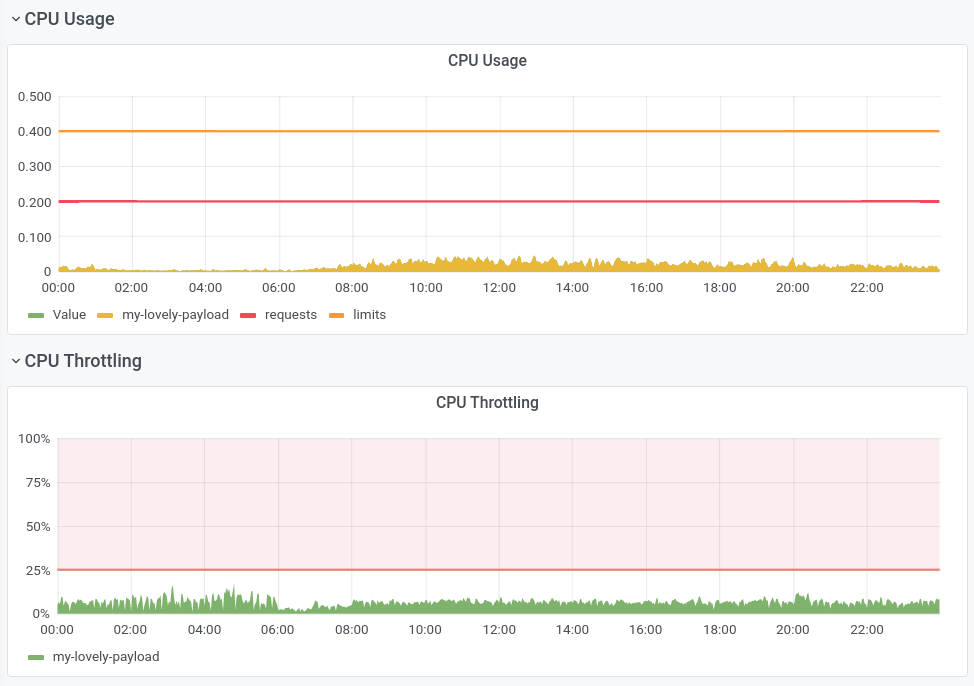
You may notice that the CPU usage in the monitor chart looks like it is not reaching the CPU limit (orange horizontal line), this is due to the long statistic period (1min) of CPU usage Signal Aliasing, if its statistic statistic period is the same as the CFS one (100ms), we would see spikes higher than the CPU limit. (This is not a bug, this is FEATURE)
However, Linux with kernel versions below 4.18 really has a bug that causes unnecessary CPU limit.
Avoid CPU limit
Some developers tend to abandon CPU limits altogether and run naked and straight, especially when the kernel version is not buggy enough.
I think doing so is still too much of a let-down, and if there are bugs in the program that run out of CPU (such as dead loops, which I have unfortunately encountered), the entire node and its load can fall into an unavailable state with too large an explosion radius, especially on larger nodes (16 cores and above).
I have two suggestions.
- monitor the CPU utilization of the application over time and set a suitable CPU limit based on the utilization (e.g., 95th percentile of daily utilization * 10), while the limit should not take up too large a proportion of the node’s CPU cores (e.g., 2/3), so that a balance between performance and security can be achieved.
- Use a tool like automaxprocs to adapt the program to the CFS scheduling environment. Each language should have similar libraries or execution parameters, and after adjusting them to the characteristics of CFS, the program is less likely to encounter CPU limiting.