For a production environment and an aspiring ops person, even millisecond level downtime is not tolerated. Proper logging and monitoring of infrastructure and applications is very helpful in solving problems, and can also help optimize costs and resources, as well as help detect some problems that may occur later. In this article we will use the more lightweight Grafana Loki to implement log monitoring and alerting. The key thing is that if you are familiar with using Prometheus, you will have no problem using Loki, as they are basically the same, and have the same Label tag if they are auto-discovered in a Kubernetes cluster.
Components
Before using Grafana Loki, let’s briefly introduce the three main components it contains.
Promtail
Promtail is a log collection tool used to send container logs to Loki or Grafana services. The tool mainly consists of discovering collection targets and adding Label tags to log streams and then sending them to Loki.
Loki
Loki is a Prometheus-inspired log aggregation system that is horizontally scalable, highly available, and multi-tenant capable, using the same service discovery mechanism as Prometheus, adding labels to log streams instead of building full-text indexes. Because of this, the logs received from Promtail have the same set of tags as the application’s metrics. So, not only does it provide better context switching between logs and metrics, it also avoids full-text indexing of logs.
Grafana
Grafana is an open source platform for monitoring and visualizing observations, supporting a very rich set of data sources, and in the Loki technology stack it is dedicated to presenting time series data from data sources such as Prometheus and Loki. In addition, it allows us to query, visualize, and alert, and can be used to create, explore, and share data Dashboards that encourage a data-driven culture.
Deployment
To facilitate the deployment of the Loki technology stack, we use the more convenient Helm Chart package for installation here, modifying the values to suit your needs.
First we install the Prometheus-Operator, which contains Promtail, Prometheus, AlertManager, and Grafana, and then we install the Loki components separately.
First create a file called loki-stack-values.yaml to override the Values values of Loki deployment, the contents of the file are as follows.
|
|
Here we have enabled ServiceMonitor for Promtail and added two tags. Loki then transforms the log line, changing its label and modifying the format of the timestamp. Here we add a match phase that will match log stream data with app=nginx, and then the next phase is to filter out log lines that contain GET keywords using regular expressions.
In the metrics metrics phase, we define a nginx_hits metric, and Promtail exposes this custom metrics data through its /metrics endpoint. Here we define a Counter type metric that is incremented when filtered from the regex phase. In order to view this metric in Prometheus, we need to grab this metric from Promtail.
Install Loki using the command shown below.
Then install the Prometheus Operator, again creating a file called prom-oper-values.yaml to override the default Values values, as follows.
|
|
Here we configure Loki as a data source for Grafana, and then configure alarm rules called nginx_hits that are executed sequentially at certain intervals within the same group. The threshold for triggering alarms is configured via the expr expression. Here, we indicate whether the sum of the additions within 1 minute is greater than 2. When the condition in the expor expression lasts for 2 minutes, the alarm will actually be triggered, and the alarm will remain in the Pending state until it is actually triggered.
Finally, we configure Alertmanager to send notifications via WebHook, and Alertmanager routes incoming alerts based on a tree structure. We can group alerts according to alertname, job, cluster, etc. When the alerts match, notifications are sent on the preset receivers.
The installation command is shown below.
|
|
Next, we can install a test Nginx application with the following list of resources: (nginx-deploy.yaml)
|
|
For testing purposes, we use a NodePort-type service here to expose the application, which can be installed directly at
|
|
The Pod list of all applications after installation is completed is shown below.
|
|
For testing purposes, we can change the Service corresponding to the Grafana installation of the Prometheus Operator to the NodePort type, and then use the default admin username and password prom-operator to log in to Grafana.
Testing
Let’s simulate triggering an alarm by using the shell command shown below to simulate accessing the Nginx application every 10s.
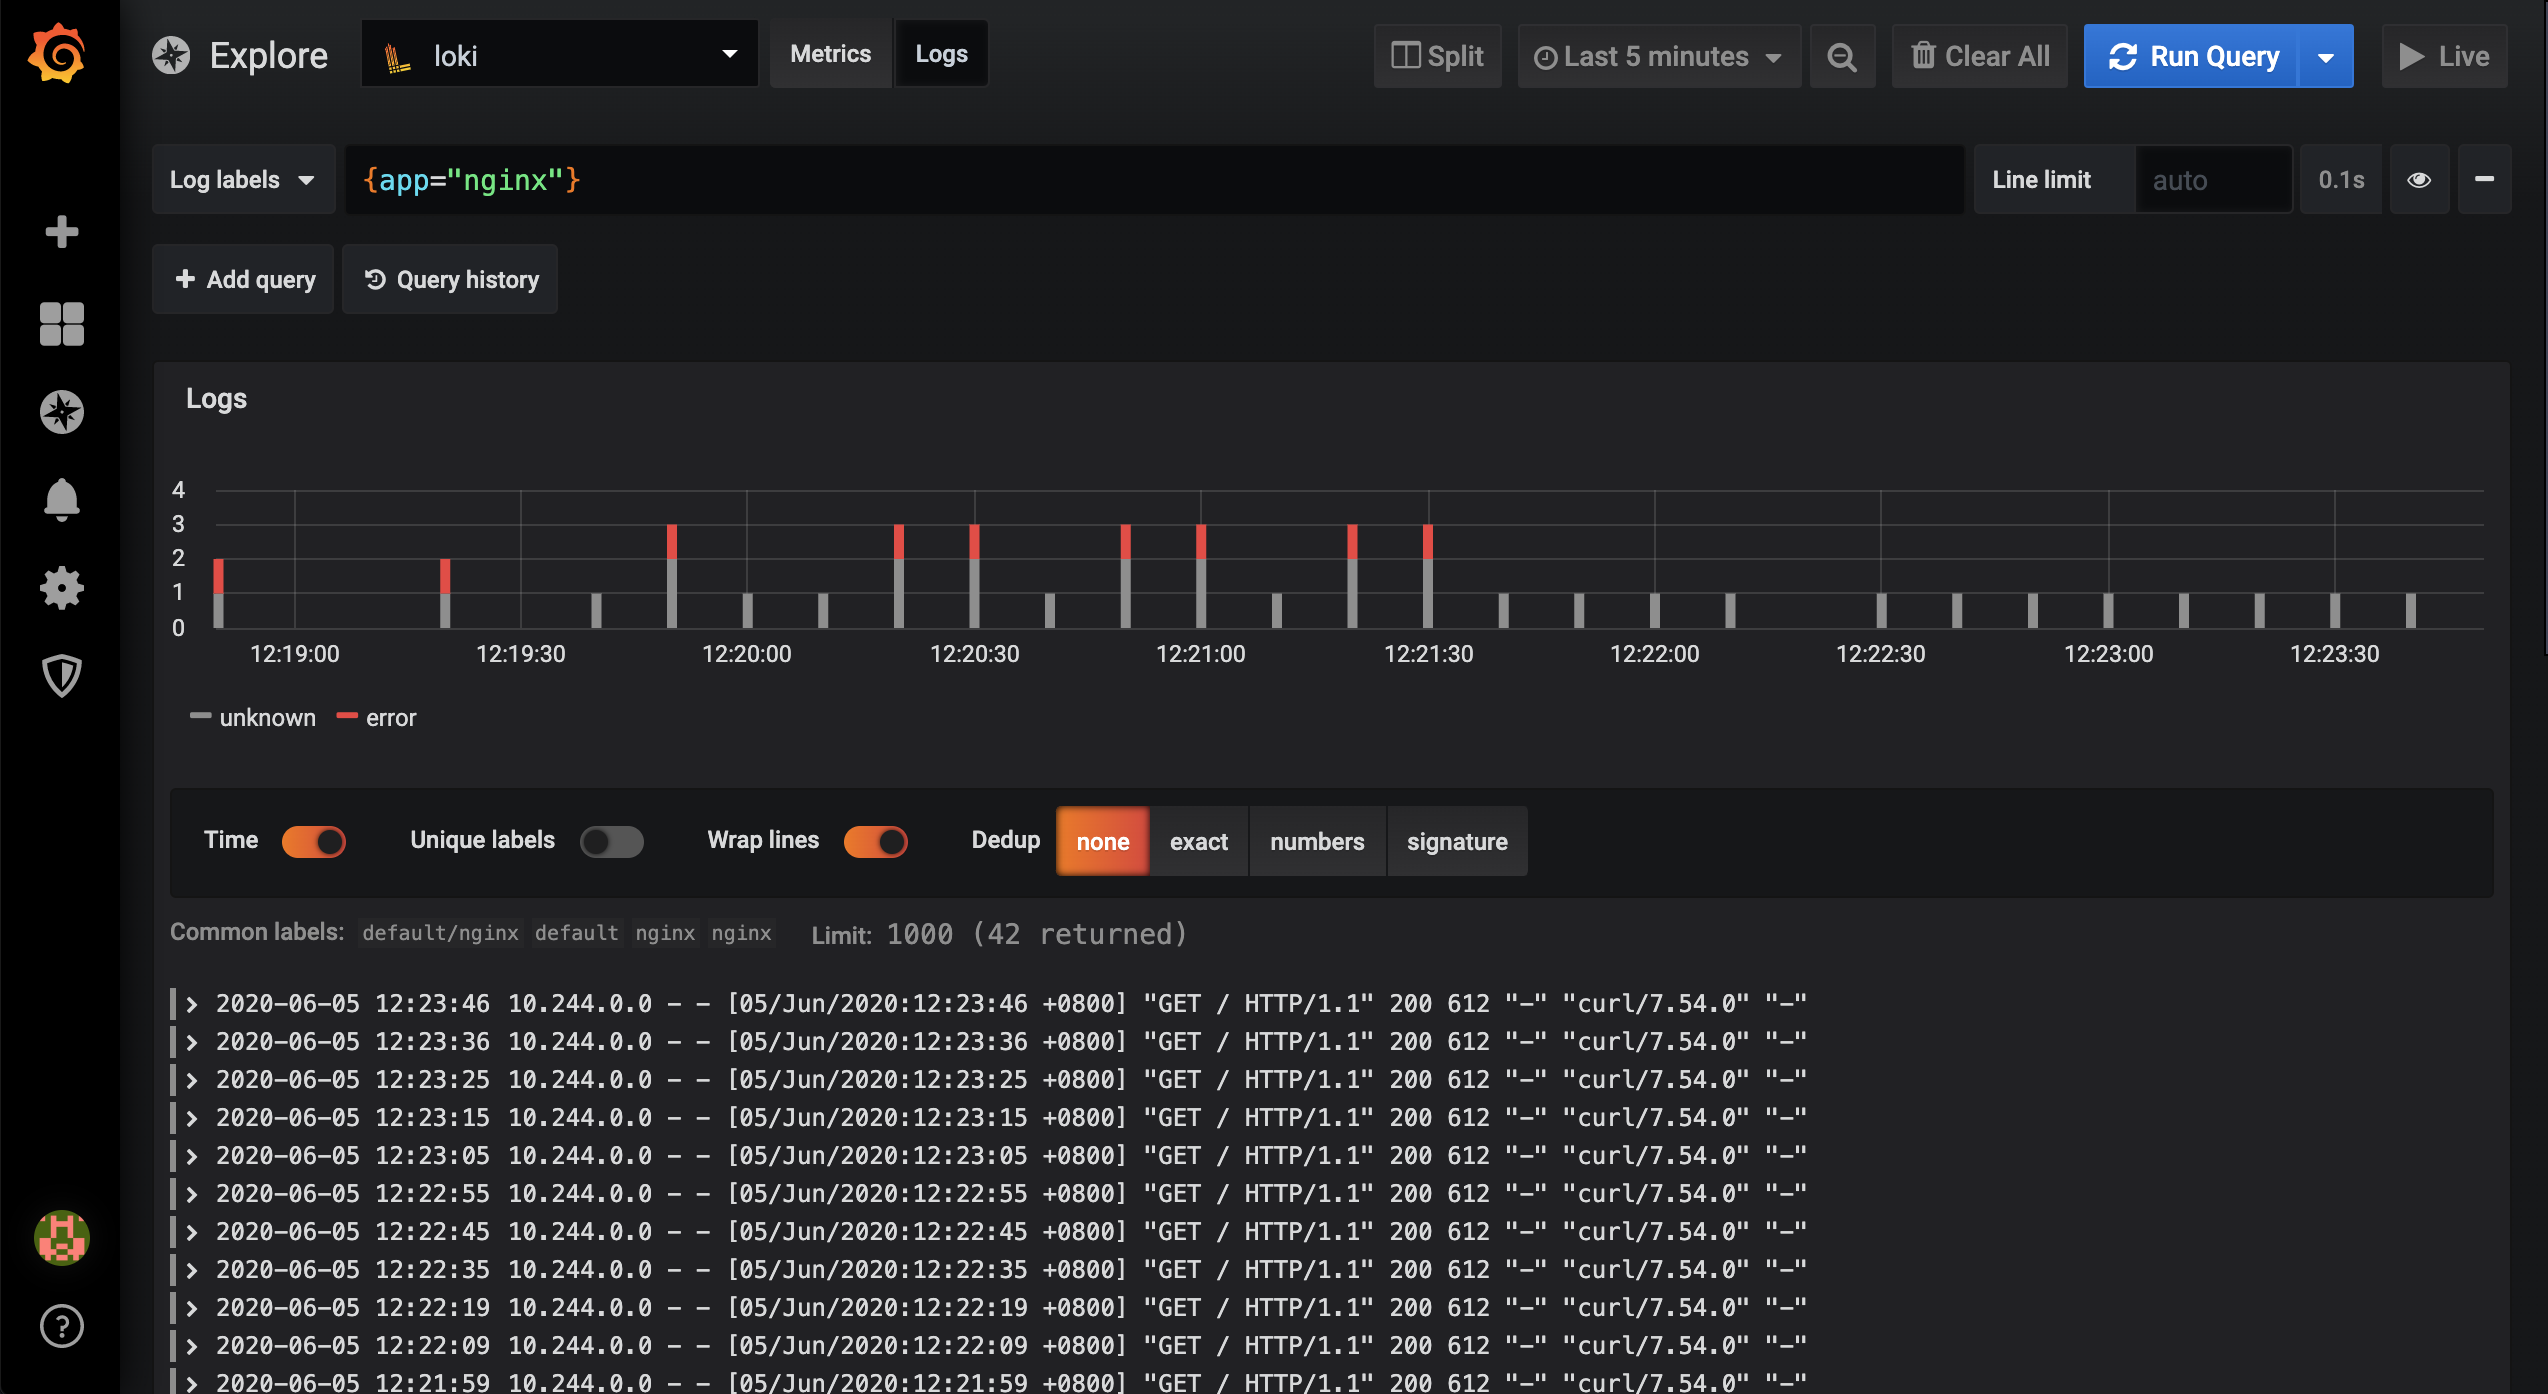
At this point we go to the Grafana page and filter the logs of the Nginx application to see.
Also at this time, the nginx-hints alert rule we configured is triggered:
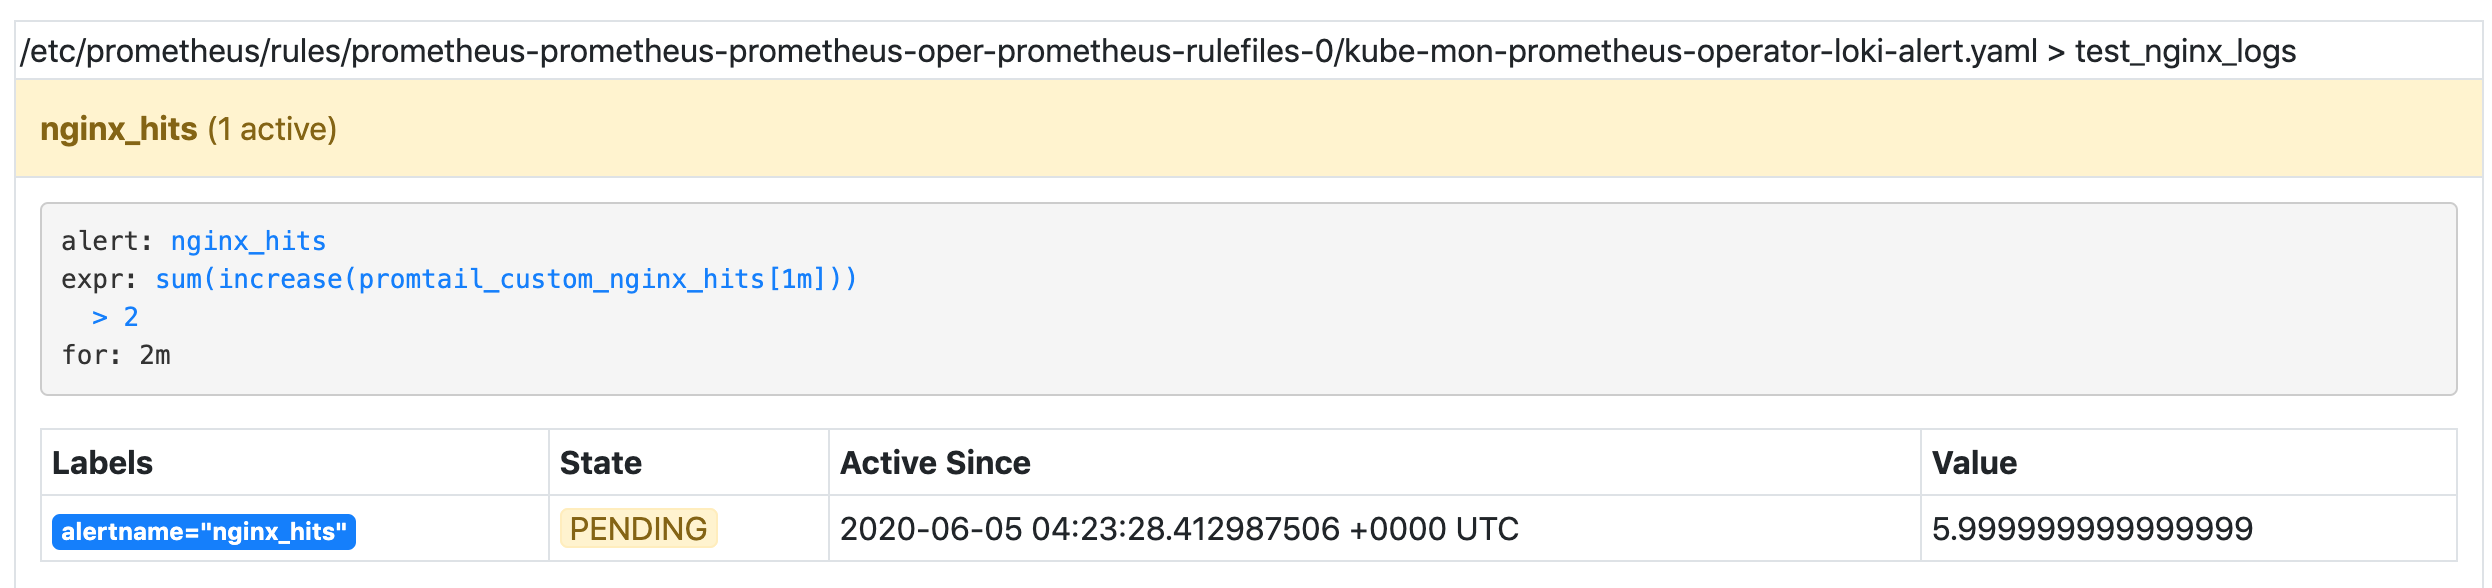
If the alarm threshold is consistently reached within two minutes, the alarm will be triggered.
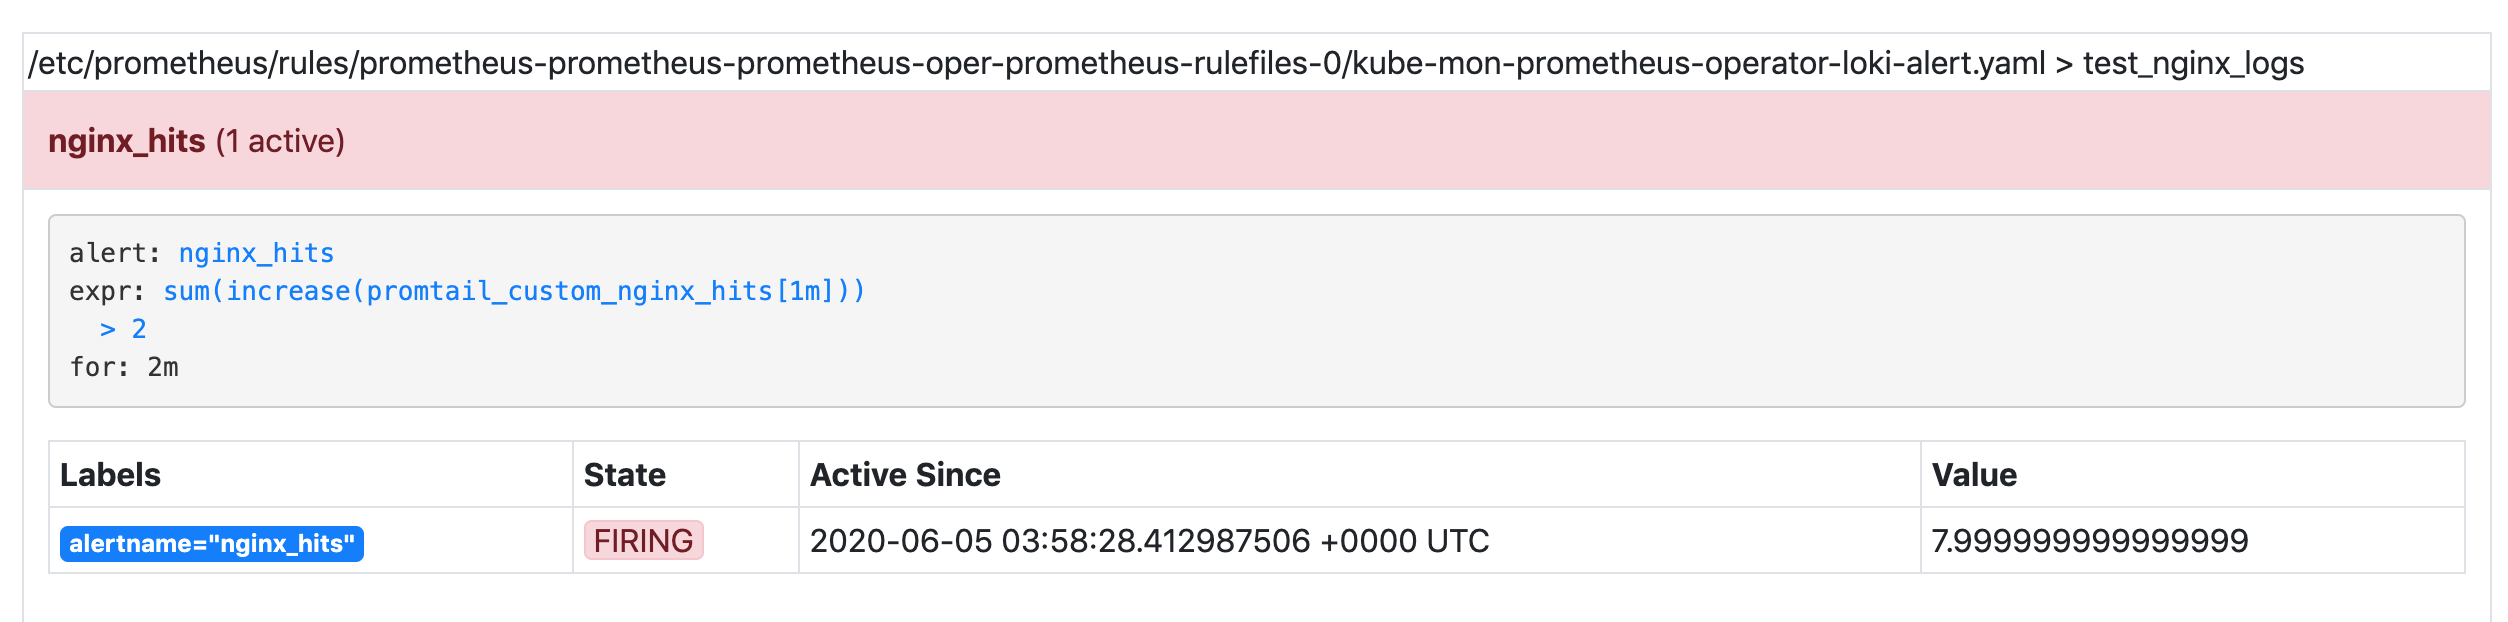
Normally, we can also receive the corresponding alerts in our WebHook at this time.
This is the end of our log collection, monitoring and alerting operation for our application using PLG technology stack.