The software world is evolving faster than ever, and the need to stay competitive requires new software releases as quickly as possible, without impacting users online. Many enterprises have migrated their workloads to Kubernetes clusters, which inherently take into account some production environment practices, but there are some additional things we need to do to make Kubernetes truly zero downtime without disruption or lost requests.
Rolling Updates
By default, Kubernetes Deployment has a rolling update policy for Pod updates, which ensures that some instances are still running when the application is updated at any point in time to prevent the application from going down, and only kills the old Pod when the newly deployed Pod is up and ready to handle traffic.
We can also specify how Kubernetes handles multiple replicas during an update. For example, if we have a 3-replica application, should we immediately create all 3 new Pods and wait for them to start, or kill all but one of the old Pods during the update, or should we replace them one by one? The following example is a Deployment definition using the default rolling update upgrade policy, where there can be at most one container with more than the number of replicas (maxSurge) and no unavailable containers during the update process.
|
|
The zero-downtime application above uses the nginx image to create three copies of the Deployment to perform rolling updates: first create a new version of the Pod, wait for the Pod to start and be ready, then delete an old Pod, then move on to the next new Pod until all copies have been replaced. To let Kubernetes know when our Pod is ready to handle traffic requests, we also need to configure the liveness and readiness probes. The following is the output of the old and new Pod replacements.
|
|
Availability Detection
If we do a rolling update from an old version to a new version and simply use the output to determine which Pods are alive and ready, then the rolling update behavior must seem valid, but often the reality is that the switch from an old version to a new version is not always smooth and the application is likely to drop some client requests.
In order to test whether requests are being dropped, especially for instances that are about to exit the service, we can use some load testing tools to connect our application for testing. We need to focus on whether all HTTP requests, including keep-alive HTTP connections, are being handled correctly, so we can use [Apache Bench (AB Test)](http://httpd.apache.org/docs/current/programs/ab. html) or Fortio (Istio Test Tool) to test.
We use multiple threads to connect to a running application in a concurrent manner, and we care about the status of responses and failed connections, not information like latency or throughput. We use Fortio as a test tool here, for example, 500 requests per second and 8 concurrent keep-alive connections with the following test command (using the domain zero.qikqiak.com to proxy to the 3 Pods above).
|
|
The official documentation on the use of fortio can be found at: https://github.com/fortio/fortio
Using the -a parameter we can save the test report as a web page so that we can view the test report directly in the browser. If we start the test while we are doing a rolling update of the application, we may see some requests that cannot be connected to.
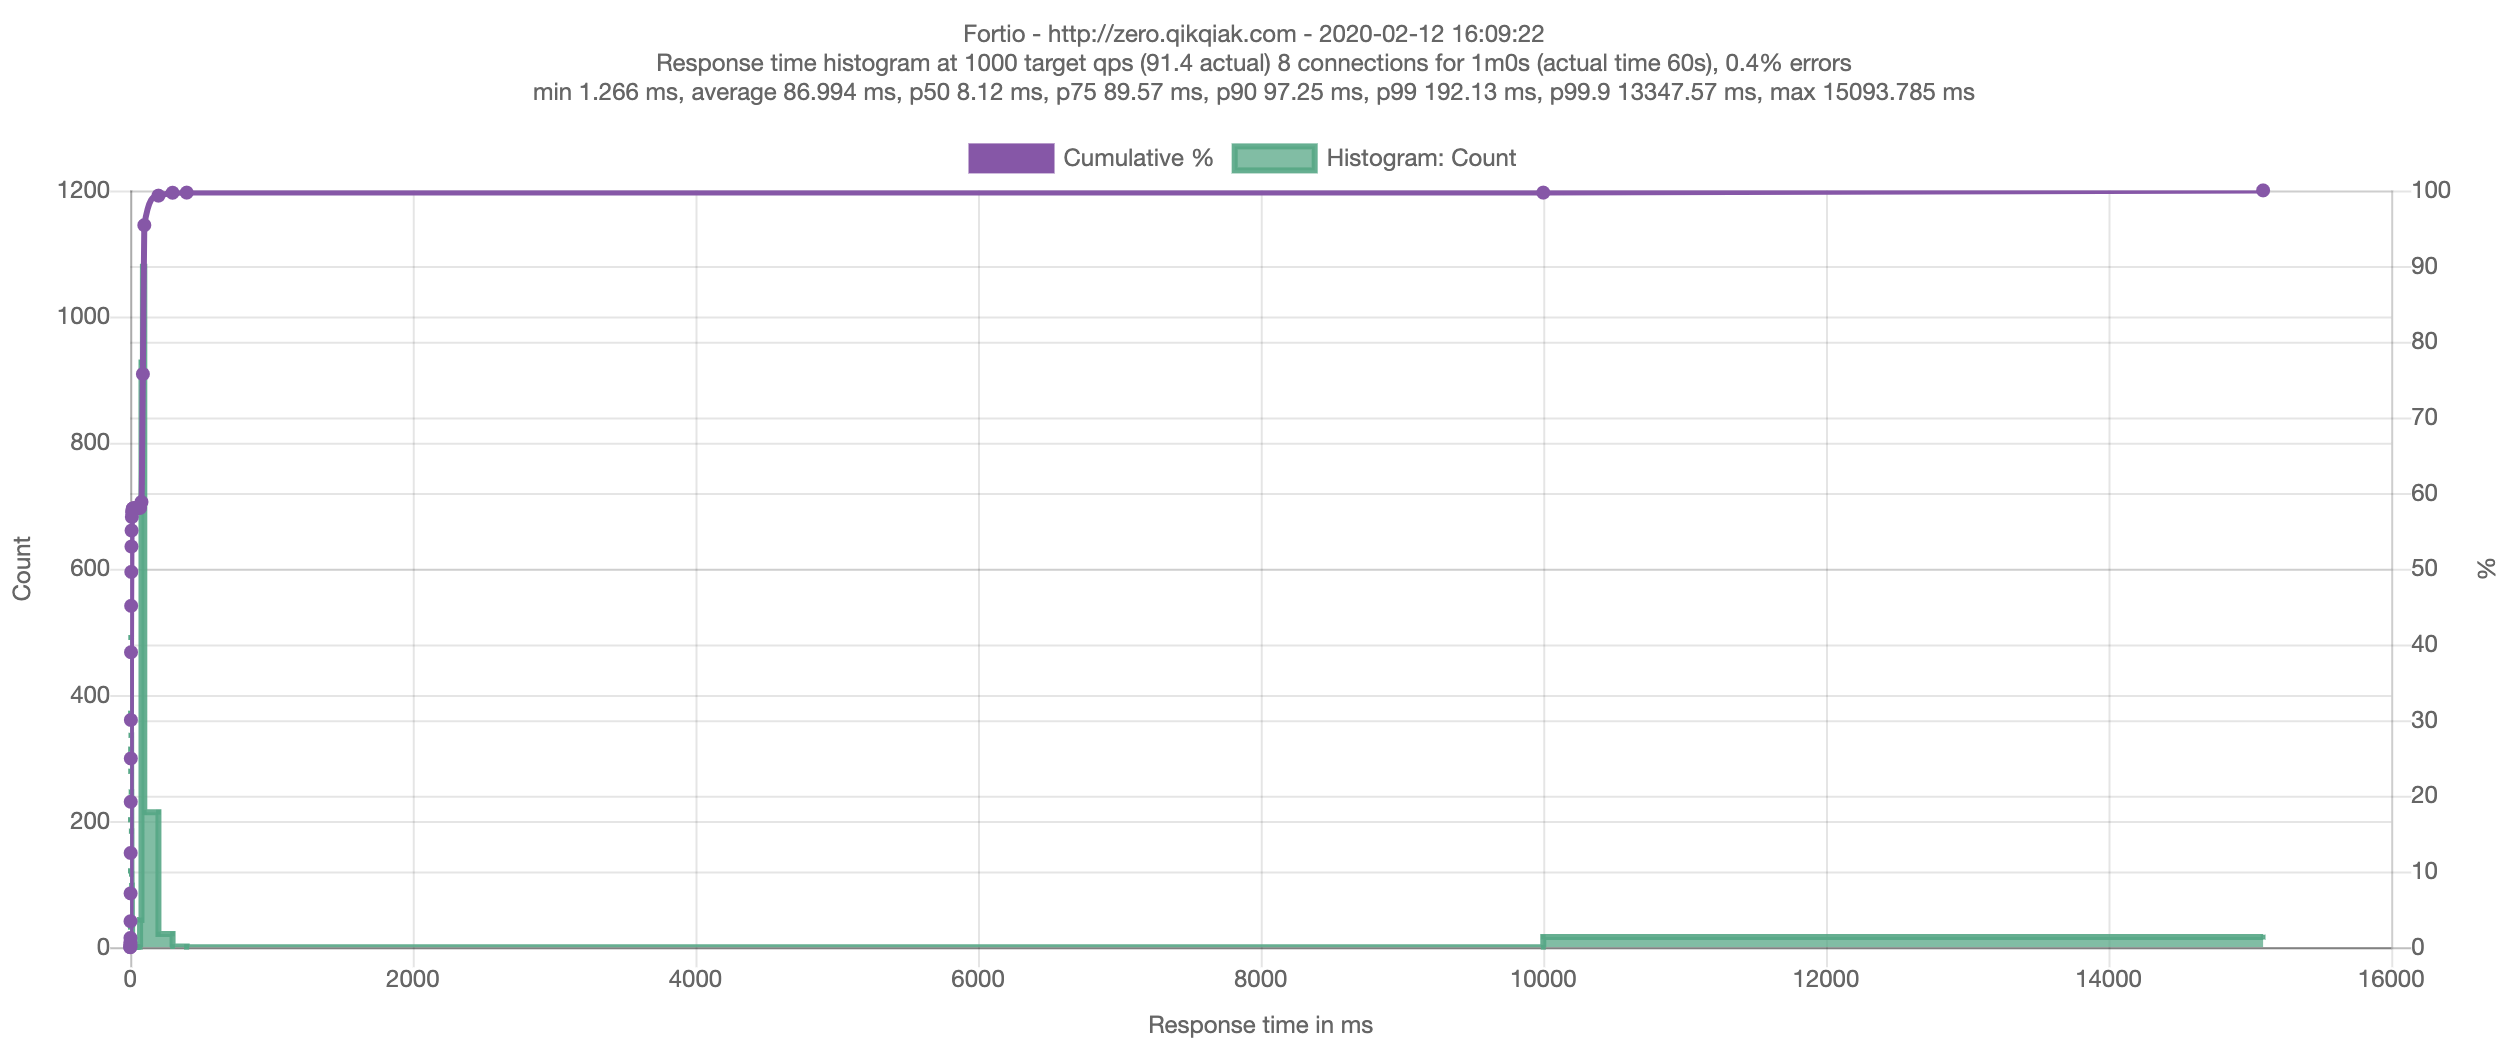
|
|
As you can see from the output above that some requests failed to be processed (502), we can run several test scenarios where we connect to the application in different ways, such as through Kubernetes Ingress or directly from inside the cluster through the Service. We will see that the behavior during rolling updates may vary, depending on the configuration parameters of the test, and that clients connecting to the service from inside the cluster may not encounter as many failed connections compared to connections via Ingress.
Cause Analysis
The problem now is figuring out exactly what happens when an application reroutes traffic from an old Pod instance to a new one during a rolling update, so let’s start by looking at how Kubernetes manages workload connections.
If the client performing the test connects to the zero-downtime service directly from inside the cluster, it will first resolve to the Service’s ClusterIP through the cluster’s DNS service and then forward to the Pod instance behind the Service, which is achieved by kube-proxy on top of each node by updating the iptables rules.
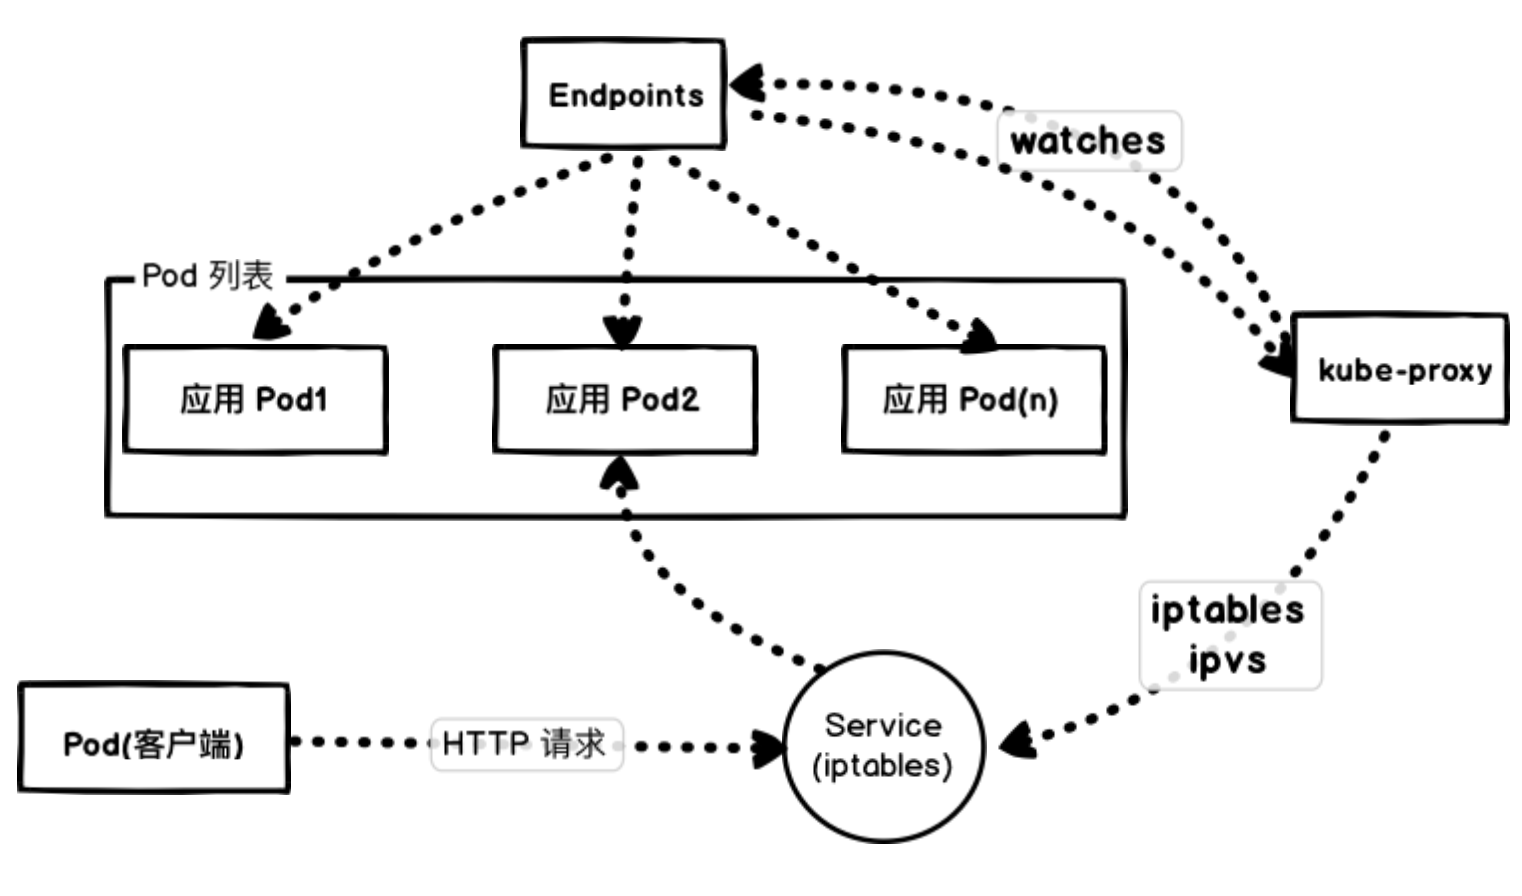
Kubernetes updates the Endpoints object based on the status of the Pods, which ensures that the Endpoints contain Pods that are ready to handle requests.
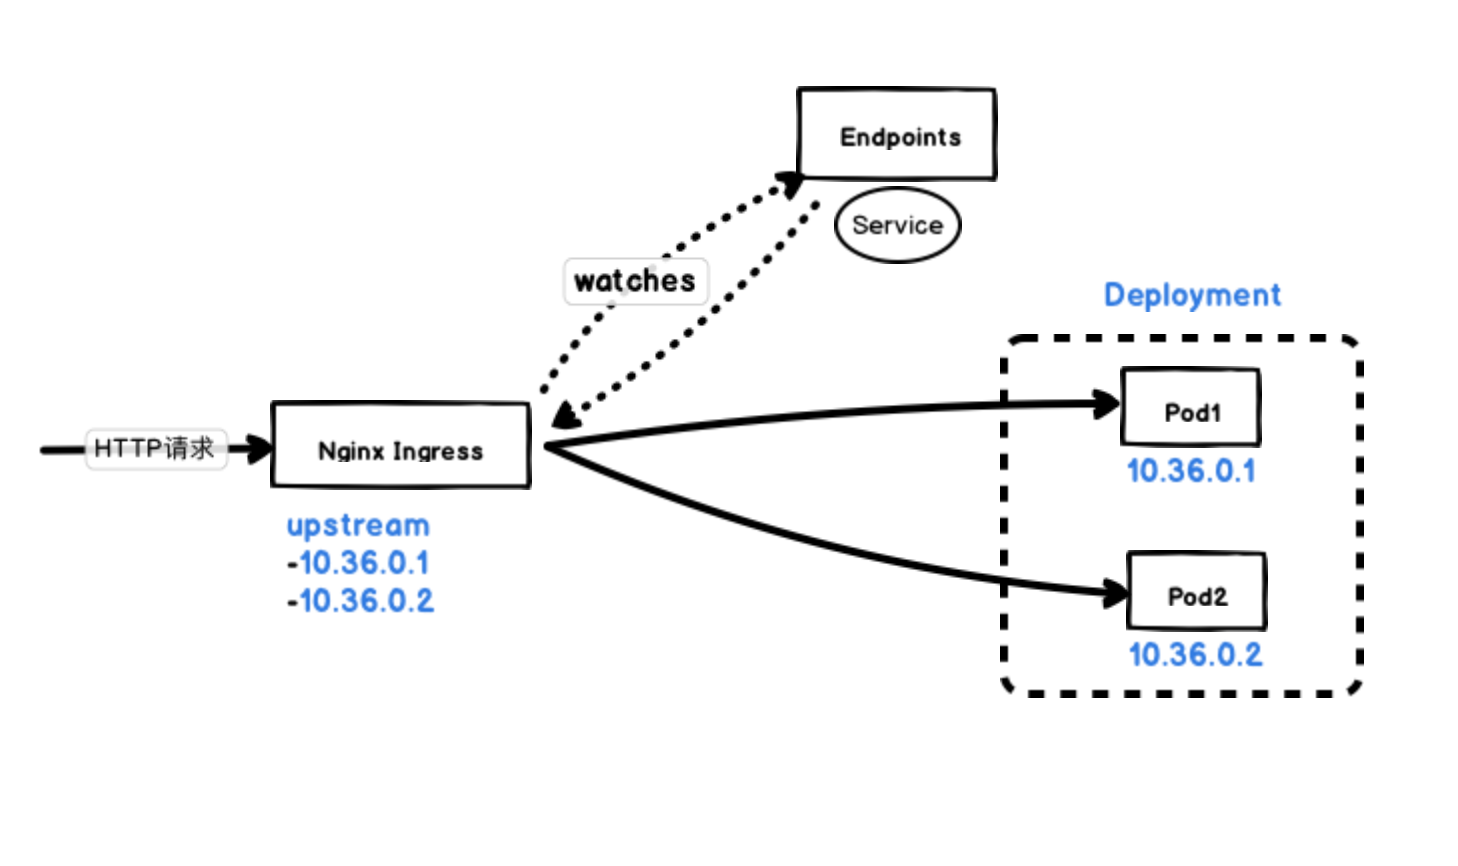
But Kubernetes Ingress connects to instances in a slightly different way, which is why we see different downtime behavior during rolling updates when clients connect to applications via Ingresss.
Most Ingress Controllers, such as nginx-ingress and traefik, get the address of the Pod directly by watching the Endpoints object directly, without having to do a layer of forwarding through iptables.
Regardless of how we connect to the application, the goal of Kubernetes is to minimize service interruptions during rolling updates. Once a new Pod is active and ready to go, Kubernetes will stop the incoming Pod, update the Pod’s state to "Terminating", then remove it from the Endpoints object and send a SIGTERM signal to the to the Pod’s master process. The SIGTERM signal then causes the container to shut down in the normal way and does not accept any new connections.After the Pod is removed from the Endpoints object, the front load balancer routes the traffic to other (new) Pods. This is also the main reason for the availability gap of our application, because the termination signal goes to deactivate the Pod before the responsible balancer notices the change and updates its configuration, and this reconfiguration process happens asynchronously, so it is not guaranteed to be in the right order, so it can lead to few requests being routed to the terminated Pod.
Zero Downtime
So how can we enhance our application to achieve a true zero-downtime migration?
First, a prerequisite to achieve this goal is that our containers handle termination signals correctly and achieve graceful shutdown on the SIGTERM signal. The next step is to add a readiness probe to check if our application is ready to handle the traffic.
The readiness probe is just the starting point for our smooth rolling updates. To solve the problem of not blocking when the Pod stops and waiting for the load balancer to reconfigure, we need to use the preStop lifecycle hook, which is called before the container terminates.
The lifecycle hook function is synchronous, so it must be done before sending the final termination signal to the container. In our example, we use this hook to simply wait and then the SIGTERM signal will stop the application process. At the same time, Kubernetes will remove the Pod from the Endpoints object, so the Pod will be excluded from our load balancer, and basically our lifecycle hook function waits long enough to ensure that the load balancer is reconfigured before the application stops.
Here we add a preStop hook to the zero-downtime Deployment.
|
|
We use preStop to set a grace period of 20s, the Pod will sleep for 20s before it is really destroyed, which is equivalent to leaving time for the Endpoints controller and kube-proxy to update the Endpoints object and forwarding rules. Although the Pod is in Terminating state during this time, even if a request is forwarded to this Terminating Pod before the forwarding rules are fully updated, it can still be processed normally because it is still in sleep and not really destroyed.
Now, when we look at the Pod behavior during the rolling update, we will see that the terminating Pod is in the Terminating state, but it will not shut down until the waiting time is over, and if we retest with Fortio, we will see the ideal behavior with zero failed requests.
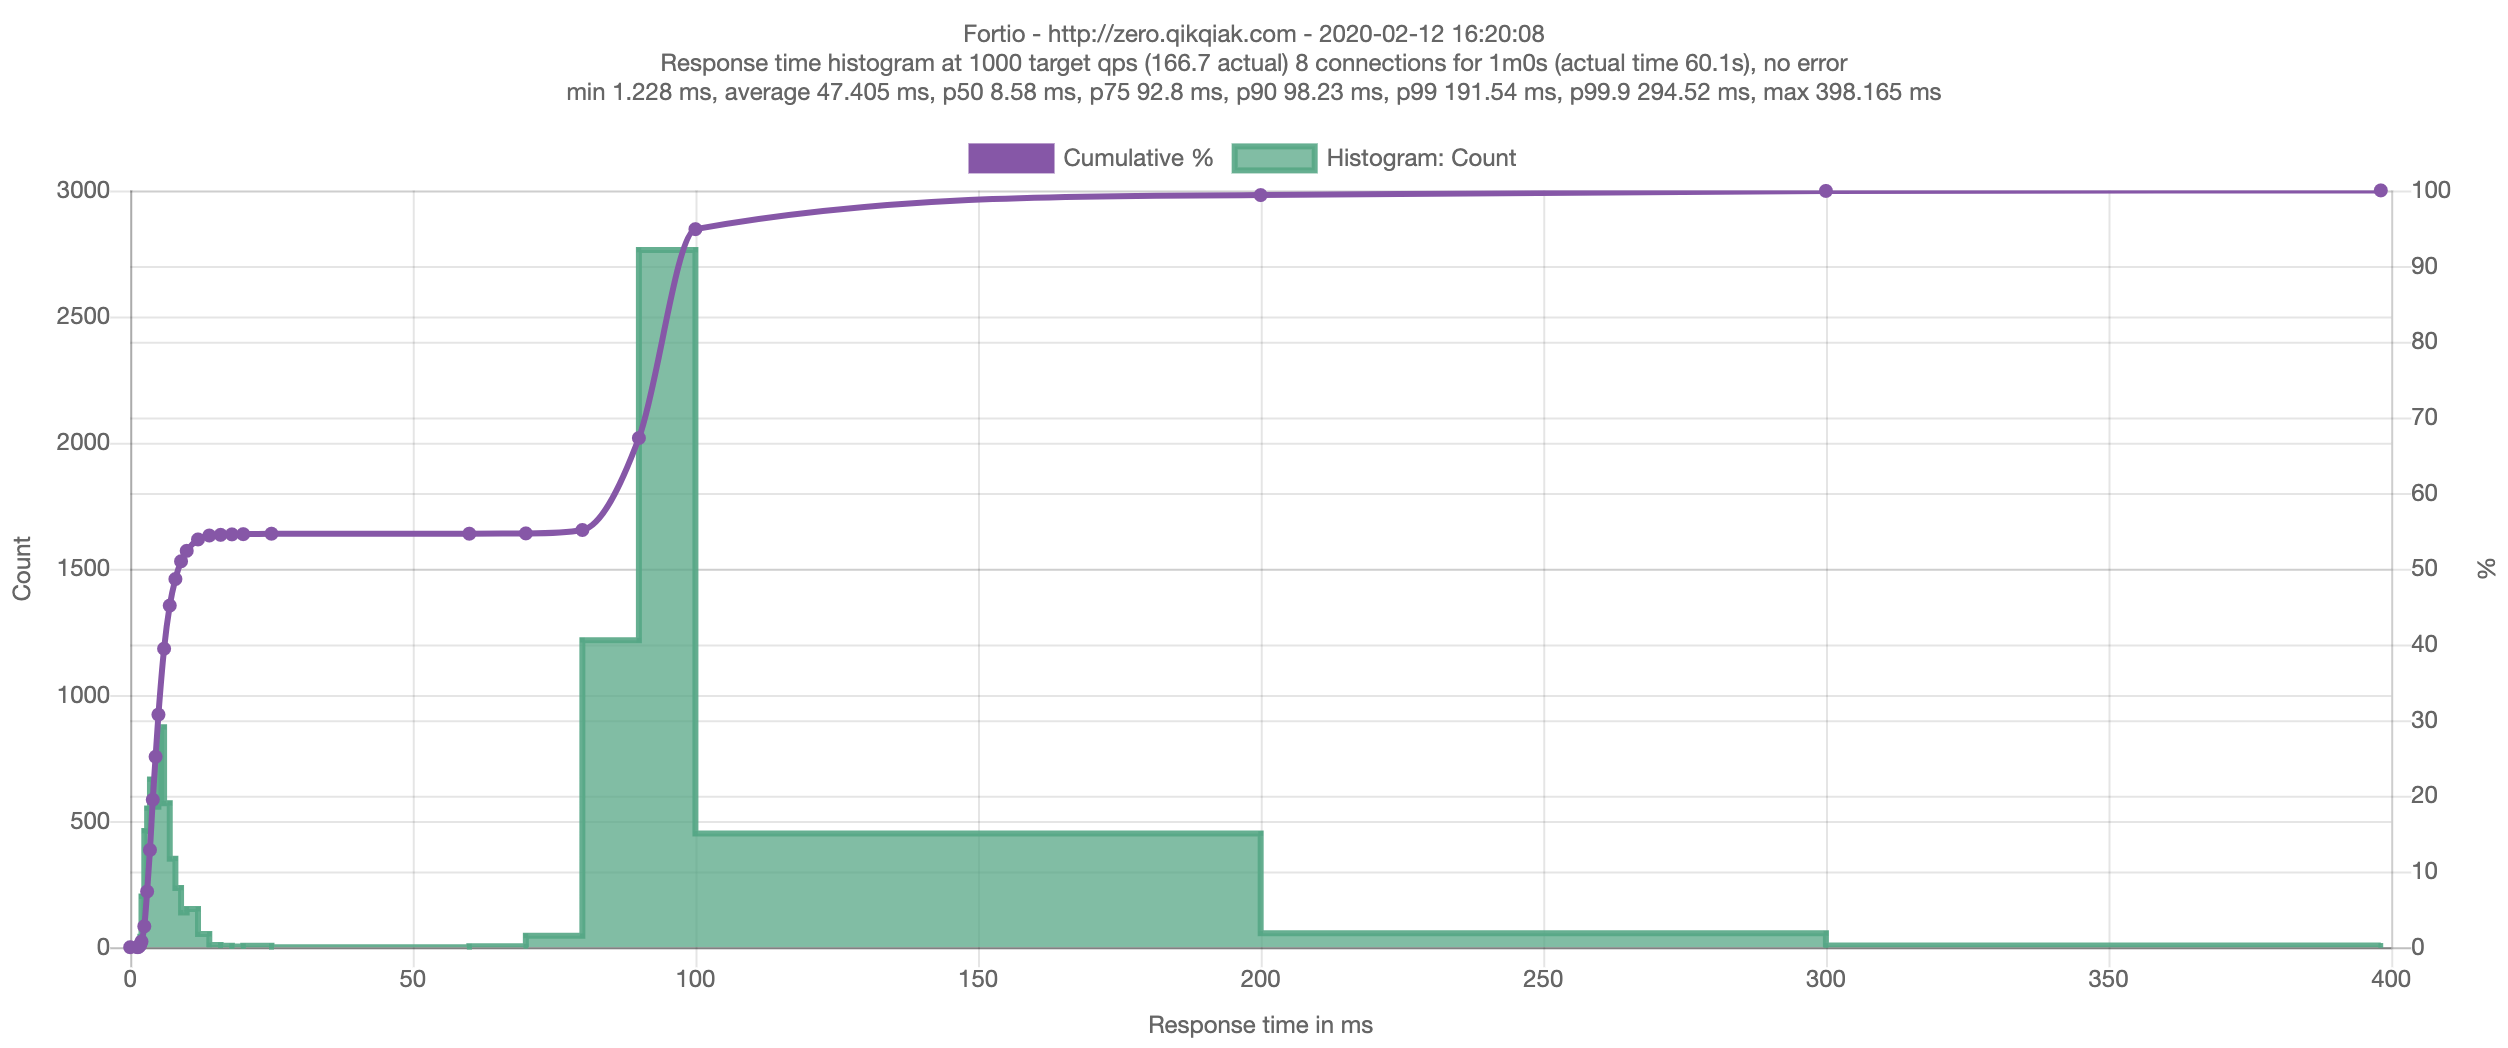
|
|
Summary
Kubernetes has done a good job of taking production readiness into account, but in order to run our enterprise applications in a production environment, we need to understand how Kubernetes runs in the background and how our applications behave during startup and shutdown. Some teams are converting long connections to short connections for processing, but I’m still doing support at the application level, such as adding a retry mechanism on the client side to automatically reconnect when the connection is disconnected. If you have a better solution can also leave a message to discuss the program with each other.