Uber recently posted an article that focuses on dynamically tuning GOGC on core services to reduce the mark phase CPU usage of GC. Basically, it is effective, low-risk, scalable and semi-automated.
Uber’s current service scale is about a few thousand microservices, based on the scheduling infrastructure on the cloud for deployment. Most of the services are written by GO, and the author of this article is doing Maps Production Engineering, a group that has helped some Java systems to adjust GC parameters before (this should be the starting point for them to help Go to do optimization and think about how to adjust parameters).
Anyway, after a period of online profile collection, we found that GC is a big CPU consumption point for many core services, for example, the runtime.scanobject method consumes a large percentage of computing resources.
Service #1
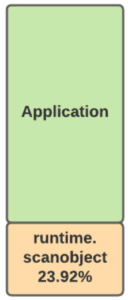
Figure 1: GC CPU cost of Example Service #1
Service #2
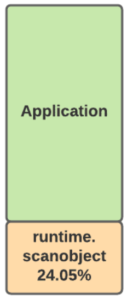
Figure 2: GC CPU cost of Example Service #1
With this finding, the team started to figure out if they could come up with some solutions to optimize it. Here are some details.
GOGC Tuner
Go’s runtime intermittently calls the garbage collector to concurrently perform garbage collection. This start is determined by memory pressure feedback to determine when to start a GC. So the Go service can reduce the frequency of GC by increasing the amount of memory to reduce the total CPU usage of GC. Most of the instances of Uber’s internal services are rationed to 1C5G, while the actual Go service CPU:memory ratio is about 1:1 or 1:2, i.e. 1G or 2G of memory while occupying 1C of CPU. So there is really room for parameter tuning here.
Go’s GC trigger algorithm can be simplified to the following formula.
|
|
The pacer algorithm is used to calculate the most appropriate heap memory footprint for each trigger.
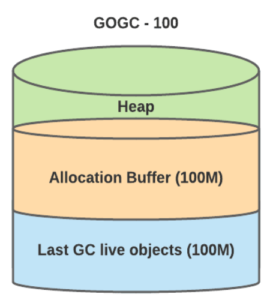
Figure 3: Example heap with default configuration.
Dynamic and diverse services: there’s no one-size-fits-all solution
A fixed GOGC value cannot accommodate all of Uber’s internal services. Specific challenges include.
- The maximum memory available in the container is not considered, and there is a theoretical possibility of OOM.
- Different microservices use memory in completely different ways. For example, some systems use only 100MB of memory, while a service with a 99th percentile memory footprint uses 1G of memory, and the 100MB service has a very high CPU usage for GC.
Automation
Uber has an internal library called GOGCTuner. This library simplifies Go’s GOGC parameter tuning process and reliably automates its tuning.
The tool dynamically adjusts GOGC parameters based on the container’s memory limit (which can also be specified by the application owner) using Go’s runtime API:
- The default GOGC parameter is 100%, a value that is not clear to GO developers and is inherently dependent on active heap memory, GOGCTuner limits applications to 70% of memory usage. GOGCTuner will limit the application to 70% of memory usage. and can strictly limit the memory usage.
- This protects the application from OOM: the library reads the application memory limit under the cgroup and forces it to use only 70% of the memory, which is safer in our experience.
- This protection is, of course, limited. The tuner is only adaptive to buffer allocation, so if you have more active objects on the heap than the tuner utility limits, the utility will set it to your active object size * 1.25.
- In some special cases, a higher value of GOGC is allowed, such as.
- We mentioned that the default GOGC is not explicit. Despite our adaptive approach, we still depend on the size of the currently active object. What happens if the current active object size is more than twice our previous maximum, GOGCTuner will limit the total memory, making the application consume more CPU. If we manually set GOGC to a fixed value, an OOM may occur directly here, but generally the application owner will provide additional buffer volume for this scenario, see later for some examples.
Normal traffic (live dataset is 150M)
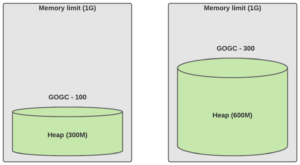
Figure 4: The default value is used on the left, and the GOGC is manually adjusted to a fixed value on the right
Traffic increased 2X (live dataset is 300M)
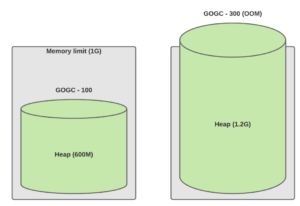
Figure 5: Load doubling. The left is the default value, and the right is the fixed value adjusted manually
Traffic increased 2X with GOGCTuner at 70% (live dataset is 300M)
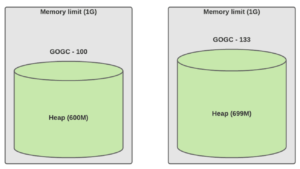
Figure 6: Load doubling. The left is the default value, the right is the value dynamically adjusted with GOGCTuner.
- Using MADV_FREE memory policy will lead to wrong memory metrics. So if you are using Go 1.12-Go 1.15, be careful to set the environment variable for madvdontneed.
Observability
To improve observability, we also monitor some key metrics of garbage collection.
-
Time interval between garbage collection triggers: You can tell if further optimizations are needed. For example, Go forces garbage collection to be triggered every two minutes. If your service is still having GC issues, but all the values you see on this graph are 120s, then you can’t optimize it by tuning GOGC. In this case you should start with the application to optimize these object allocations.
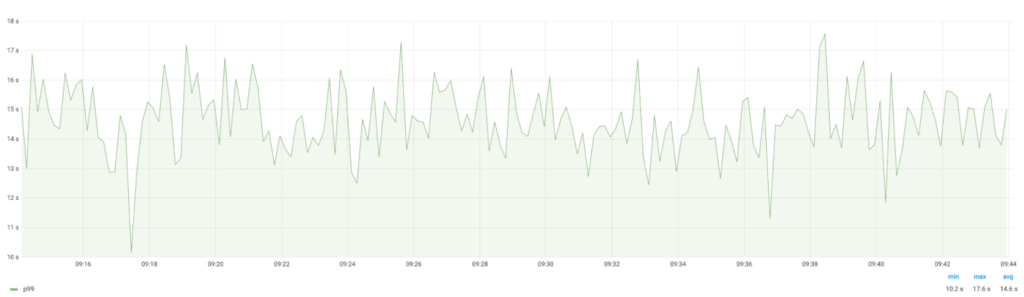
Figure 7: Graph for intervals between GCs.
-
GC CPU usage : allows us to know which services are most affected by GC.
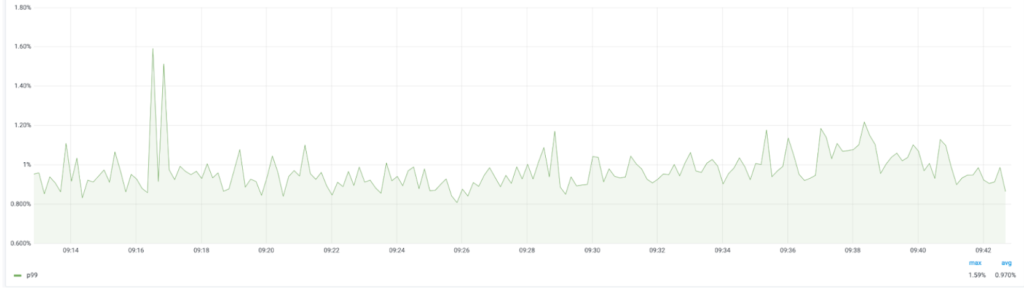
Figure 8: Graph for p99 GC CPU cost.
-
Active object size : helps us to diagnose memory leaks. Before using GOGCTuner, application owners used to determine if a memory leak occurred by the total memory usage, now we need to monitor the active object memory usage to help them make this determination.
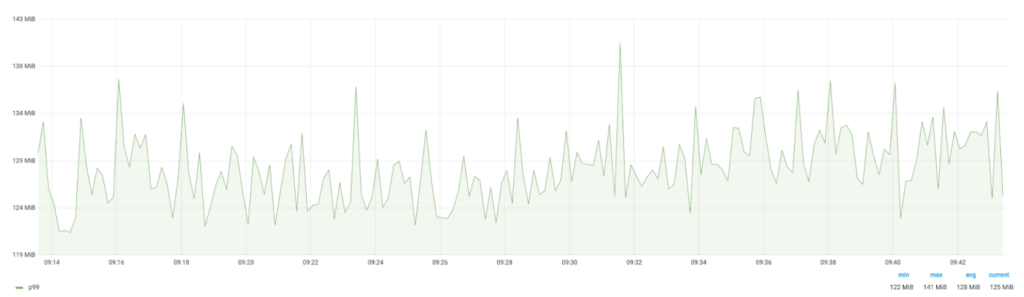
Figure 9: Graph for estimated p99 live dataset.
-
Dynamic value of GOGC : It is possible to know if the tuner is working or not.
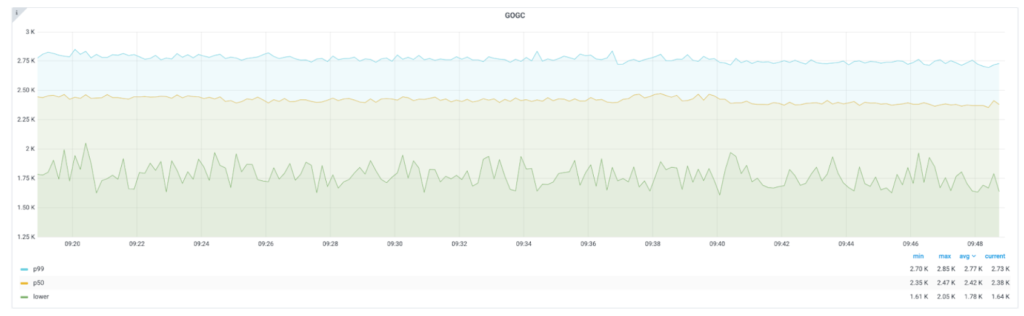
Figure 10: Graph for min, p50, p99 GOGC value assigned to the application by the tuner.
Implementation
The original implementation ran a ticker every second to monitor the heap metrics and then adjusted the GOGC value by the metrics. The downside of this approach is obvious, as reading Memstats requires STW and the value is not precise, as it can trigger multiple GCs per second.
There is a better way, Go has a finalizer mechanism that triggers a user callback method when an object is GC’d. Uber implements a self-referencing finalizer that can be reset on every GC, which also reduces the CPU consumption of this memory detection. For example.
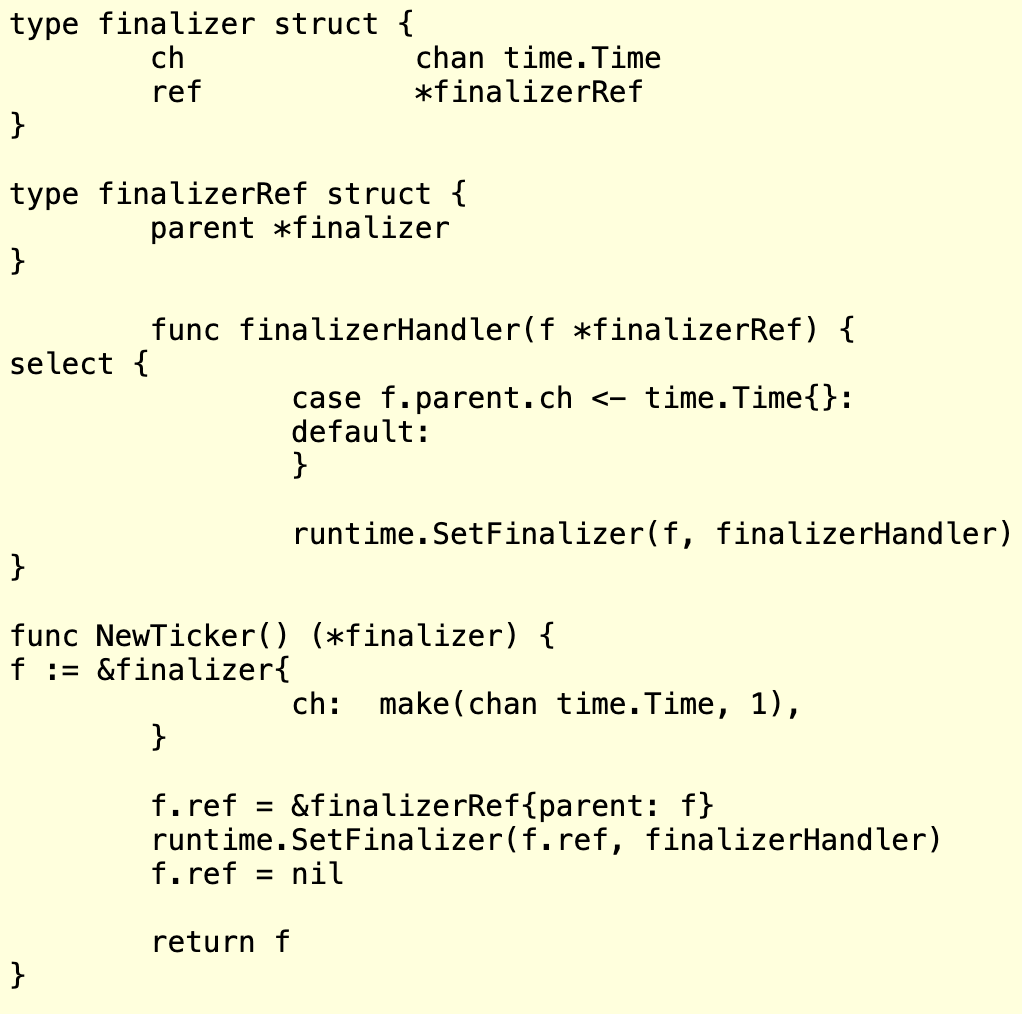
Figure 11: Example code for GC triggered events.
Calling runtime.SetFinalizer(f, finalizerHandler) in finalizerHandler allows the handler to be executed during each GC; this way the reference is not really killed, and it doesn’t cost much to keep the object alive, it’s just a pointer.
Impact
After deploying GOGCTuner in some services, we saw a significant performance impact of the tool on some services, with some services even seeing performance gains in the tens of percent. We saved about 70k CPU cores in cost.
Here are two examples.
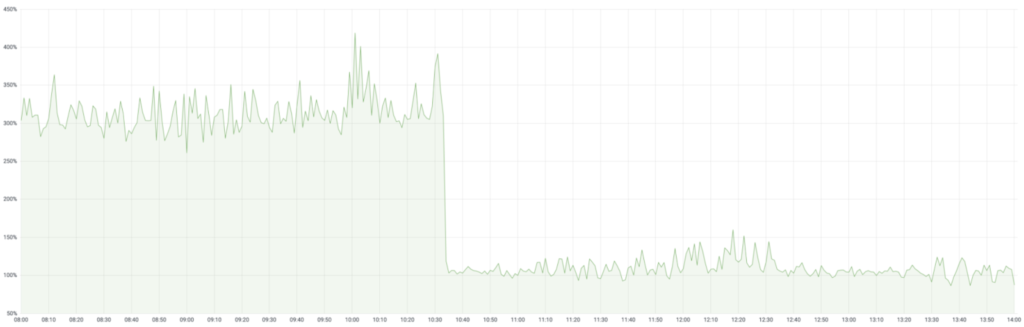
Figure 12: Observability service that operates on thousands of compute cores with high standard deviation for live_dataset (max value was 10X of the lowest value), showed ~65% reduction in p99 CPU utilization.
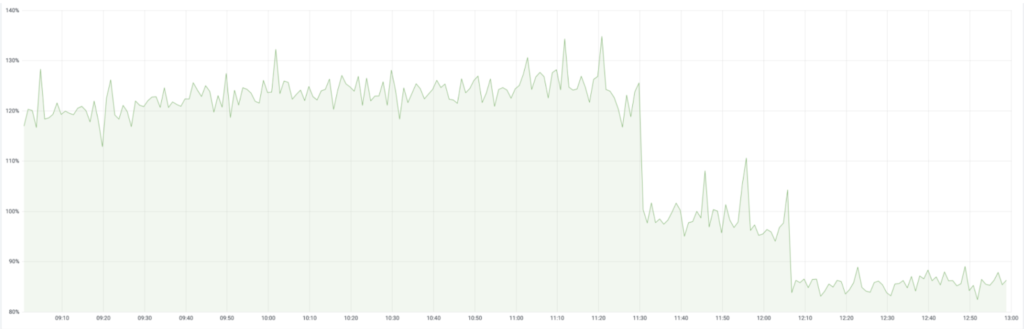

Figure 13: Mission critical Uber eats service that operates on thousands of compute cores, showed ~30% reduction in p99 CPU utilization.
The reduction in CPU usage has resulted in significant improvements in P99 latency (and corresponding SLA, and user experience), as well as reduced the cost of scaling the application (since scaling is based on SLA metrics).
Garbage collection is one of the most difficult language features to understand, and its impact on application performance is often underestimated; Go’s GC strategy and easy tuning methods, our diverse internal, large-scale Go service features, and our stable internal Go observability platform are instrumental in allowing us to make such improvements. As Go’s GC iterates, we will be able to continue to make improvements to improve the company’s competitiveness in the technology space.
Here’s another point from the introduction: there is no silver bullet, no one-size-fits-all optimization solution. We believe that GC optimization is still a difficult problem in cloud-native scenarios. A large number of projects in CNCF are currently written in Go, and we hope that our practice can help these external projects as well.
Uber’s approach is not the first of its kind; previous colleagues at Anthem have made similar attempts.