
Most Gophers don’t really have to care about Go variable escape analysis, or can even ignore it. But if you’re using Go in a performance-sensitive domain, where you want to completely squeeze the performance out of your Go application, then understanding Go escape analysis can be very beneficial. In this article, we’ll take a look at understanding Go escape analysis together.
1. The problem to be solved by escape analysis
C/C++ programmers have a “clear-cut” understanding of heap and stack memory. After the concept of virtual memory address for processes evolved in the operating system, the virtual memory address space of an application is divided into a heap memory area (heap in this figure) and a stack memory area (stack in this figure), as shown in the figure below.
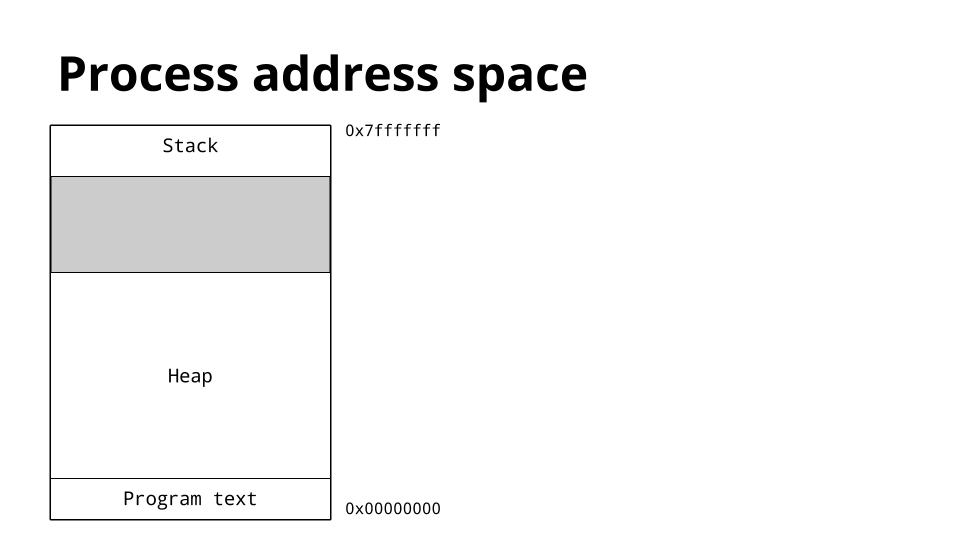
Under the x86 platform linux operating system, as shown above, the stack memory area is generally placed at the high address and the stack extends downward; while the heap memory goes at the low address and the heap extends upward, the advantage of doing so is to facilitate that the heap and stack can dynamically share that memory area.
Does this mean that all memory object addresses allocated in the heap memory area must be smaller than the memory object addresses allocated in the stack memory area? In C/C++ it does, but in Go this is not necessarily the case because the memory page used by the go heap memory is intertwined with the memory page used by the goroutine’s stack.
Both stack memory and heap memory are legally available memory address spaces for applications. They are distinguished because of the need for memory allocation and management for the application.
Storage space for objects on the stack is automatically allocated and destroyed without much involvement from the developer or the programming language runtime, as in the following C code (the difference between stack memory and heap memory is better illustrated in C code).
|
|
The C compiler automatically allocates space on the stack memory for these variables, so we don’t have to think about when it is created and when it is destroyed. We only need to use it in a specific scope (inside the function it is in) without worrying about its memory address not being legal. This is why these variables that are allocated on the stack are also called “automatic variables”. However, if the address is returned to the outside of the function, then code outside the function will get an error when accessing these variables by dereferencing them, as in the following example.
As the code shows, in the above example, we return the address of the automatic variable c in the foo function to the caller of the foo function (main) via the function return value, so that when we reference the address in the main function to output the value of the variable, we will get an exception, for example, if we run the above program on ubuntu, we will get the following result (on macos, gcc will give the same warning, but the program will run without dump core).
This leaves us with a memory object that can be legally used globally (across functions), which is the heap memory object. But unlike memory objects located on the stack that are created and destroyed by the program itself, heap memory objects need to be allocated and freed manually through a dedicated API, and the corresponding allocation and free methods in C are malloc and free.
|
|
In this example we use malloc to allocate a heap memory object in the foo function and return the object to the main function, which then calls the free function to manually free the heap memory block after using the object.
Obviously, compared to automatic variables, the lifecycle management of heap memory objects will impose a significant mental burden on the developer. To reduce this mental burden, programming languages with GC (garbage collection) have emerged, such as Java, Go, and so on. These programming languages with GC automatically manage the objects located on the heap. When an object is unreachable (i.e. when no object of it refers to it), it will be recycled and reused.
But although the advent of GC reduces the mental burden of memory management on developers, GC is not free and the performance loss it brings to programs is not negligible, especially when there are a large number of heap memory objects to be scanned on the heap memory, which will put too much pressure on the GC, thus making it take up more computational and storage resources that should be used to handle business logic. So people started to think of ways to minimize memory allocation on the heap, and variables that can be allocated on the stack stay on the stack as much as possible.
escape analysis is a method for statically analyzing which variables in the code need to be allocated on the stack and which need to be allocated on the heap during the compilation phase of a program based on the data flow in the program code. An ideal escape analysis algorithm would naturally be one that keeps as many variables on the stack as possible that one thinks need to be allocated on the stack, and “escapes” as few as possible to the heap. But this is too ideal, and each language has its own particular situation, and the accuracy of escape algorithms for each language is actually affected by this.
2. Escape Analysis in Go
Escape analysis has been with Go since the day it was born. As mentioned above about the goal of escape analysis, the Go compiler uses escape analysis to determine which variables should be allocated on the stack of a goroutine and which variables should be allocated on the heap.
As of today, there are two versions of Go’s Escape analysis implementation, with a watershed in Go 1.13. The first version of Go’s escape analysis implementation, prior to Go 1.13, was located in src/cmd/compile/internal/gc/esc.go in the Go source code (Go 1.12.7, for example), with a code size of 2400+ lines; Go version 1.13 includes a rewrite of Version 2 Escape Analysis by Matthew Dempsky, and is turned on by default, and can be revert to using the first version of escape analysis via -gcflags="-m -newescape=false". The new version of the code is located in src/cmd/compile/internal/gc/escape.go in the Go project source code. It reduces the escape analysis code from 2400+ lines in the previous version to 1600+ lines, with more complete documentation and comments. Note, however, that there is no qualitative change in the accuracy of the algorithm in this new version of the code.
But even so, after so many years of “tinkering”, those “Go Escape Analysis Flaws” proposed by Dmitry Vyukov in 2015 have mostly been fixed. The Go project has a detailed test code for escape analysis built in (in the test/escape*.go file under the Go project). file).
In the comments of the new version of the escape analysis implementation ($GOROOT/src/cmd/compile/internal/gc/escape.go), we can get a general idea of how escape analysis is implemented. The description of the principle in the notes mentions two invariants that the algorithm is based on.
- pointers to stack objects cannot be stored in the heap (pointers to stack objects cannot be stored in the heap).
- pointers to a stack object cannot outlive that object (i.e., pointers to a stack object cannot survive the destruction of the stack object).
The general principle and process of Go escape analysis is also given in the source code comments. The input of Go escape analysis is the abstract syntax tree (AST) of the entire program obtained by the Go compiler after parsing the Go source file.
The Node slice of the AST of the code obtained after source code parsing is xtop.
In the Main function, xtop is passed into the escape analysis entry function escapes.
|
|
The following is an implementation of the escapes function.
|
|
According to the annotation, the general principle of escapes is.
- First, a directed weighted graph is constructed, where the vertices (called “locations”, represented by gc.EscLocation) represent variables assigned by statements and expressions, and the edges (gc.EscEdge) represent assignments between variables (the weights represent the number of addresses addressed/fetched).
- Next, traverse (visitBottomUp) this directed weighted graph and look for assignment paths in the graph that may violate the above two invariant conditions. The assignment paths that violate the above invariants. A variable v is marked as requiring an assignment on the heap if its address is stored on the heap or elsewhere that may exceed its lifetime.
- To support inter-functional analysis, the algorithm also records the data flow from each function’s arguments to the heap and to its result. The algorithm refers to this information as the “parameter tag”. This tag information is used during static calls to improve the escape analysis of function parameters.
Of course, even after reading this, you may still be confused, it does not matter, this is not to explain the principle of escape analysis, if you want to understand the principle, then please read the more than 2400 lines of code carefully.
Note: One thing needs to be clear, that is, the static escape analysis also can not determine the object will be placed on the heap, the subsequent precise GC will deal with these objects, so as to ensure the maximum degree of code security.
3. Examples of Go escape analysis
Go toolchain provides a way to view the escape analysis process, we can use -m in -gcflags to make Go compiler output the escape analysis process, here are some typical examples.
1) Escape analysis of a simple native type variable
Let’s look at the escape analysis process for a native integer variable, here is the sample code.
|
|
We perform escape analysis with -gcflags “-m -l”. The reason for passing -l is to turn off inline and shield inline from this process and from the final code generation.
The result of the escape analysis is consistent with our manual analysis: m and n in the function bar escape to the heap (corresponding to the line with the words moved to heap: xx in the output above), and these two variables will be allocated storage on the heap. The a in the foo function and the pointer to the memory block pointed to are allocated on the stack (even if we created the int object by calling new, the new object in Go is not necessarily allocated on the heap, and the output log of the escape analysis specifically mentions that new(int) did not escape). Let’s execute the example (also passing -l to close the inline).
First, we see that the unescaped a and p blocks are in the address area 0xc000074860~0xc000074868, while the escaped m and n are allocated to the heap memory space, which from the output is in 0xc0000160e0~0xc0000160e8. We can clearly see that these are two different memory address spaces; in addition The output of AllocsPerRun from the testing package also confirms that the function bar performs two heap memory allocation actions.
Let’s take a look at the assembly code corresponding to this code.
We see that in lines 14 and 15 of the corresponding source code, assembly calls runtime.newobject to perform a memory allocation action on the heap, which is exactly where the escaped m and n declarations are located. We can also see from the implementation of the newobject code below that it actually performs a malloc action on the memory managed by gc.
2) Escape analysis of sliced variables themselves and sliced elements
Any gopher who knows how slicing works knows that a sliced variable is essentially a triplet.
The first field of this triplet, array, points to a pointer to the real storage element at the bottom of the slice. Thus when allocating memory for a slice variable, it is important to consider both where the slice itself (i.e. the slice structure above) is allocated and where the slice elements are stored. Let’s look at the following example.
|
|
Run escape analysis on the above example.
We see from the output that.
- the sl in the escapeSlice function located at line 39 escaped to the heap.
- the elements of the slice sl in the escapeSlice function located at line 39 also escaped to the heap.
- the elements of the slice sl located at line 27 did not escape.
Since it is difficult to see if the elements of each slice in the three functions escape, let’s see by running the example.
|
|
Note: We use the SliceHeader of the reflect package to output the fields in the slice triplet that represent the address of the underlying array, in this case slice data.
We see that.
- The first function noEscapeWithDataInHeap declares an empty slice and appends elements to the slice later using append. (b) From the output, it appears that the slice itself is allocated on the stack, but the runtime chooses to store its elements on the heap when dynamically extending the slice.
- The second function noEscapeWithDataInStack directly initializes a slice with 8 elements in storage space. If there are more than 8 additional elements, the runtime allocates a larger space on the heap and copies the 8 elements from the original stack, and the subsequent elements of the slice are stored on the heap. This is why it is highly recommended to create a slice with a predicted cap parameter, not only to reduce the frequent allocation of heap memory, but also to improve performance when all elements are allocated on the stack under the cap capacity if the slice variable is not escaped.
- The third function escapeSlice, on the other hand, slice variables themselves and the storage of their elements on the heap.
3) fmt.Printf series functions let variables escape to the heap (heap)?
Many people in the go project issue feedback fmt.Printf series of functions let variables escape to the heap, is this really the case? Let’s take a look at the following example.
|
|
Note: The println and print predefined functions do not have the “side effects” that affect the fugitive nature of variables like the fmt. So here println is used to output the actual allocated memory address of the variable.
To run the escape analysis on the above code.
We see that the escape analysis outputs the variable “a escapes to heap” on line 8, but this “escapes” is a bit strange, because according to previous experience, if a variable really escapes, then the escape analysis will output in the line where it is declared output: “moved to heap: xx”. The above output is neither on the line where the variable is declared, nor does it say “moved to heap: a”. Let’s run the above example to see if the address of variable a is on the heap or the stack.
We see that the address of variable a is on the same stack space as the address of the non-escaped variable b. Variable a has not escaped! If you decompile to assembly, you will certainly not see the runtime.newobject call either.
Then “. /printf1.go:8:13: a escapes to heap” line means what exactly? Obviously the escape analysis in this line is an analysis of the data flow into fmt.Printf, so let’s modify the go standard library source code and then build -a recompile printf1.go to see the distribution of variables inside fmt.
Recompile printf1.go and run the compiled executable (to avoid).
We see that the real parameter a of fmt.Printf is passed in and boxed into a form variable of type interface{}, which itself is allocated on the stack (0xc00006cf58), and that the type and value parts of the form variable of type interface{} output via println point to 0x10af200 and 0xc0000160c8, respectively. Obviously the value part is allocated on the heap memory. Then “. /printf1.go:8:13: a escapes to heap” means that the value part of the boxed variable is allocated on the heap? We are not sure here.
Let’s look at an example to compare.
|
|
In the printf2.go example, unlike printf1.go, we use fmt.Printf in the foo function to output the address of the variable a: &a. Let’s run the new version of the escape analysis.
We see that the variable a declared at line 6 actually does escape to the heap. Let’s run printf2.go.
We see that the address of variable a is indeed very different from variable b on the stack, which should be on the heap, so it looks like the gopher who mentioned the issue in the go project was right. The address of variable a is passed into fmt.Printf as a real reference and then boxed into an interface{} formal reference variable, and from the results, fmt.Printf really requires the value of the boxed formal reference variable to be partially allocated on the heap, but according to the escape analysis invariant, the object on the heap cannot store an address on the stack, and this time the address of a is stored, so the a is determined to be an escape, and so a itself is allocated on the heap (0xc0000160c8).
Let’s run an older version of the escape analysis with go 1.12.7.
|
|
The old version of escape analysis gives more detailed output, e.g., “&a escapes to heap”, which must refer to &a being boxed to heap memory; whereas println outputs &a without &a being boxed. But the final determination of the variable a thereafter is an escape.
Go core team member Keith Randall gave an explanation of the logs output from the escape analysis 469117368), which means that when the escape analysis output “b escapes to heap”, it means that the value stored in b escapes to the heap (which makes sense when b is a pointer variable), i.e. any object referenced by b must be allocated on the heap, but b itself does not; if b itself also escapes to the heap, then the escape analysis will output “&b escapes to heap”.
This problem is no longer fixed, and its core problem is in 8618 this issue.
4. Manually enforcing escape avoidance
For the example in printf2.go, we are sure for sure as well as certain: a does not need to escape. However, if we use fmt.Printf, we cannot block the escape of a. So is there a way to interfere with the escape analysis so that memory objects that the escape analysis thinks need to be allocated on the heap but that we are sure don’t think need to escape avoid escaping? In the Go runtime code, we found a function.
And it is heavily used in the Go standard library and runtime implementation. The logic of this function is implemented so that the pointer value we pass in is the same as the pointer value we return. The function simply does a conversion via uintptr that converts the pointer to a value, which “cuts off” the data flow trace for escape analysis and causes the incoming pointer to avoid escaping.
Let’s look at the following example.
|
|
Implement a uniform analysis for this code.
We see that a has not escaped this time. Run the compiled executable.
We see that a is not placed on the heap like printf2.go, this time it is allocated on the stack as well as b. And the stack address of a is always valid during the execution of fmt.Printf.
There was a paper on optimizing performance by escape analysis “Escape from Escape Analysis of Golang The paper uses the above idea of noescape function, which you can download and read if you are interested.
5. Summary
Through this article, we have learned about the problems to be solved by escape analysis, the current state and simple principles of Go escape analysis, some examples of Go escape analysis, and a description of the output logs of escape analysis. Finally, we give a solution to forcibly avoid escape analysis, but use it with caution.
In everyday go development, escape analysis need not be considered in most cases, except in performance-sensitive areas. In these areas, doing an escape analysis of the system execution hotspots and the corresponding optimization may bring some performance improvement to the program.
The source code involved in this article can be downloaded at here.