When you consider adding to your application based on the capabilities of Kubernetes, it’s like opening a Pandora’s Box, and you don’t know exactly what’s in that box, just as you don’t know what is, or will be, happening to the Kubernetes cluster and the applications on it that you rely on.
No matter what architecture is chosen and what runtime the underlying layer is based on, observability always has a very high priority. There is an argument that if you don’t know how to operate and maintain it, don’t try to deploy it. That’s a very down-to-earth way of thinking about the end in mind.
That said, if we embrace Kubernetes, what does the “observability” we’re looking for look like? For microservices architectures, I see a few areas as passing lines.
- observability of cluster and application state
- cluster and application logging
- observability of inter-application traffic, call relationships and request status
In short, it is: monitoring, logging, tracking, and Prometheus is a more mature solution in Kubernetes monitoring.
Prometheus
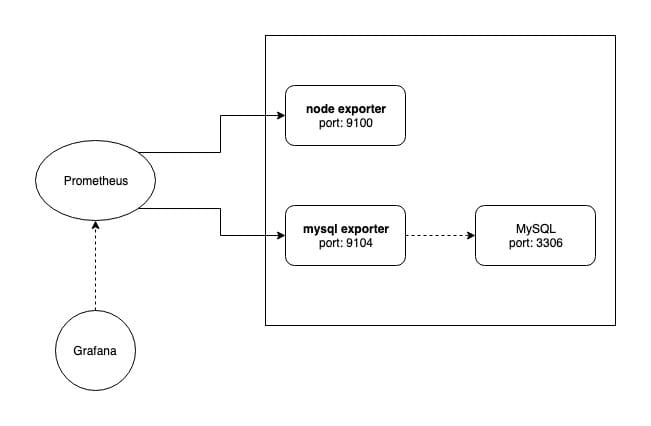
Prometheus is an open source monitoring and alerting system based on a temporal database, born from SoundCloud. prometheus works on the basic principle of periodically capturing the state of monitored components via the HTTP protocol, so monitored components only need to implement a compliant HTTP interface to access it. For components that do not provide an HTTP interface by default, such as Linux, MySQL, etc., Prometheus supports the use of an exporter to collect information and provide a metrics interface on behalf of the component.
A post on SoundCloud’s blog briefly explains the Prometheus architecture and how it works. The article identifies four characteristics that Prometheus meets:
- A multi-dimensional data model
- Operational simplicity (easy to deploy and maintain)
- Scalable data collection and decentralized architecture (flexible data collection)
- a powerful query language (powerful query language)
The first and the fourth are also features of the temporal database, but Prometheus does not have any additional storage built in by default for easy deployment and chooses to implement it itself. For the fourth feature Prometheus implements the PromQL query language, which enables powerful query rules.
With iterations of the release, Prometheus features have long been more than just that.
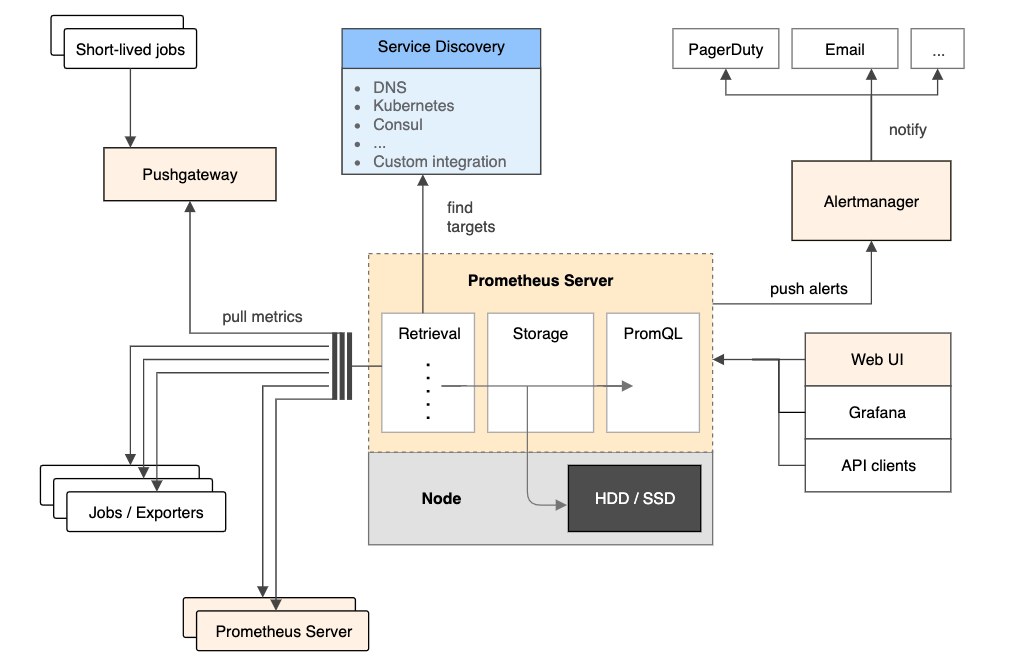
As you can see from the architecture diagram of Prometheus, there are 4 main components.
- Prometheus Server
- PushGateway
- AlertManager
- WebUI
Only Prometheus Server is the most important component, which is responsible for data collection. Prometheus uses the pull method to collect data from the monitored object, but if the monitored object needs to push its state to Prometheus through Push, PushGateway can be introduced, and the monitored object will actively The monitored object will actively push its state to PushGateway, and Prometheus Server will regularly go to PushGateway to collect it.
AlertManager and WebUI are not required components, the former can set alarms based on the collected data, and the latter can display monitoring data in real time by means of a web interface.
Prometheus Operator
Prometheus can be deployed in a variety of ways, and thanks to its simple working principle, you only need to deploy Prometheus Server to an environment where you can access the monitored objects.
However, for K8s, because of the relatively closed network environment within the cluster and the volatile IP of Pods, CoreOS has opened source to manage and deploy Prometheus via Operator (CRD) (https://github.com/coreos/prometheus-operator).
Installing the Operator
Installing Prometheus Operator is as simple as going directly to the root of your Git repository and kubectl apply where the bundle.yaml is located.
Basic concepts
Prometheus Operator will host the deployment, management and administration of Prometheus, and based on the CRD in K8s, Prometheus Operator introduces several new CRs (Custom Resources):
- Prometheus: Description of the Prometheus Server cluster to be deployed
- ServiceMonitor/PodMonitor: describes the list of Prometheus Server’s targets
- Alertmanager: describes the Alertmanager cluster
- PrometheusRule: describes the alarm rules of Prometheus
The design concept of Prometheus Operator can be found in the document: https://github.com/coreos/prometheus-operator/blob/master/Documentation/design.md.
How it works
The Prometheus Operator listens for changes to the custom resource (CR) above and performs subsequent management logic, as shown in the diagram below.
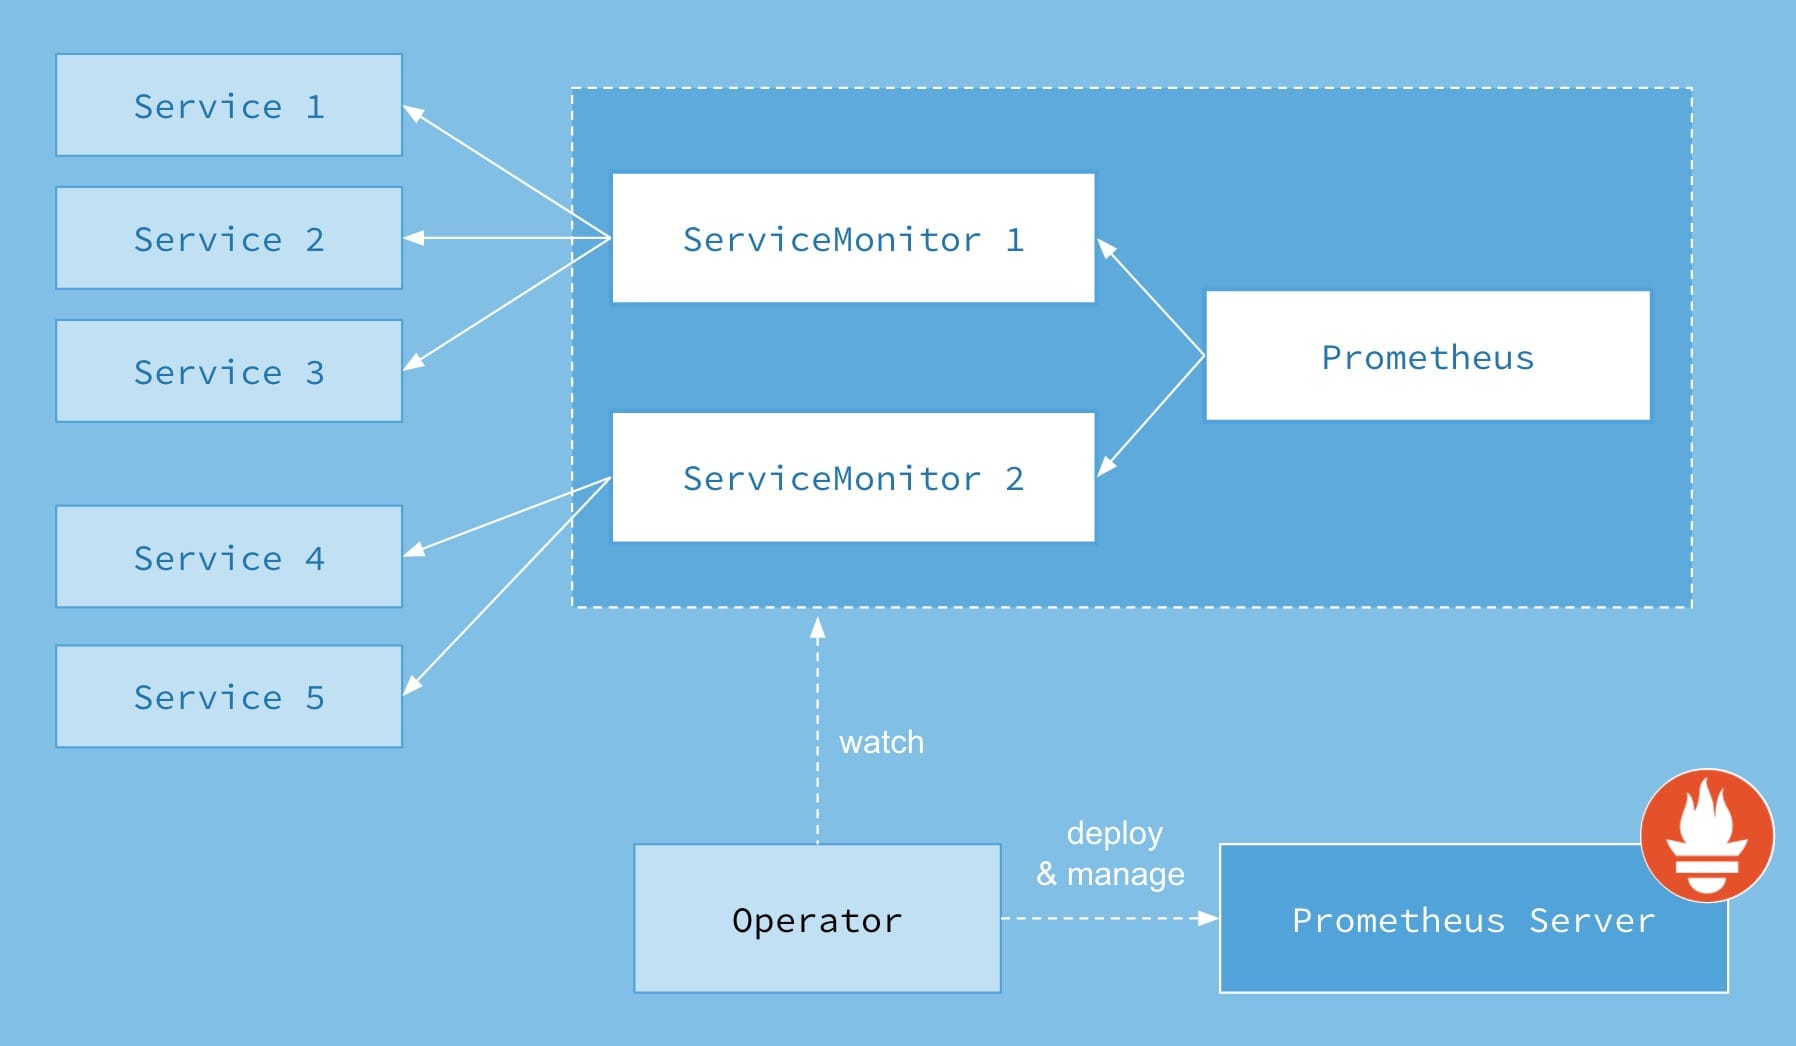
By creating a resource of type Prometheus (where Prometheus refers to a custom resource defined by the Prometheus Operator), the Prometheus selects the associated ServiceMonitor by label selector, and the ServiceMonitor selects the Service to be monitored by defining the label selector of the Service and gets the list of Pod ip’s to be monitored by the Endpoints corresponding to the Service.
Monitoring Application Demo
We briefly describe how to use prometheus-operator to monitor the application according to the official User Guides, more details can be found at: https://github.com/coreos/prometheus-operator/blob/master/Documentation/user-guides/getting-started.md.
Deployment monitored objects
Deploy an application with 3 copies via Deployment.
|
|
The Service is then created so that the service can provide a stable access portal.
Note that the label app=example-app is defined in Service, which is the basis for the selection of ServiceMonitor.
Deployment monitoring
Based on the Label defined in the Service, we can define ServiceMonitor.
ServiceMonitor defines the label for team=frontend, which is the basis for Prometheus to choose ServiceMonitor. So you can create Prometheus.
At this point it becomes clear that there are already prometheus instances being started.
|
|
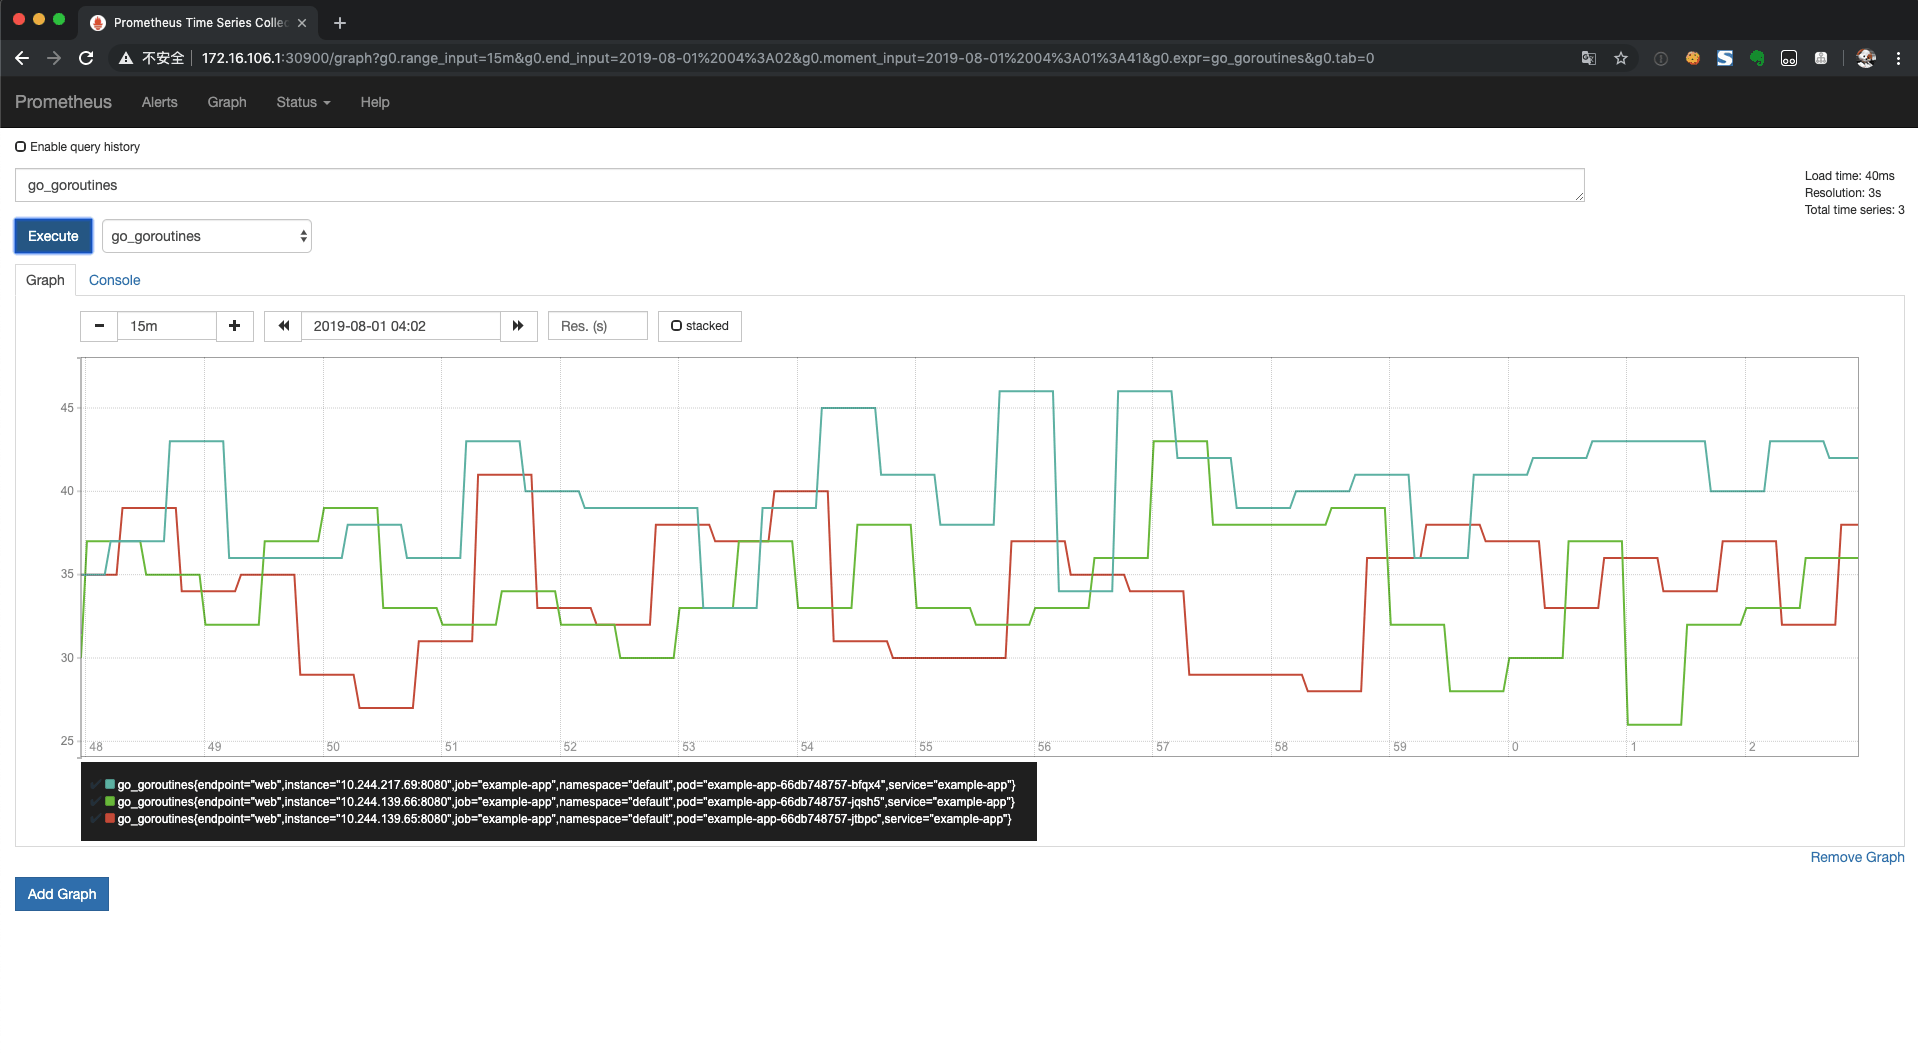
prometheus itself provides the WebUI, so we can create SVCs that are exposed to access outside the cluster (it’s best not to do this in a public network environment).
At this point, you can see the monitoring information for the Demo application within the cluster.
Cluster Monitoring
As you should understand from this custom demo, Prometheus is launching HTTP access to data via SVC, and cluster monitoring is simply giving Prometheus the ability to get the monitoring interface to Kubernetes components. Prometheus also supports the deployment of Node exporter in the form of DaemonSet to collect cluster node information directly.
The form of monitoring data collection for Kubernetes components depends on how the cluster is deployed. For binary deployments, you can install Prometheus directly on the Node and collect data; for container deployments, you can create an SVC for the Kubernetes component, and the subsequent operation is consistent with the monitoring of the cluster application. Related documentation can be found at https://coreos.com/operators/prometheus/docs/latest/user-guides/cluster-monitoring.html.