Overview
Some brokers in a kafka cluster will restart randomly, and there is no pattern to the restart. broker restart is not perceptible to the client side at the usage level, but there are risks in data consistency and stability. broker restart, the connections connected to this broker will be reconnected to other normal brokers, increasing the pressure on the other This increases the pressure on other brokers in the cluster. The leader partition on this broker will also trigger the cut master operation, and frequent cut master will affect the consistency and availability of the partition. partition changes will also trigger the rebalancing of the consumer side, thus affecting the stability of the consumer side.
By checking the kafka server logs, no obvious ERROR-level logs were found. Through the joint investigation with the operation and maintenance students, we finally located and solved the problem, and since this problem is quite typical, we documented the problem identification and location process through this article.
Problem site
-
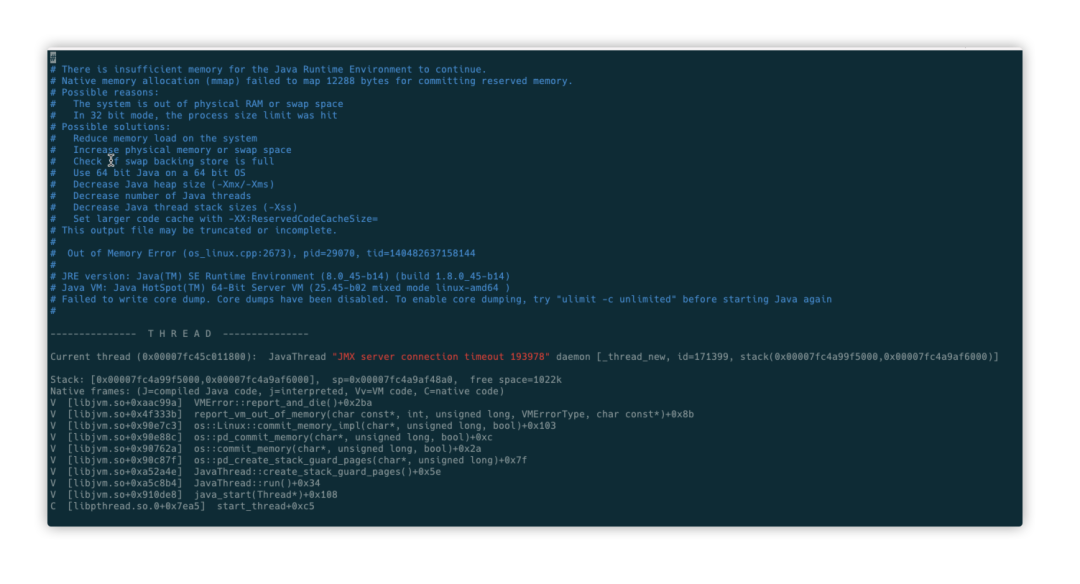
Analyze the java core dump file: /tmp/hs_err_pid128144.log , and find the following clues in the file header, each crash is caused by OOM trigger.
-
Find the memory allocation details in the head and tail of the core dump file: allocating 12288Byte of space fails, yet there is 461984KB of physical memory left, which clearly rules out that the crash is not caused by insufficient memory.
-
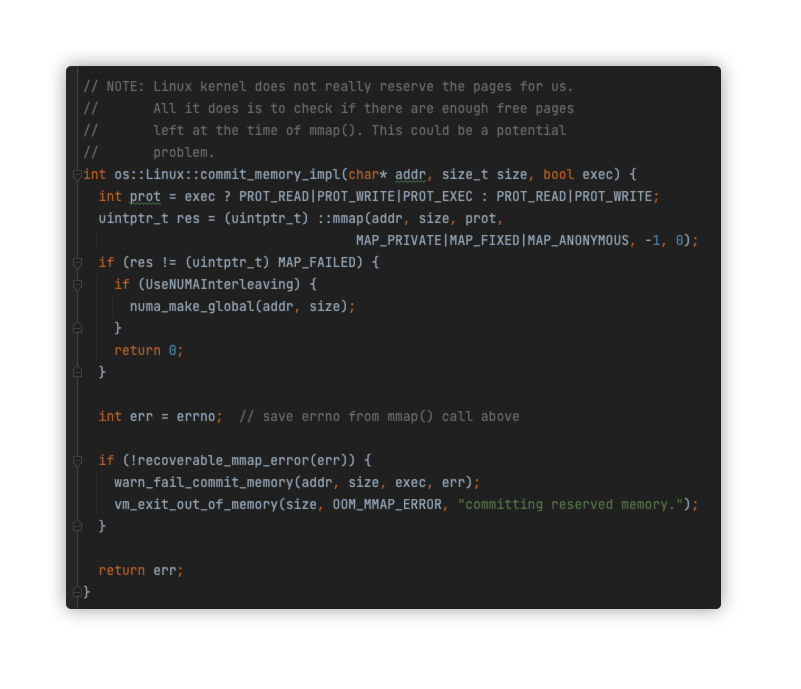
In the thread call stack of the core dump file, we find the function os::pd_create_stack_guard_pages related to allocating pages, and we go to the os::Linux::commit_memory_impl function and find that it actually makes an mmap system call.
-
from the above code into the warn_fail_commit_memory method, theoretically, the log will print warning content, kafka cluster logs for INFO level, so warning logs will not be visible. If the logs were visible, at least we would know what the specific errorno was that occurred in the mmap, and thus conclude why the mmap actually failed. Due to the large size of the online cluster, the number of modified log level restart brokers is high, in order not to affect business, temporarily choose not to restart. By now it seems to have basically broken the idea, can only wait to modify the log level to see its effect.

Analyze gc logs
-
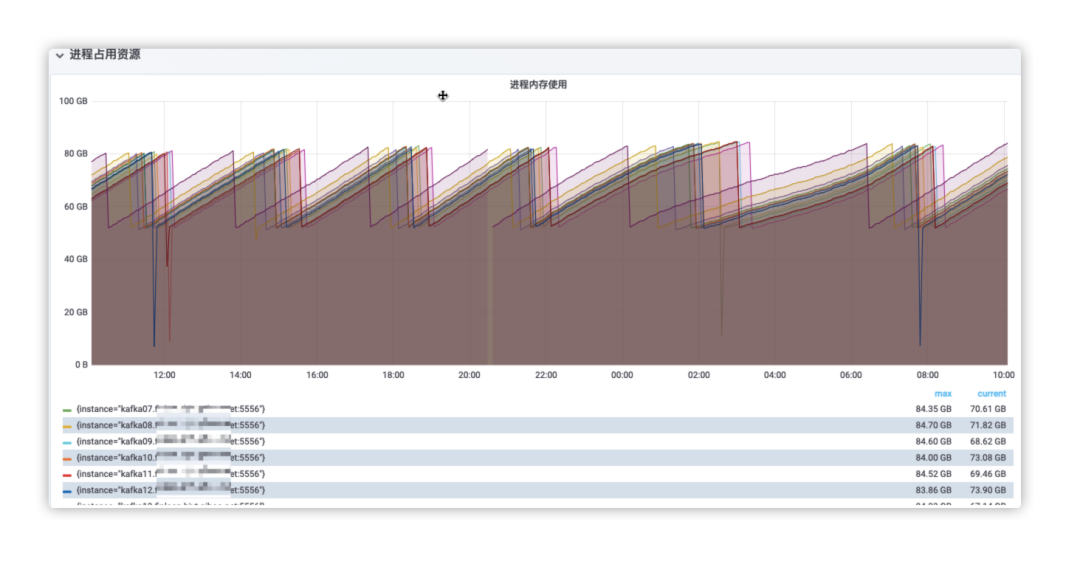
Check grafana monitoring metrics to find clues in process memory usage. Through the gc monitoring situation in the figure below, we can find that there are individual machines with significantly reduced memory occupation after gc, and we can even observe that some brokers have obviously restarted. At this point, we can observe that the brokers with abnormal gc have crashed, so we can determine that the crashes may be related to gc.
-
By analyzing the gc logs, the YoungGen and old OldGen before full gc are not highly used, and the number of gc is not very frequent, so GC Locker is basically not possible, so the most likely is System GC. Then when will System GC happen?
- Explicit code invocation.
- Timed calls in RMI (Remote Method Invocation).
- Invocation due to insufficient off-heap memory.
These cases can be basically ruled out.
-
kafka is written in scala language, and by looking through the kafka code, no System GC calls are found.
-
RMI (Remote Method Invocation) is also not possible, because we do not see the GC Deamon thread from the thread list, so there is no RMI call.
-
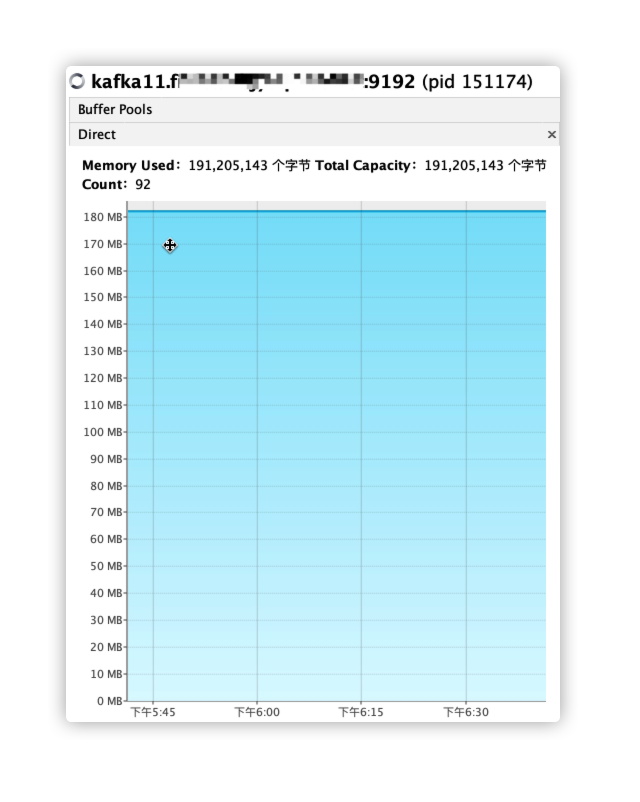
Off-heap memory is mainly talking about DirectByteBuffer, which is also unlikely. Because we see from the JVM parameters, firstly, the maximum MaxDirectMemorySize is not set, and secondly, Xmx is set to 40G, so the default off-heap memory maximum is almost that big. We find that the DirectByteBuffer occupies less than 200MB in the following figure, so the System GC caused by a full off-heap memory can be basically ruled out.
-
kafka is written in scala language and relies on JDK, so I looked through the JDK code to find cases where System GC might be thrown. I found a similar logic in the map method of
sun.nio.ch.FileChannelImpl.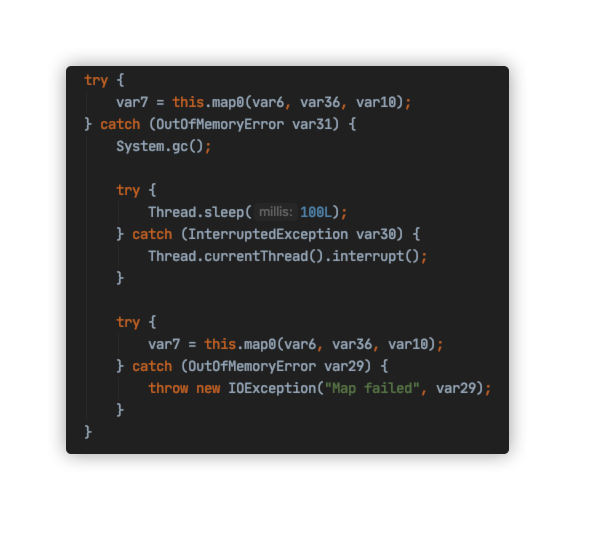
Determine the problem site
-
we look at the native method implementation of sun.nio.ch.FileChannelImpl.map0 Java_sun_nio_ch_FileChannelImpl_map0, because this is where the crash was triggered, and then we see the logic below. Since the crash did throw an OOM exception, we can be absolutely sure that the errno returned by mmap is ENOMEM. So the specific mmap exception that was not printed out in the warning log, as we mentioned earlier, basically confirms that the mmap exception returned an error code of ENOMEM from this place.
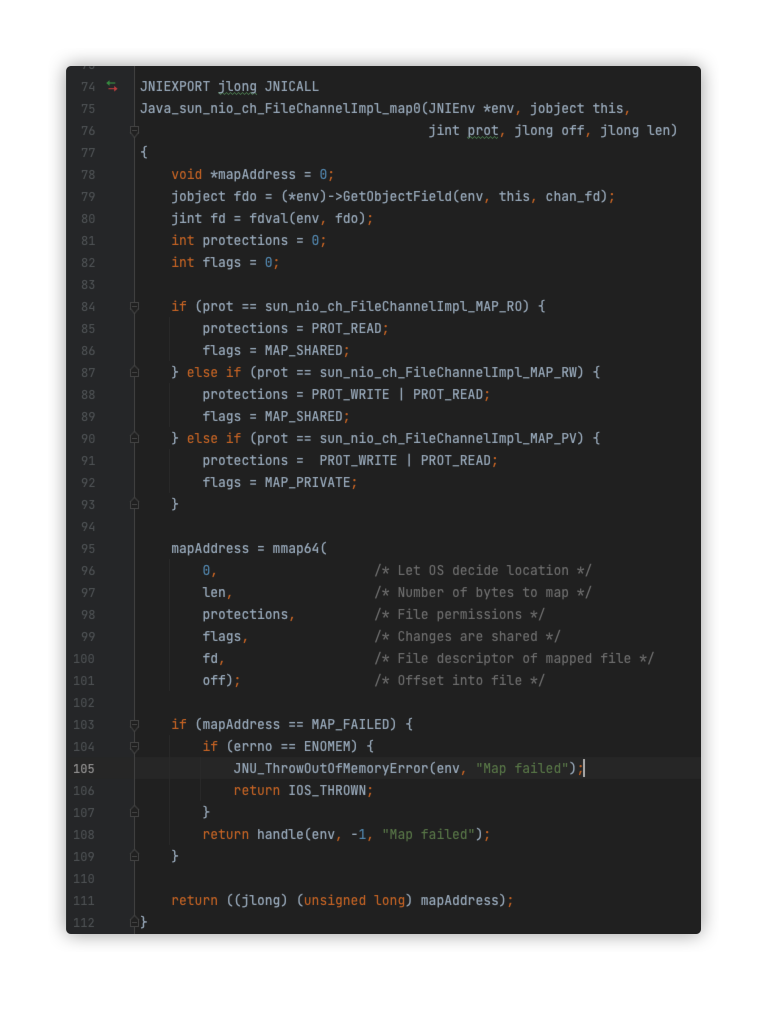
-
Here is the description of ENOMEM in the mmap manual
- ENOMEM: There is no memory available.
- ENOMEM will exceed the maximum number of mappings for the process. This error may also occur with munmap() when unmapping a region in the middle of an existing map, as this will cause two smaller mappings to be unmapped on either side of the region.
-
We confirmed that there is enough physical memory, so we can only wonder if the maximum number of mappings has been reached, and we combined this with the mmap implementation in the kernel (
mm/mmap.c:do_mmap). Using the mmap implementation, we found that mmap does return ENOMEM when the maximum number of vma (virtual memory areas) is reached, so we confirmed that the value of/proc/sys/vm/max_map_countis 65530. This means that the maximum number of vma (virtual memory areas) in our mmap is 65530, and the number of virtual address maps in the java core dump file (the number of entries under Dynamic libraries) is 65531, which is exactly the maximum.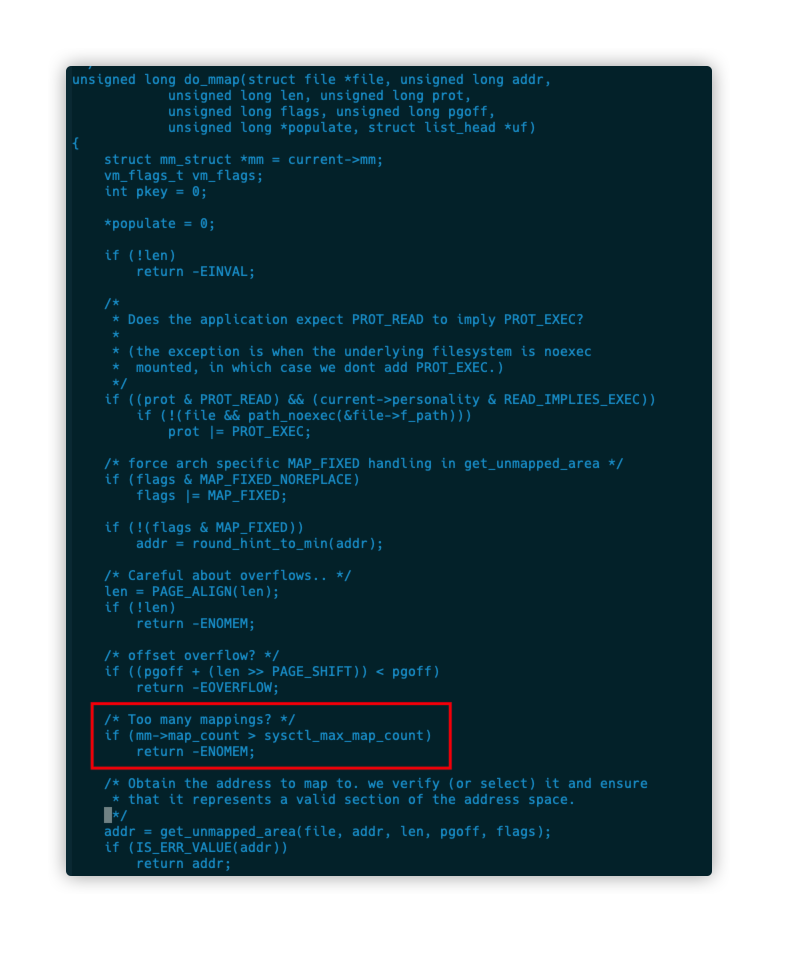
After the above analysis process, we identified the crime scene.
kafka does a lot of memory mapping of index files, and these index files have been occupying the memory without releasing, and slowly reach a memory limit as the number of index files increases. Each time an index file is created, the mmap system call is triggered, and during the mmap check if the maximum limit of vma (virtual memory areas) is reached, which is 65530 in /proc/sys/vm/max_map_count, and if it is exceeded, it crashes directly.
Solution
After the above analysis process, we identified the accident scene.
- Increase the system limit /proc/sys/vm/max_map_count.
- Does kafka’s index file not need to be available all the time? Is it possible to limit it? kafka has to locate messages by the index in the index file when reading messages. If you release the index file reference for messages that are read relatively infrequently, you will need to re-traverse the data file to rebuild the index when reading historical data, a process with high disk IO overhead, which will seriously affect kafka’s throughput. Therefore, we choose to increase the system parameter /proc/sys/vm/max_map_count.