In the various widely circulated C rules, there is generally this mysterious rule that no local variables can be returned.
When the function returns, the stack frame of the function (stack frame) is destroyed, and the memory referenced by the destroyed location is lightly confused with data, and heavily segmentation fault.
After a long period of study, finally became a master of C language, but still can not escape from the complex heap of object reference relationship resulting in dangling pointer.
This is a typical dangling pointer problem, and the object dependencies on the heap can be very complex. The object dependencies on the heap can be very complex. We have to draw the object graph first to write the free logic correctly.
It is unscientific and unreasonable to rely on people to deal with these problems. C and C++ programmers have been suffering for decades and should not repeat the same mistakes.
GC to the Rescue of Programmers
Garbage Collection, also known as automatic memory management technology, is quite widely used in modern programming languages, with the common Java, Go, and C# all integrating corresponding implementations in the language’s runtime.
In traditional programming languages we need to pay attention to where objects are allocated and have to choose for ourselves whether they are allocated on the heap or the stack, but in Go, a language with GC, an escape analysis feature is integrated to help us automatically determine whether an object should be on the heap or the stack, and you can use go build -gcflags="-m" to observe the results of the escape analysis.
Larger objects are also placed on the heap.
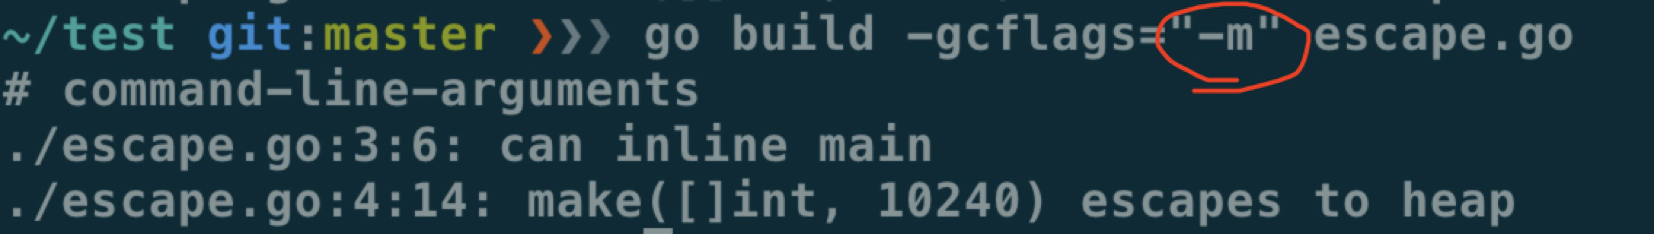
The output of executing gcflags="-m" shows that an escape has occurred.
If the object is allocated on the stack, it is less expensive to manage and the object can be allocated and released by moving the top-of-stack register. If it is allocated on the heap, it has to go through layers of memory request process. However, these processes are transparent to the user and we do not need to care about it when writing code. It is only when optimization is needed that specific escape analysis rules need to be investigated.
The combination of escape analysis and garbage collection has greatly freed programmers’ minds, and it seems that we no longer need to worry about memory allocation and release when writing code.
However, all abstractions have a cost, and that cost is either spent at compile time or at runtime.
GC is a solution that chooses to solve the problem at runtime, but in extreme cases GC itself can still cause problems that are hard to ignore.
The scenario above is that hundreds of millions of kv are cached in memory, and the CPU used by GC is even more than 90% of the total CPU usage at this point. Caching objects in memory in a simple and brutal way turns out to be a CPU killer in the end. It eats up a lot of server resources, which is obviously not the result we expect.
To properly analyze the cause, we need to have a slightly deeper understanding of the implementation mechanism of GC itself.
The Three Players of Memory Management
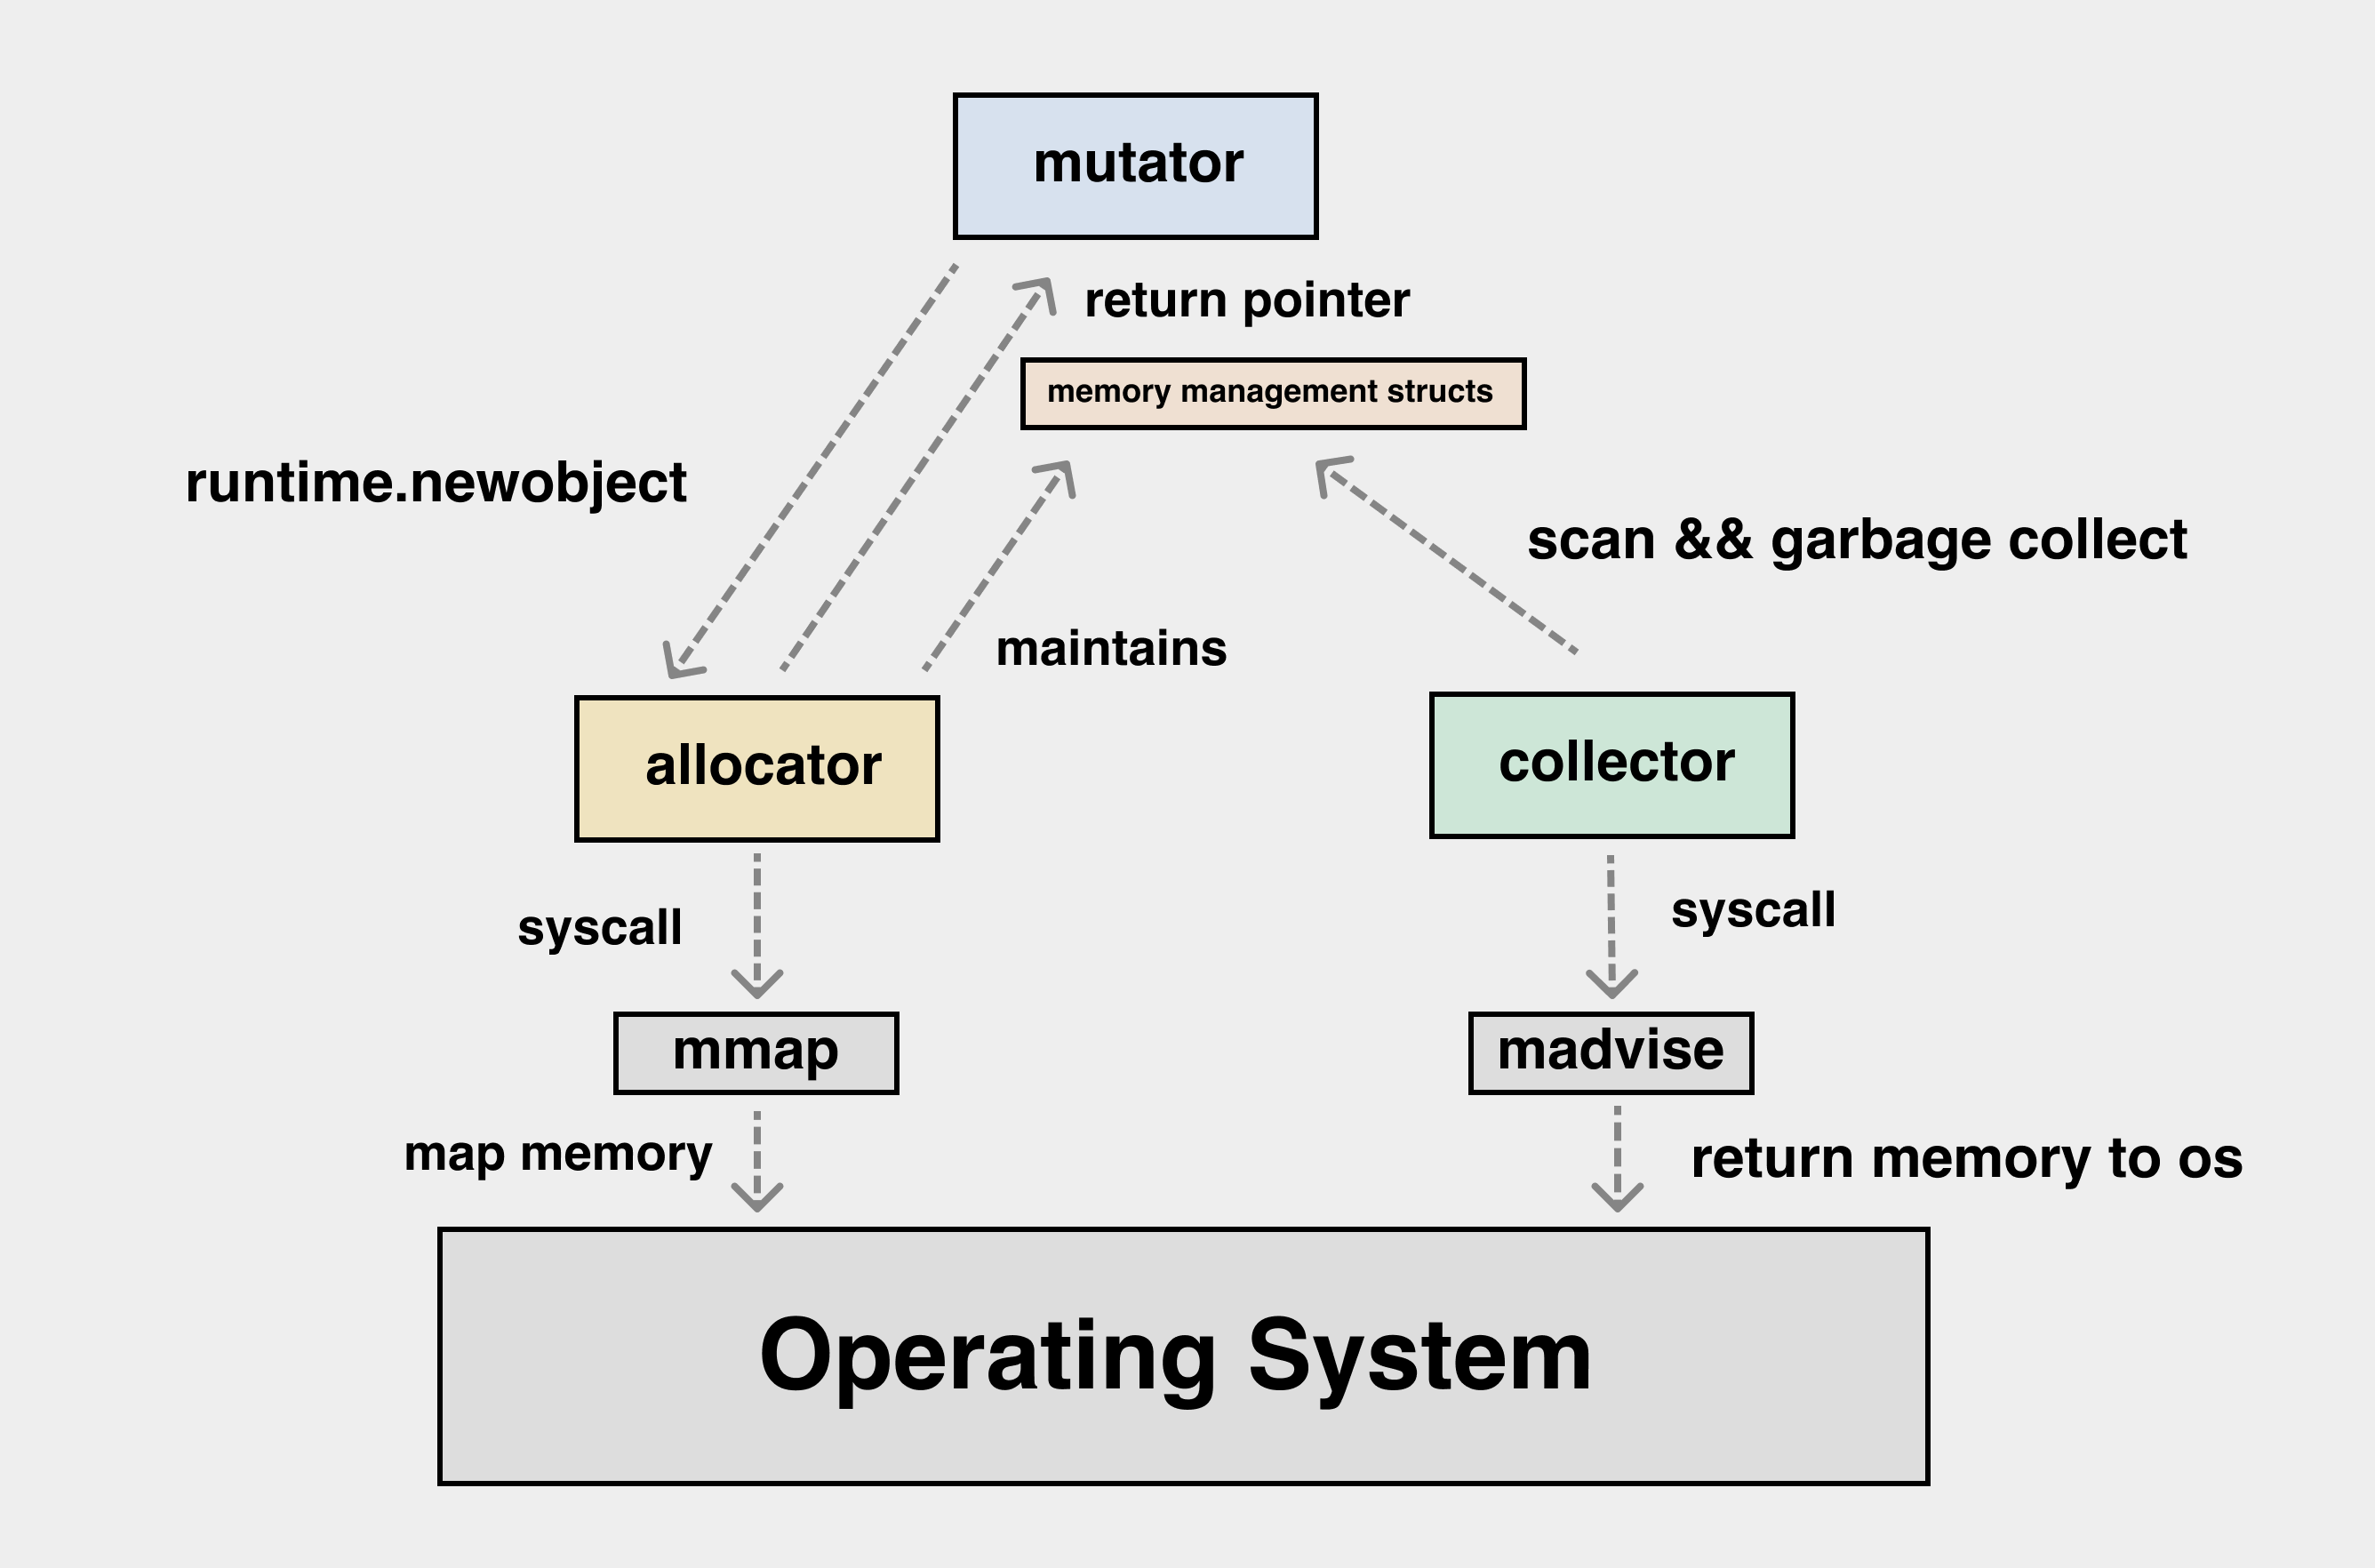
When discussing memory management, we will mainly talk about the three players, mutator, allocator and garbage collector.
-
mutator: refers to our application, i.e. application. We see the objects on the heap as a graph, and if we look beyond the application, the application code is constantly modifying the pointing relationships in this graph of heap objects. The following diagram can help us understand the effect of mutator on the objects on the heap.
The reference relationships of objects are constantly modified during the application runtime.
-
allocator: well understood, memory allocator, applications needing memory have to apply to allocator. allocator to maintain the data structure of memory allocation, multi-threaded allocator to consider the impact of locks in high concurrency scenarios, and targeted design to reduce lock conflicts.
-
collector: garbage collector. Dead heap objects and unused heap memory are reclaimed by the collector and eventually returned to the operating system. The heap objects that survive in memory need to be scanned, and after the scan is complete, the objects that are not scanned are inaccessible heap garbage and need to be reclaimed from the memory they occupy.
The interaction process of the three can be represented by the following diagram.
Allocating memory
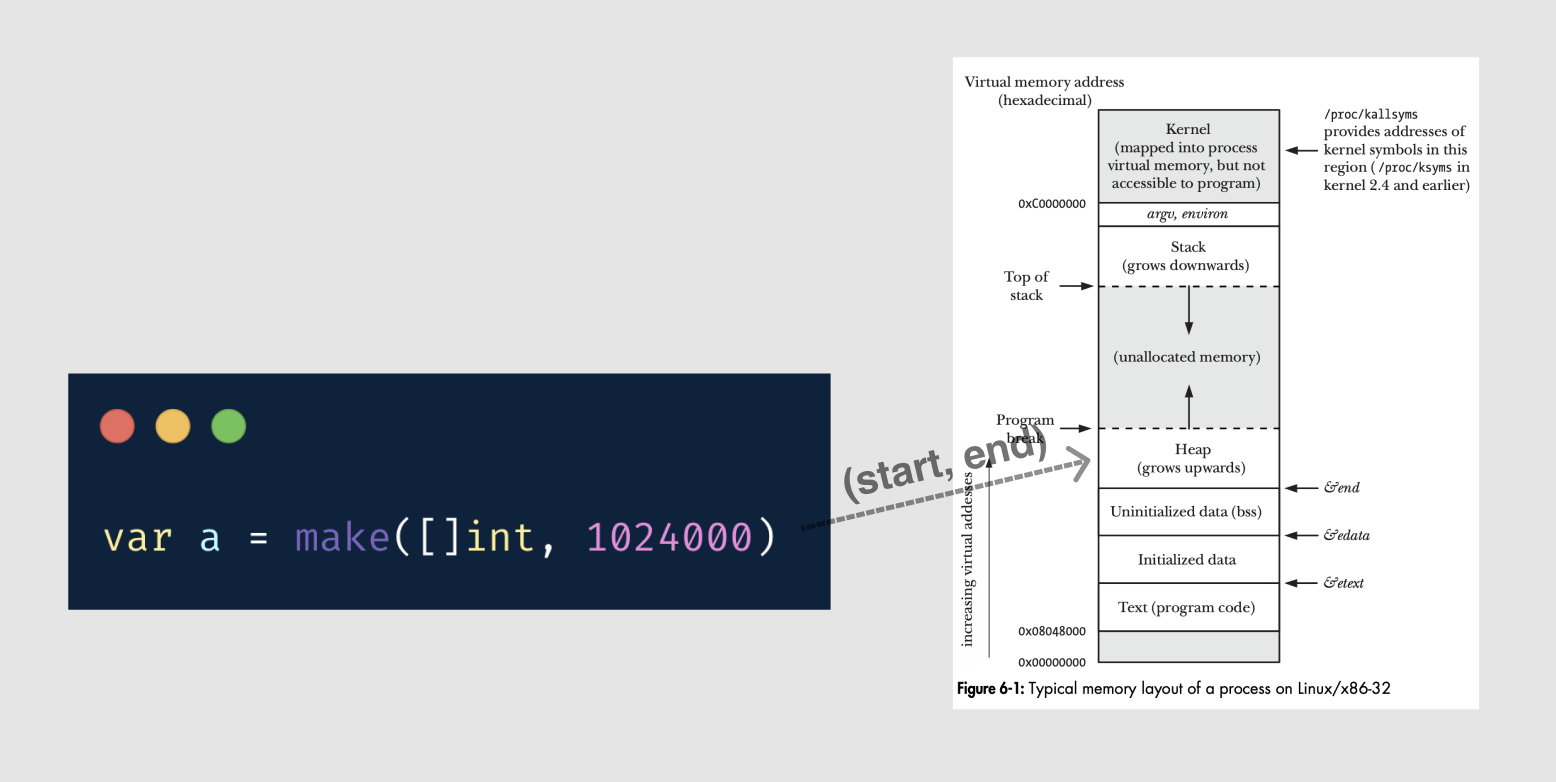
The application uses mmap to request memory from the OS. The interface provided by the OS is simpler, and mmap returns a contiguous region of memory.
mutator requests memory from an application perspective, where I need the memory corresponding to a particular struct, a particular slice, and there is a gap between this and the interface to get memory from the OS. There is a gap between this and the interface to get memory from the OS. It is necessary for allocator to do the mapping and conversion to map the memory viewed as a “block” to the memory viewed as an “object”.
On modern CPUs, we also have to consider the efficiency of memory allocation itself. Small objects are constantly created and destroyed during application execution, and it would be costly to interact with the OS for each object allocation and release. This requires a well-designed multi-level cache for memory allocation at the application level to minimize lock contention during high-frequency creation and destruction of small objects, a problem that has been solved in the traditional C/C++ language, which is tcmalloc.
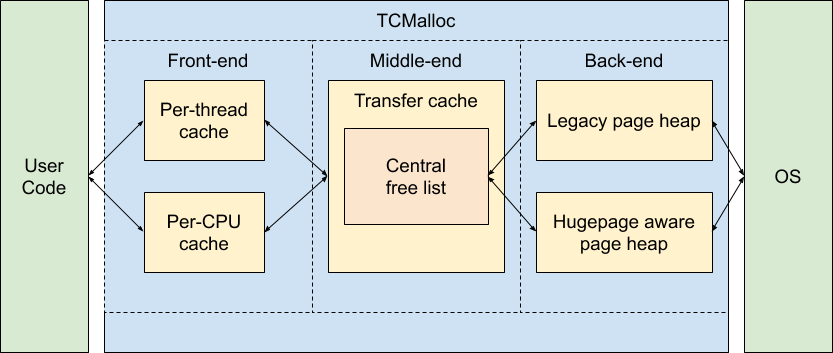
The memory allocator in Go is basically a 1:1 port of tcmalloc. After all, it’s all a Google project.
In Go, the memory allocation process is divided into three categories based on the presence or absence of pointers in the object and the size of the object.
- tiny : size < 16 bytes && has no pointer(noscan)
- small : has pointer(scan) || (size >= 16 bytes && size <= 32 KB)
- large : size > 32 KB
The most complex part of the memory allocation process is the allocation of tiny types.
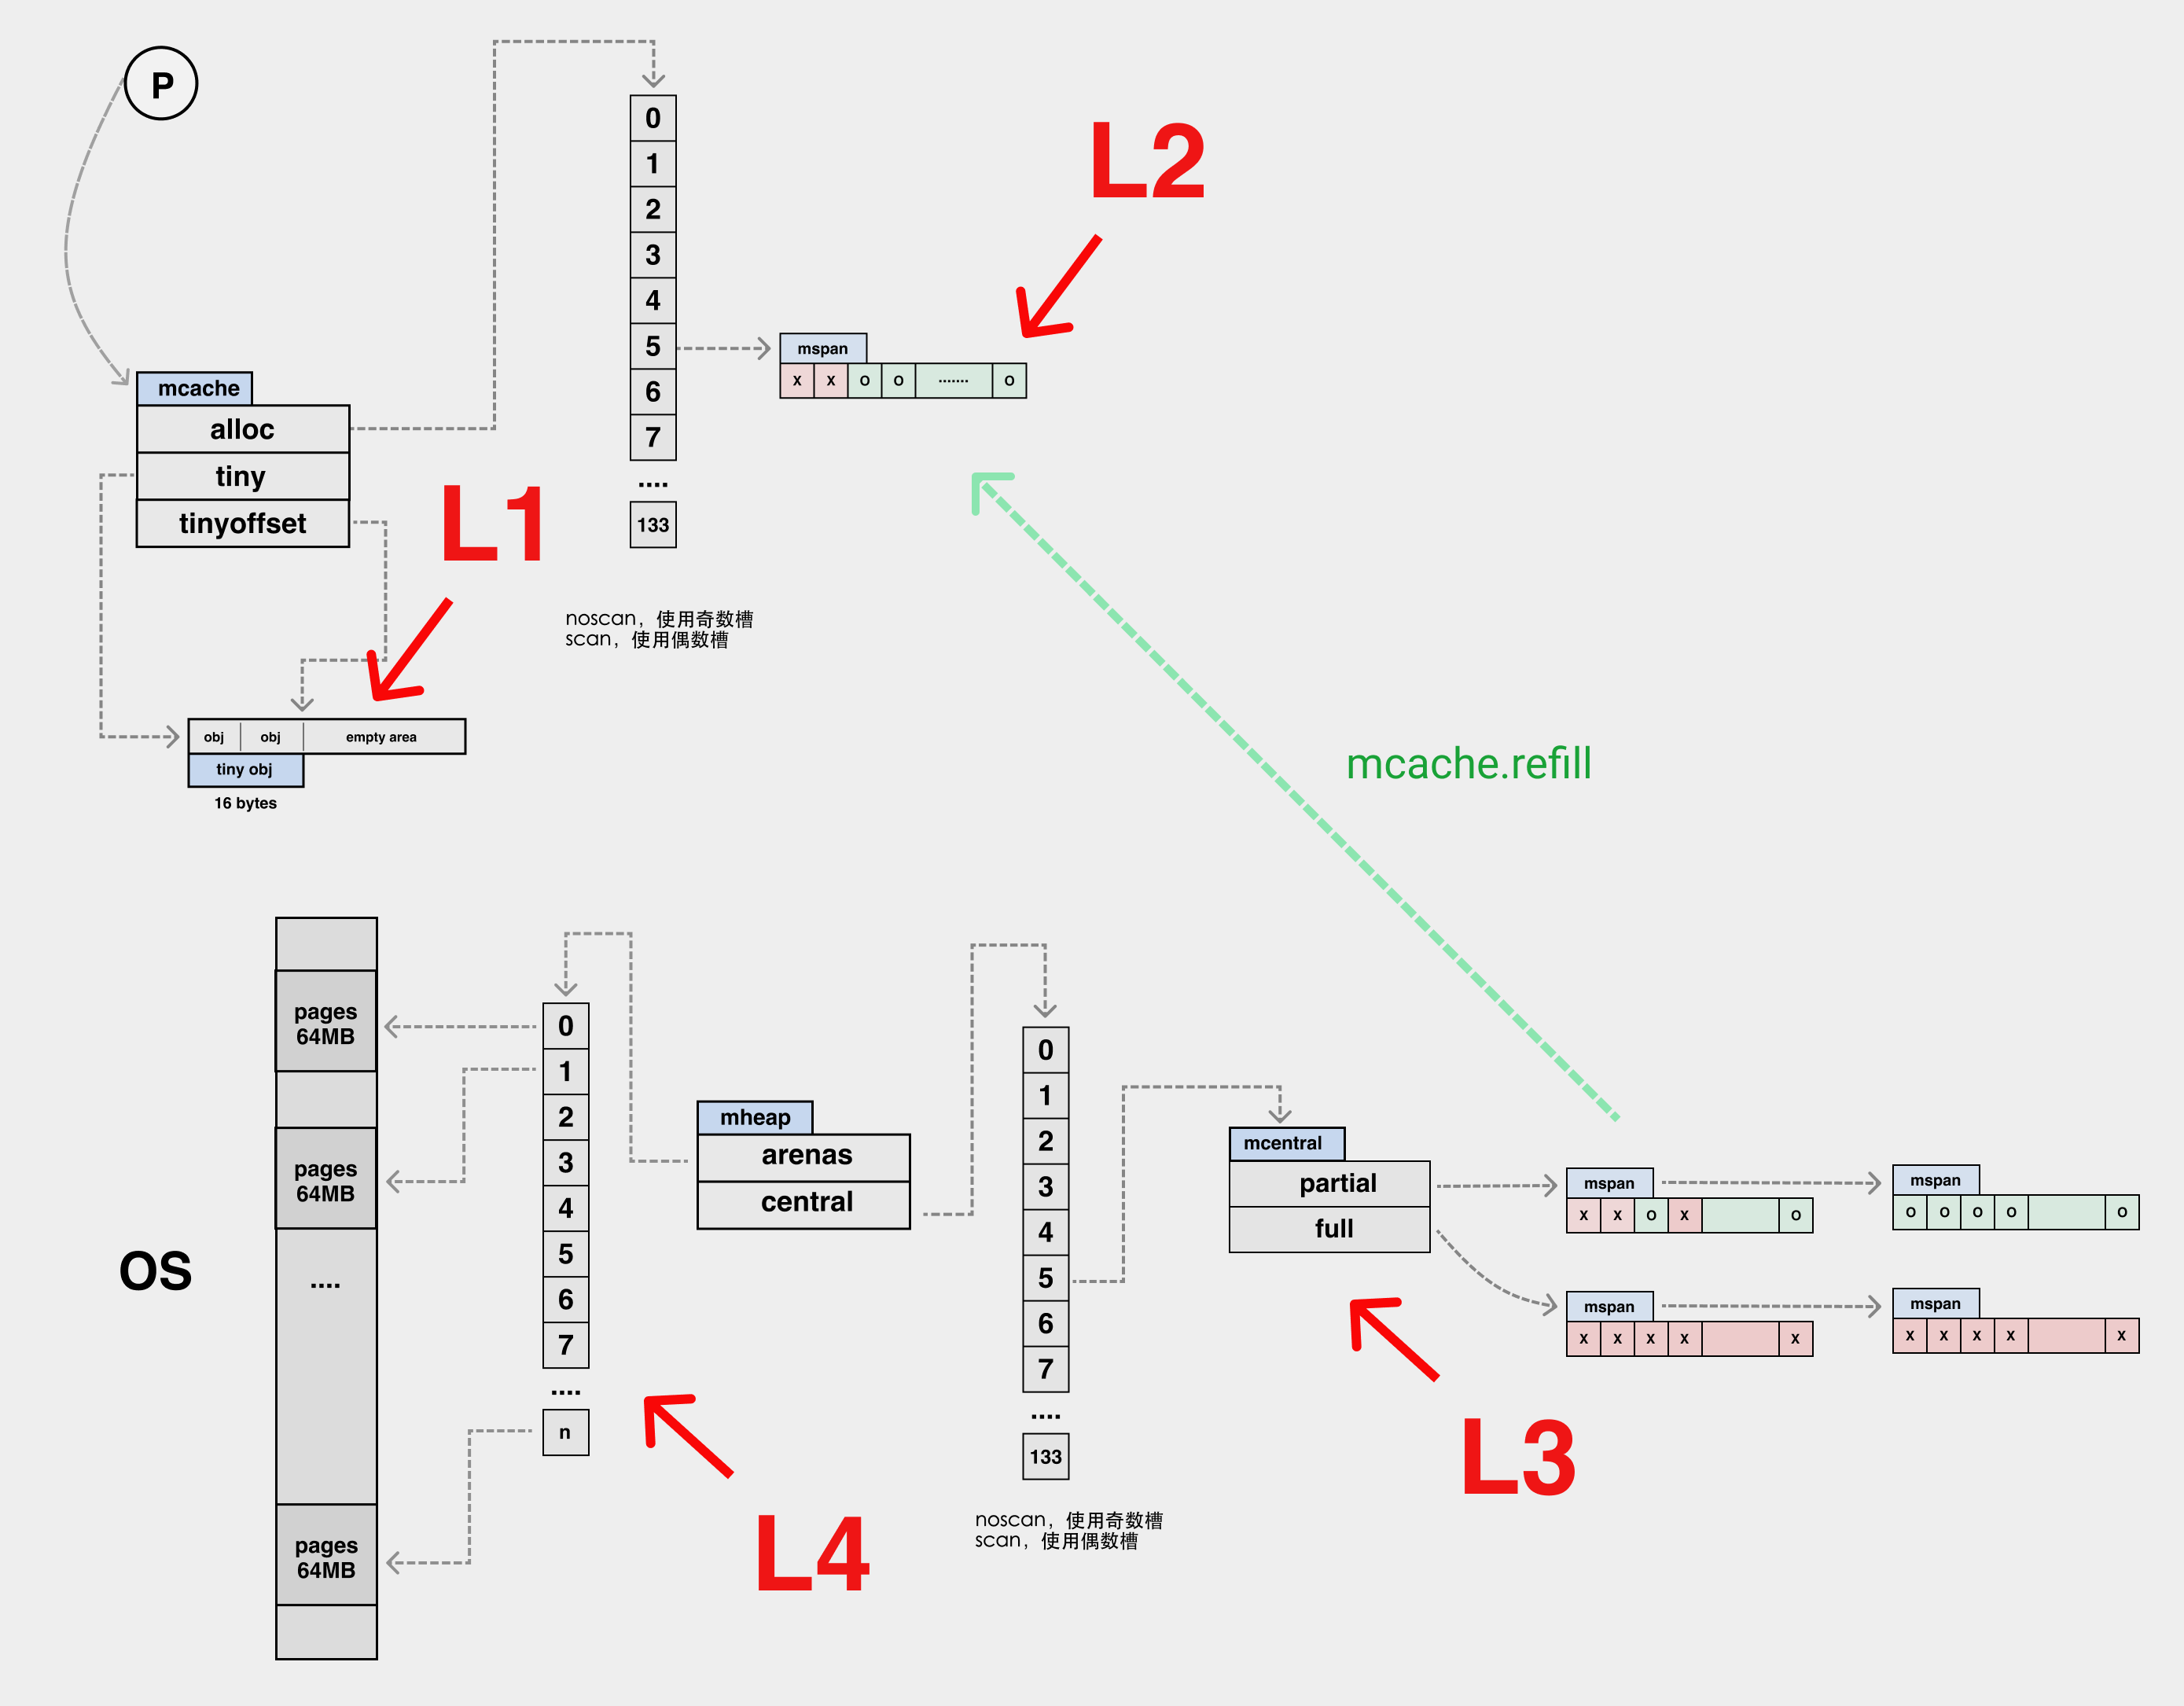
We can analogize the memory allocation path to the CPU’s multi-level cache. Here the tiny inside the mcache can be analogous to the L1 cache, while the elements in the alloc array can be analogous to the L2 cache, the global mheap.mcentral structure is the L3 cache, and mheap.arena is L4. The memory is distributed downwards by pageAlloc to manage the free memory in arena.
| L1 | L2 | L3 | L4 |
|---|---|---|---|
| mcache.tiny | mcache.alloc[] | mheap.central | mheap.arenas |
If L4 does not meet our memory allocation needs, then we need to ask the OS for memory.
Compared to the tiny four-level allocation path, the small type of memory does not have a local mcache.tiny cache, but the rest is identical to the tiny allocation path.
| L1 | L2 | L3 |
|---|---|---|
| mcache.alloc[] | mheap.central | mheap.arenas |
The large memory allocation is a little bit special. Instead of the complicated caching process above, we ask for memory directly from mheap.arenas and go directly to the pageAlloc page allocator.
The page allocator has iterated through many versions in Go, from simple freelist structures, to treap structures, to the latest version of radix structures, and its lookup time complexity has gone from O(N) -> O(log(n)) -> O(1).
In the current version, only constant time complexity is needed to determine whether the radix tree of free pages can satisfy the memory allocation requirement. If it is not satisfied, the arena continues to be sliced or more arena is requested from the OS.
Relationship between memory allocation data structures
arenas are in units of 64MB. arenas are sliced into pages of 8KB, one or more pages can form an mspan, and each mspan can be divided into multiple elements according to the sizeclass.
The following figure.
The relationship between the various memory allocation structures, with the structure of the page allocator omitted from the diagram.
Each mspan has an allocBits structure. When allocating an element from an mspan, you just need to set the bit position one of the corresponding element position in the mspan. In fact, it is the bit position one of the corresponding allocBits of the mspan, and there are some optimizations in the code, so we won’t go into details.
Garbage collection
Go uses the concurrent mark and sweep algorithm as its GC implementation. The concurrent mark and sweep algorithm cannot solve the memory fragmentation problem, while tcmalloc alleviates the memory fragmentation problem to some extent, and the two complement each other.
This is not to say that tcmalloc is completely free of memory fragmentation, search for max waste in the code if you don’t believe me.
Waste sorting

Syntactic garbage and semantic garbage.
semantic garbage, also known as memory leaks in some scenarios.
Semantic garbage refers to objects that are syntactically reachable (can be referenced by local and global variables), but semantically they are garbage and the garbage collector can’t do anything about it.
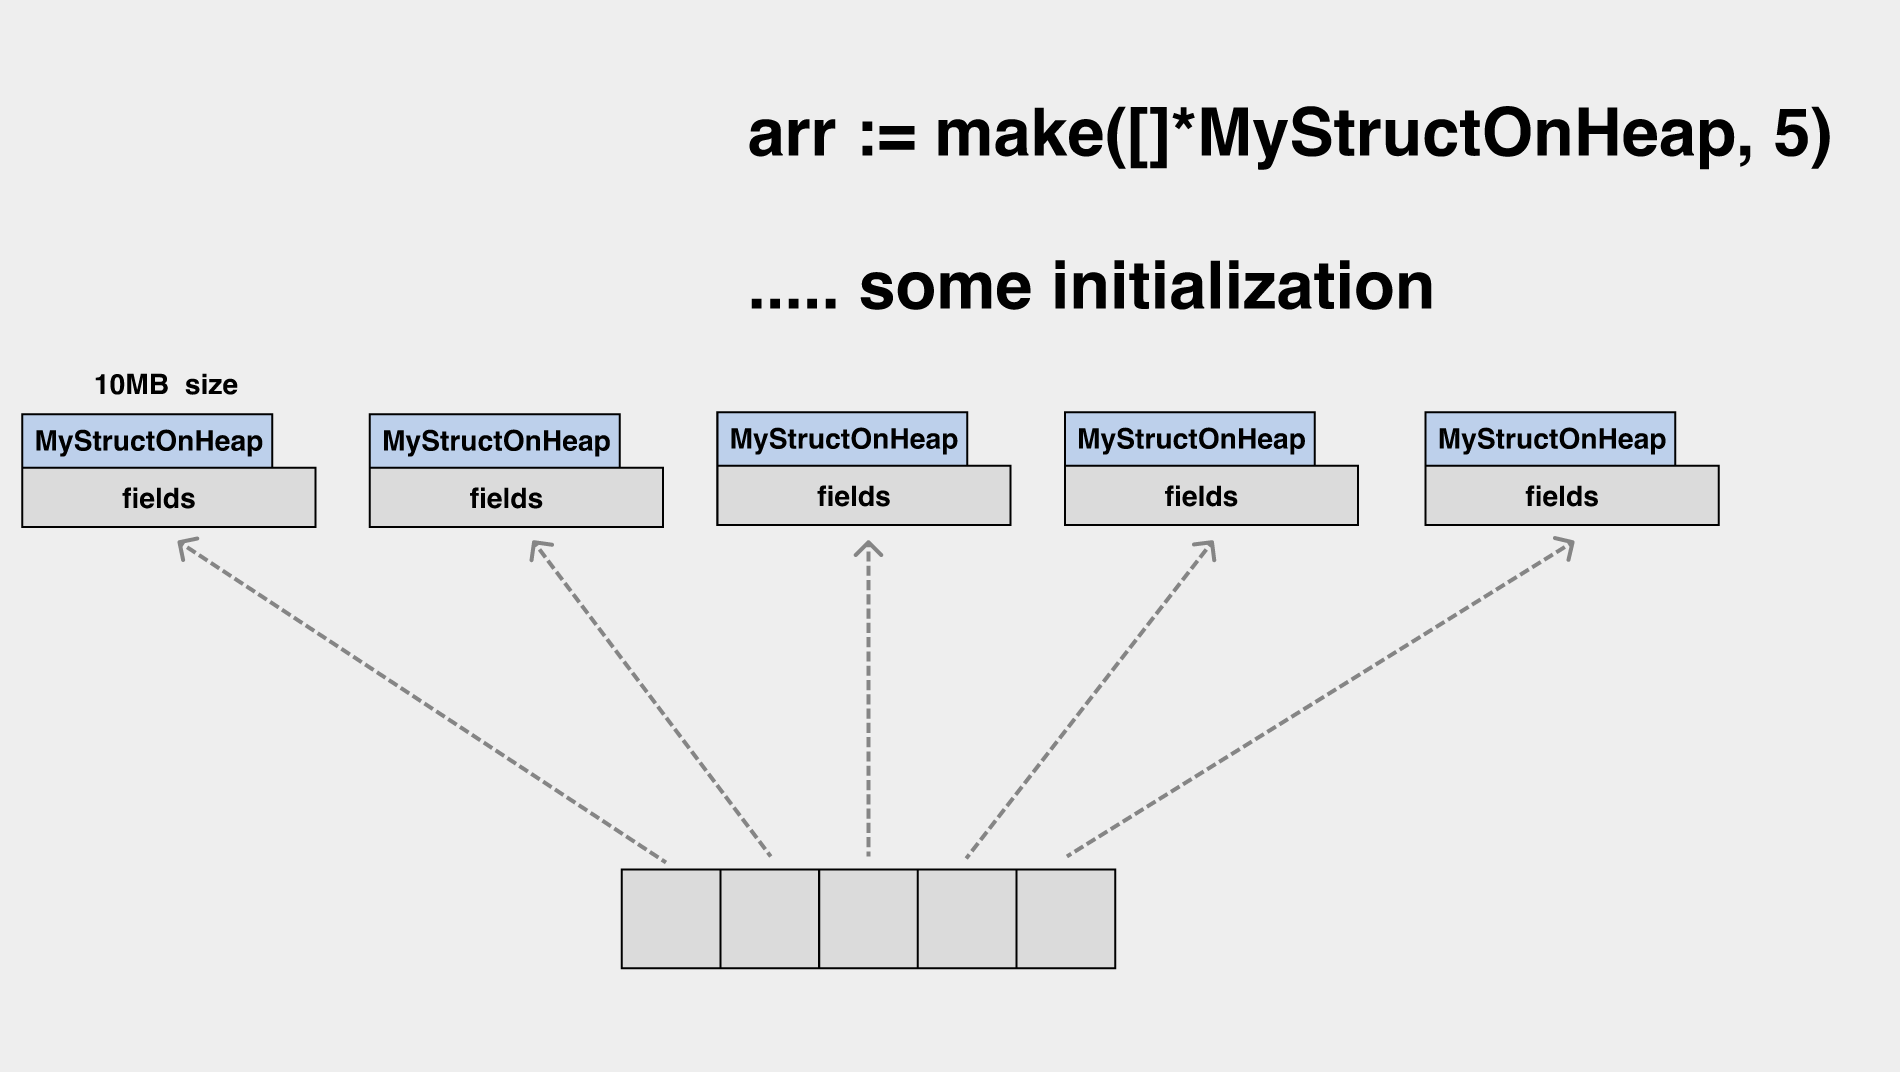
We initialize a slice, the elements of which are pointers, each pointing to an object on the heap of 10MB in size.
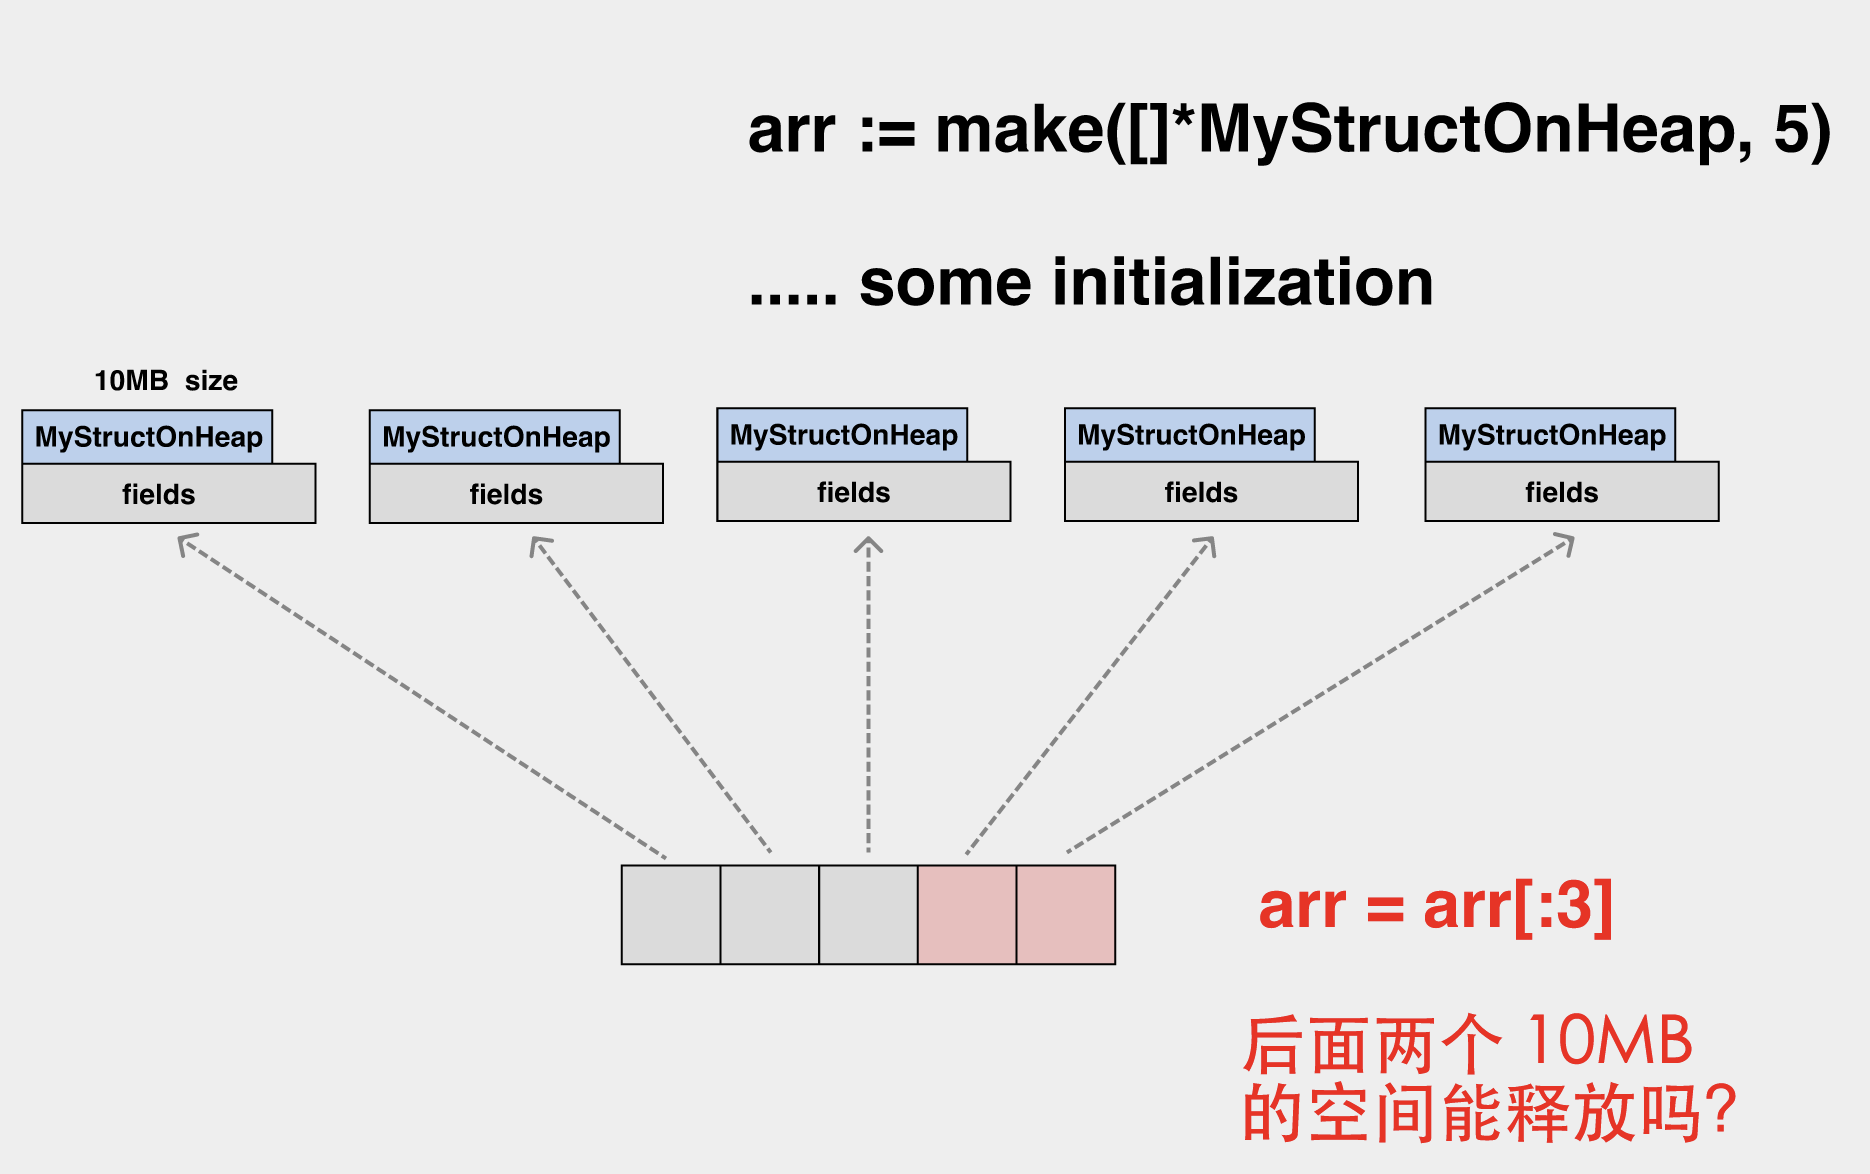
When this slice is shrunk, the last two elements of the underlying array are no longer accessible, but their associated heap memory is still unfree.
In a similar scenario, you may need to set the array elements to nil before scaling.
syntactic garbage.
Syntactic garbage is about those objects that are syntactically unreachable, and these are the main targets of the garbage collector.
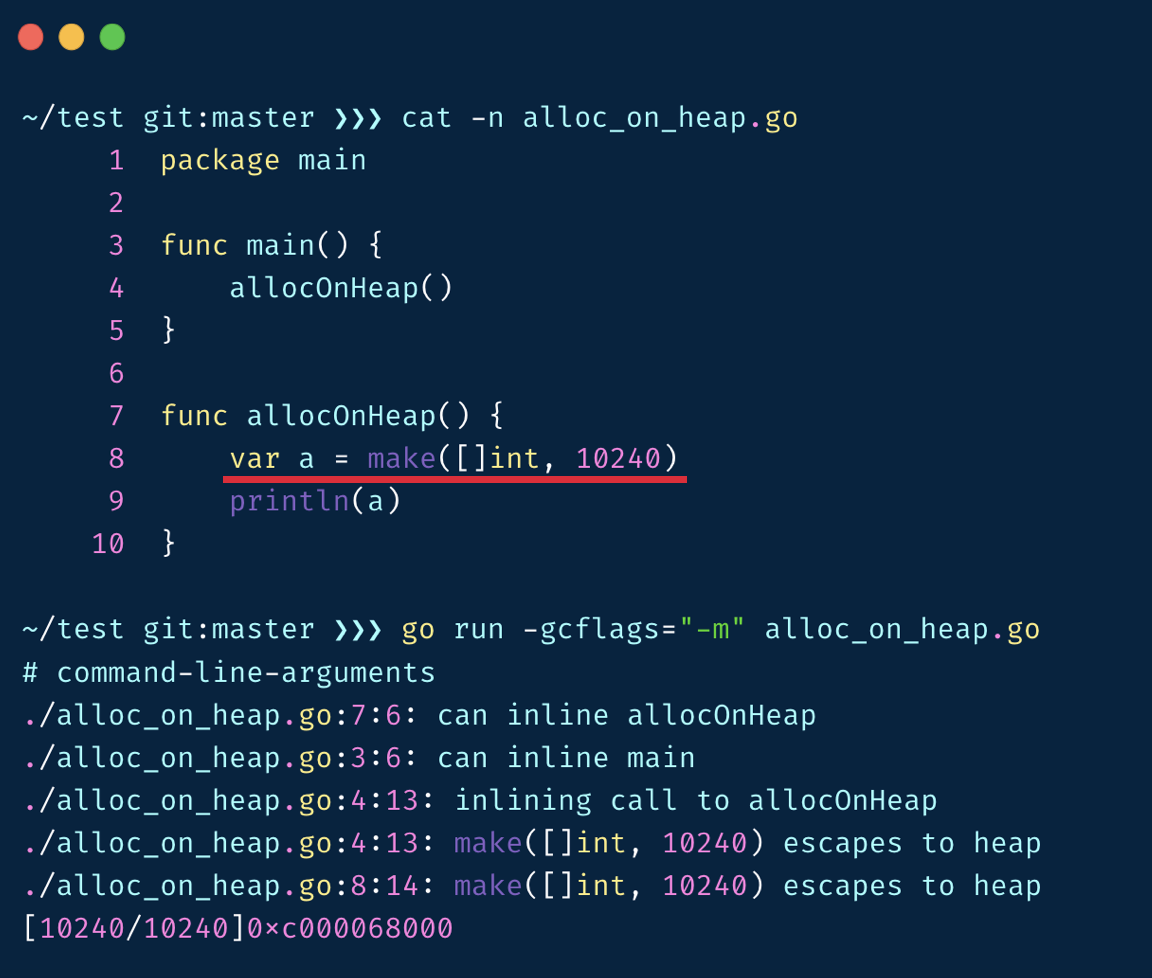
After allocOnHeap returns, a on the heap is inaccessible and becomes syntactic garbage.
GC Flow
Almost every iteration of Go optimizes the GC.
After many optimizations, the newer GC flow is as follows.
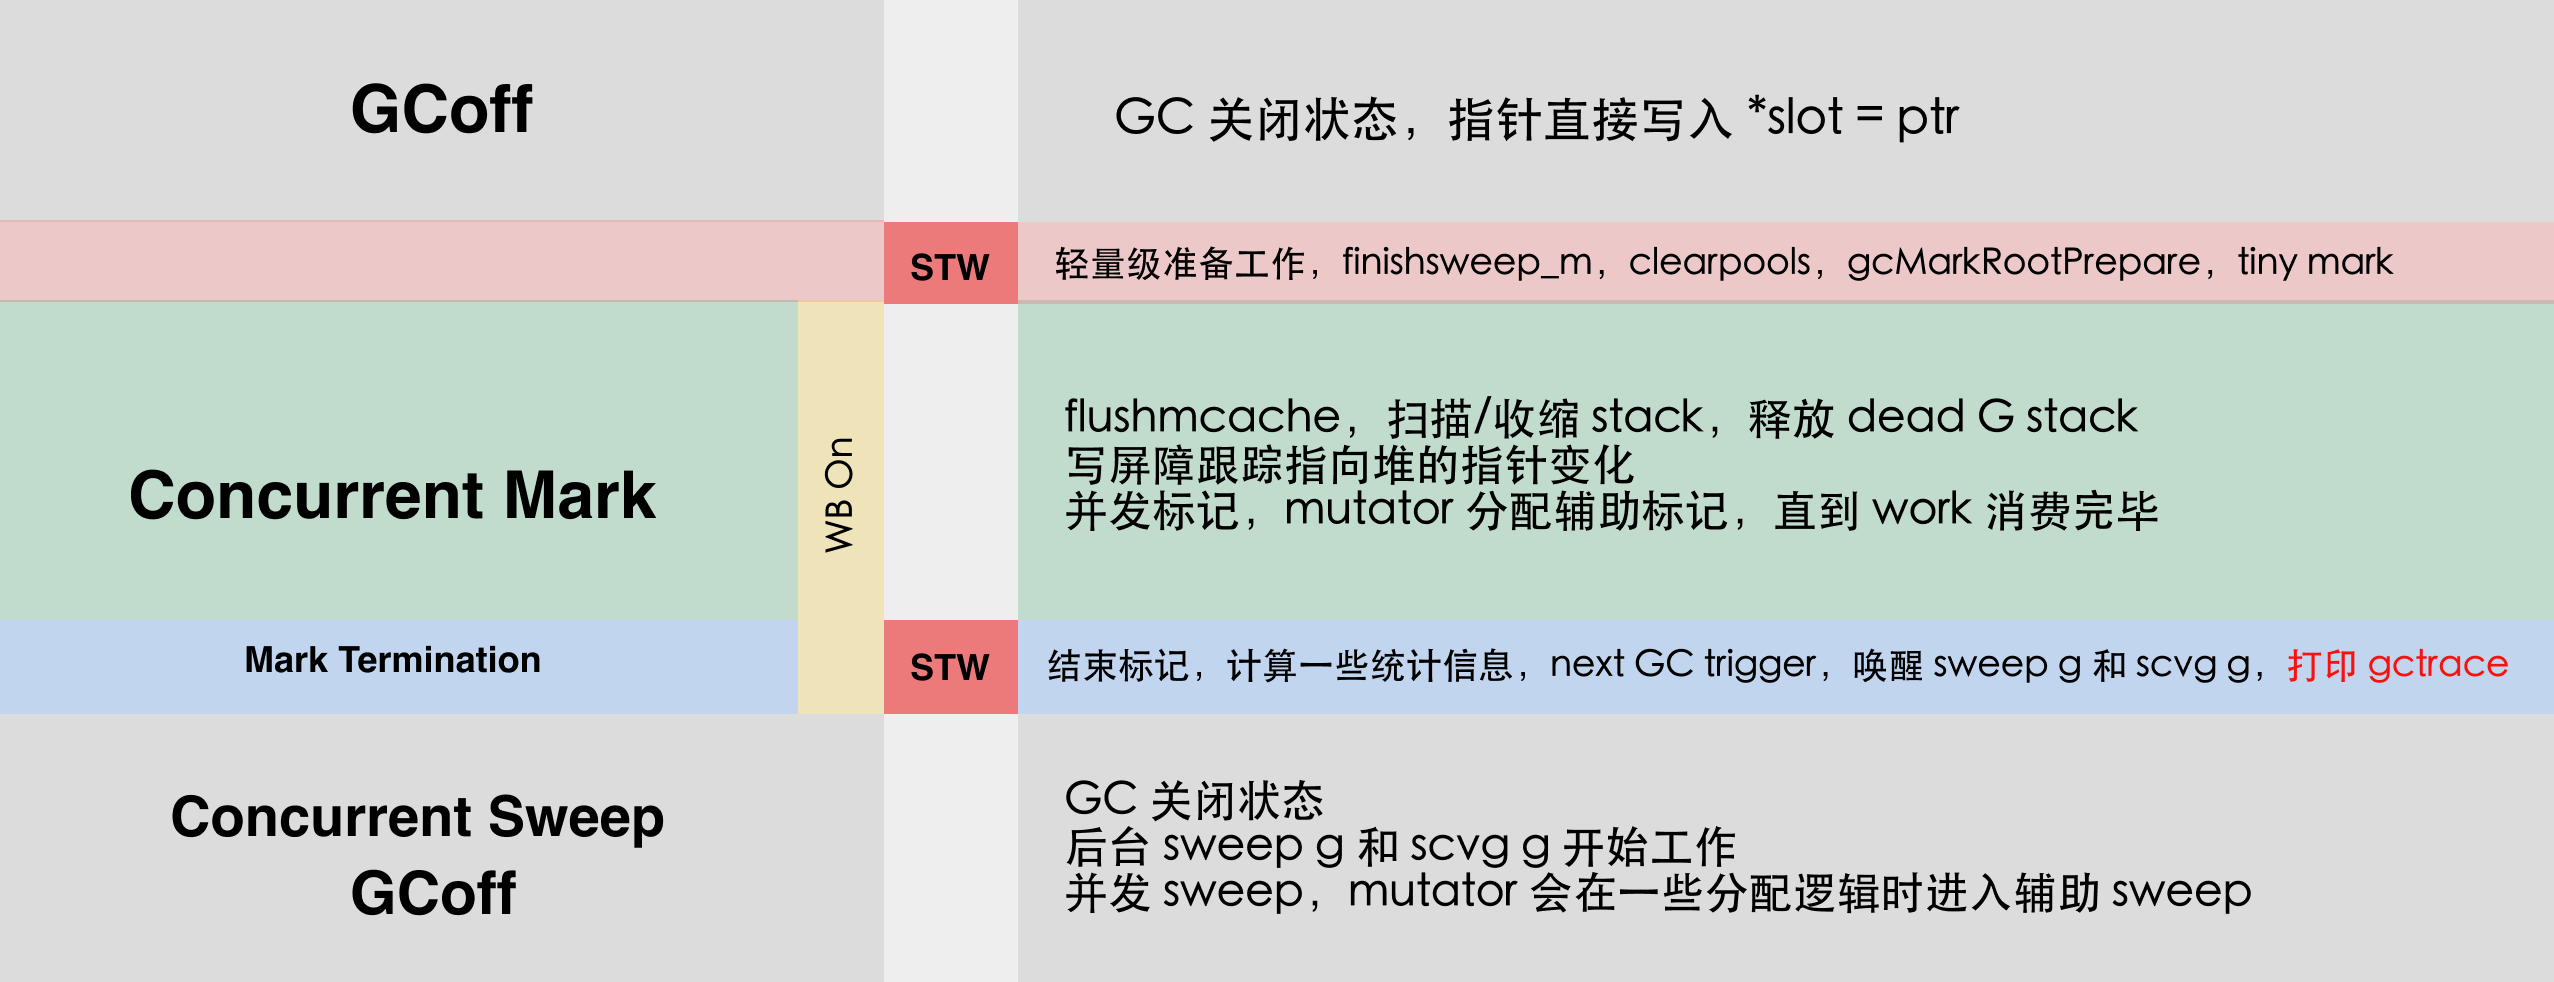
There are two brief stw before the start of concurrent tagging and when concurrent tagging terminates. This stw can be observed using pprof’s pauseNs or captured directly into the monitoring system.
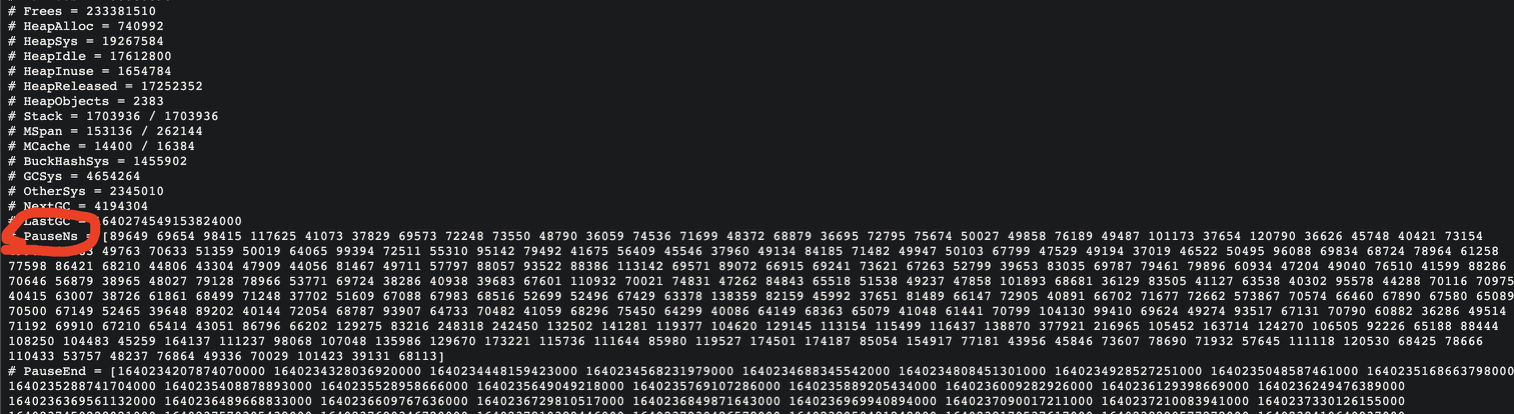
pauseNs is the duration of each stw.
Despite the official claim that Go’s stw is already sub-millisecond, we still see millisecond stw in high stress systems.
Markup flow
The Go language uses a three-color abstraction as its implementation of concurrent tagging, starting with an understanding of the three color abstractions.
- Black: has been scanned and the child nodes have been scanned. (gcmarkbits = 1 and is outside the queue)
- Gray: already scanned, child nodes not scanned. (gcmarkbits = 1, and inside the queue)
- White: not scanned, collector does not know any relevant information.
The main purpose of the three-color abstraction is to enable the garbage collection process to be executed concurrently with the application process, so that the object scanning process can be split into multiple stages without the need to complete the entire scanning process at once.
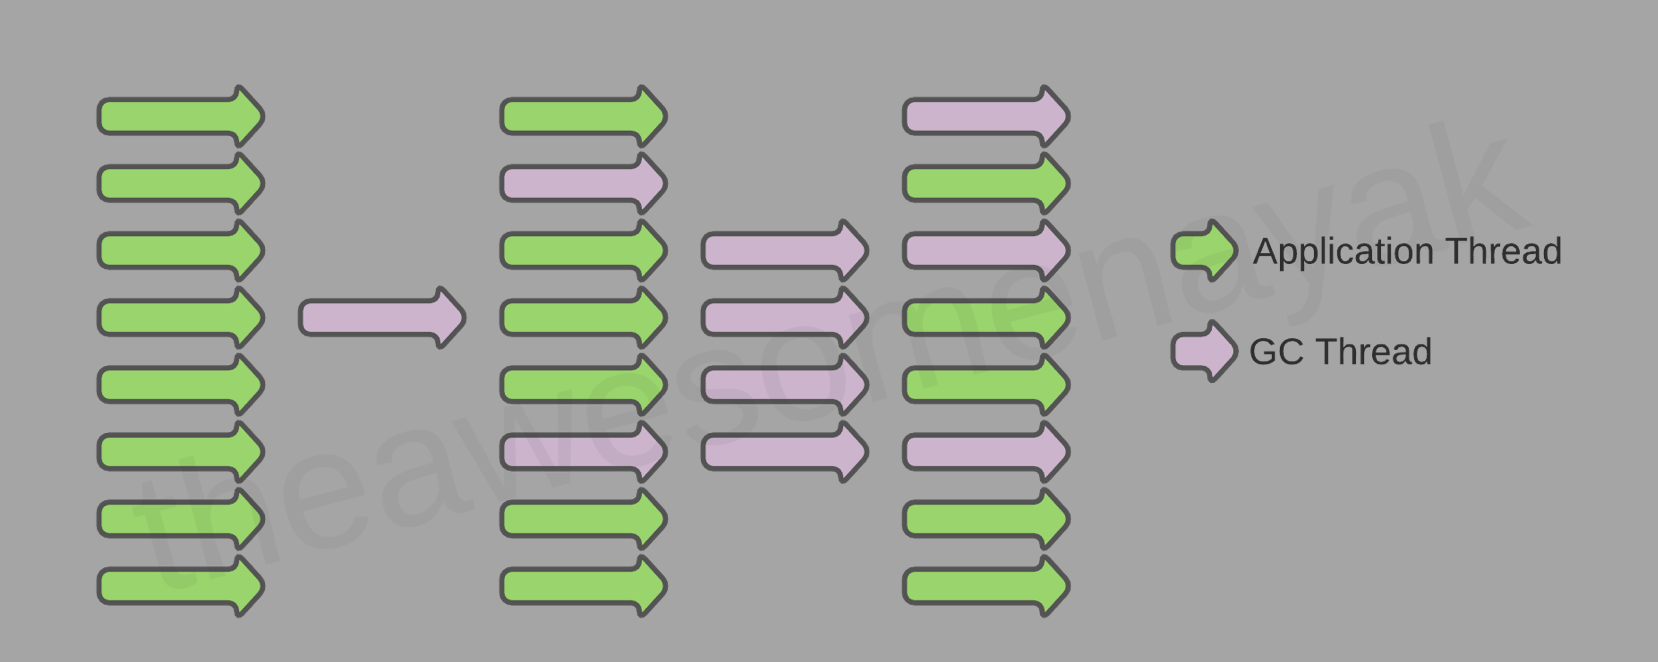
GC threads and application threads are executed concurrently in most cases.
The starting point of the GC scan is the root object, ignoring those unimportant (finalizer-related first omitted), the common root object can be seen in the following figure.
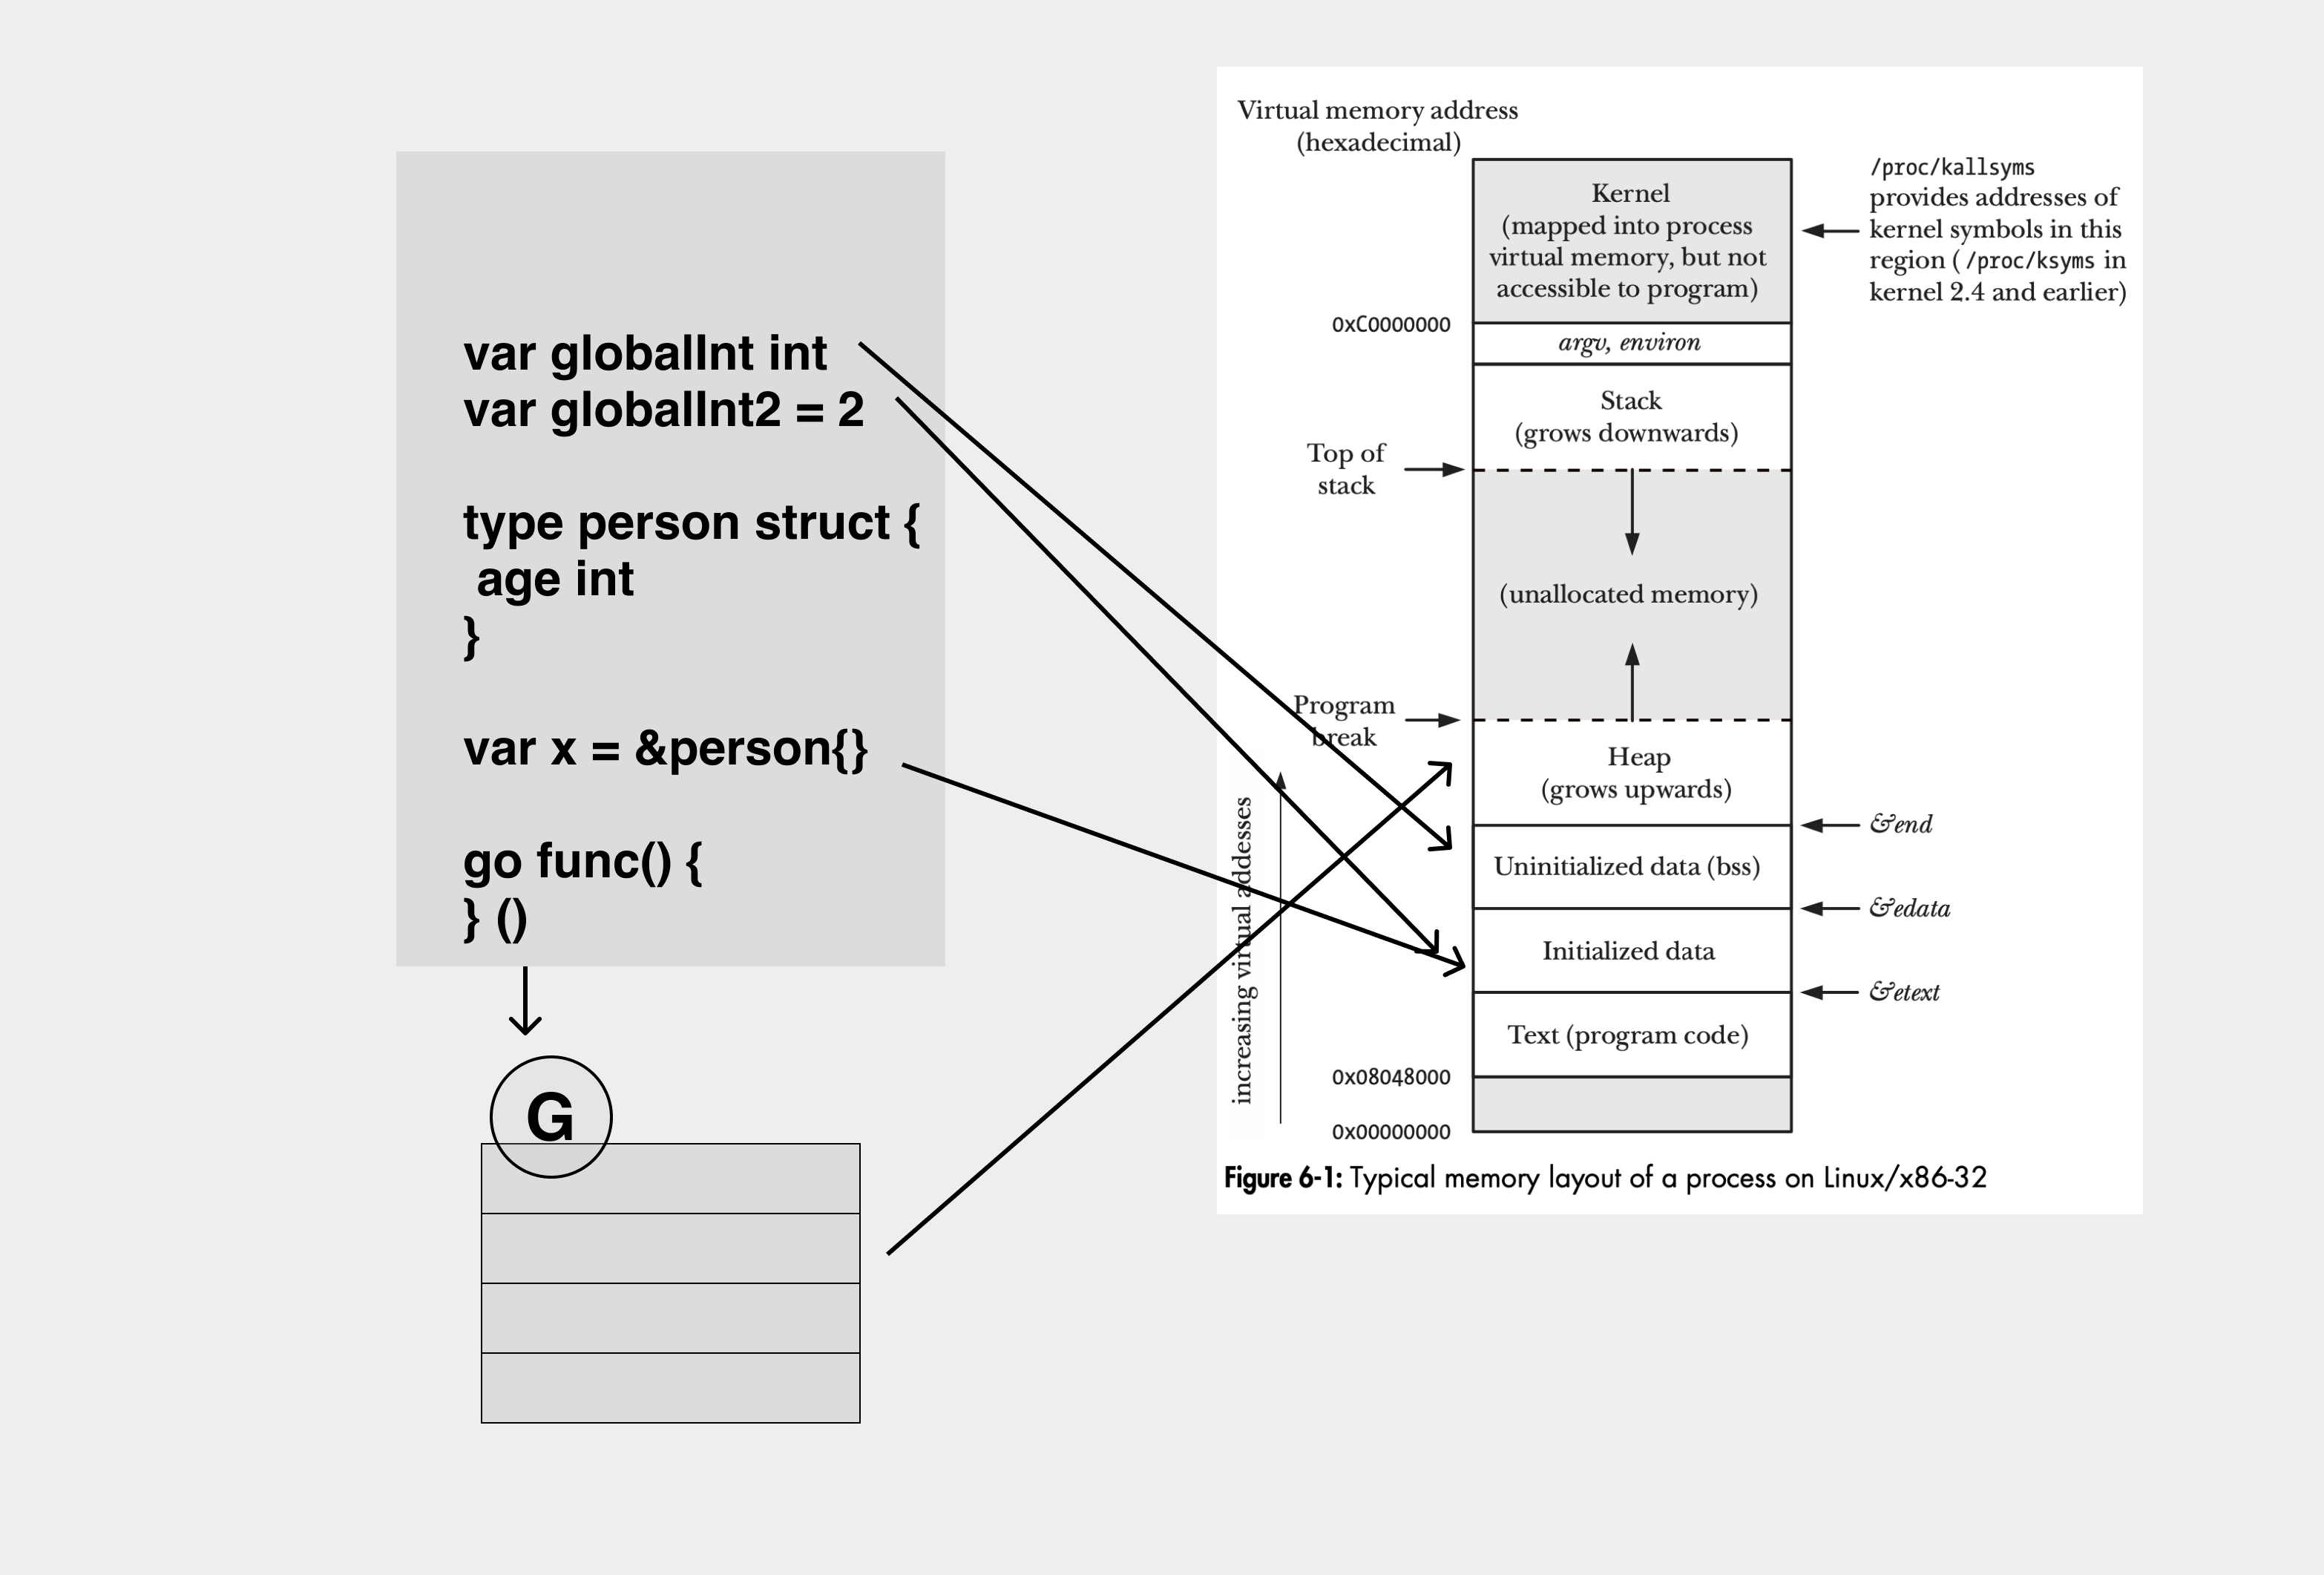
So in Go, scanning from the root means scanning from the .bss segment, the .data segment, and the goroutine’s stack, eventually traversing the entire object tree on the heap.
The marking process is a breadth-first traversal process that scans nodes, pushes the nodes’ children into the task queue, and then recursively scans the children’s children until all the work queues are emptied.
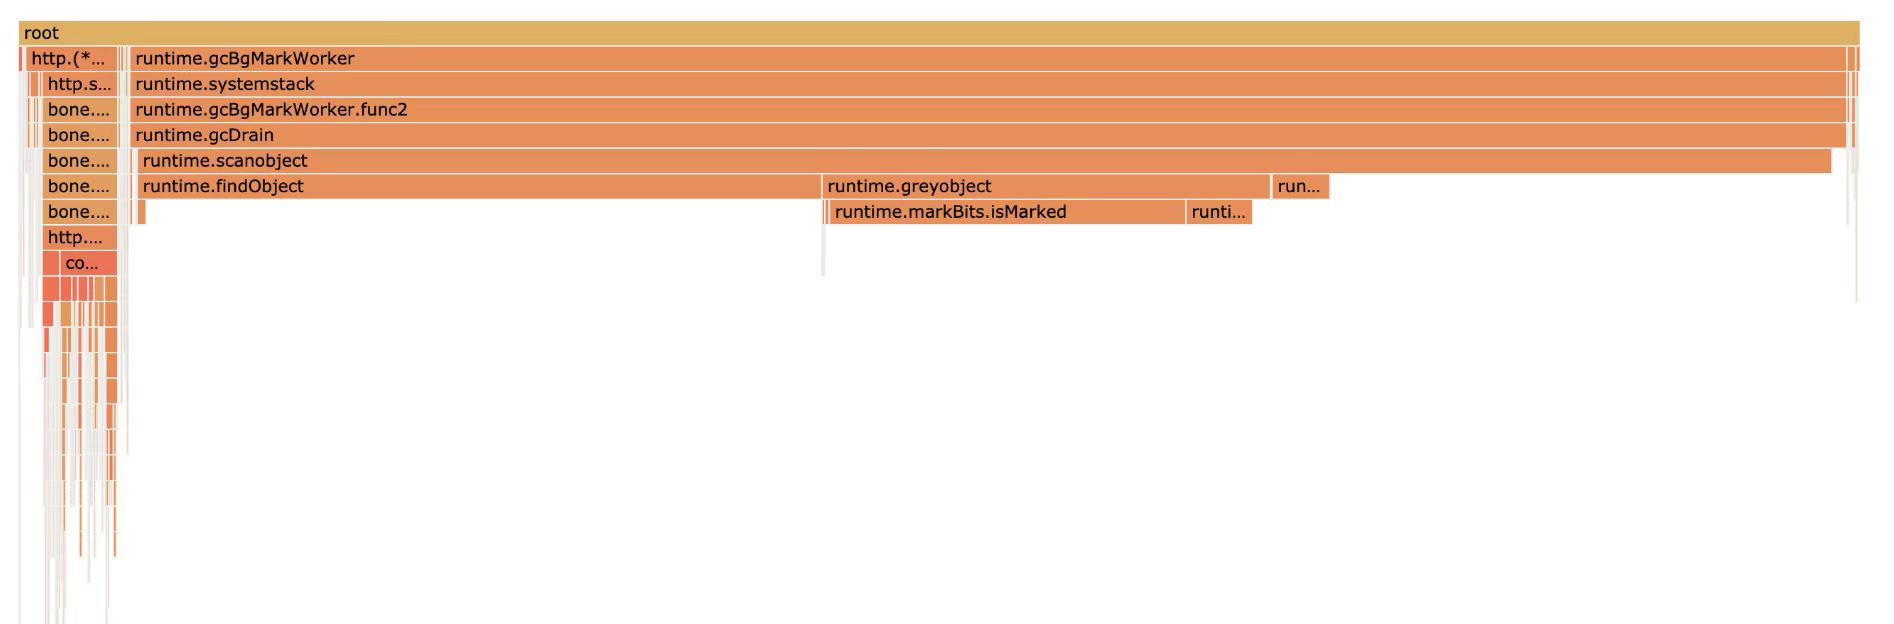
The process of marking workers in the background.
The mark phase marks the white object and advances it into the queue as a gray object. We can see the exact process of scanobject.
A mark worker in the background performs an object scan and pushes ptr to the work queue.
During the mark process, the gc mark worker will pop objects from the work queue (gcw) while pushing its child objects to the work queue (gcw), and if the work queue is full, it will have to transfer some of the elements to the global queue.
We know that objects on the heap are essentially graphs and will store references when they cross each other, and there is simple pruning logic in the marking process.
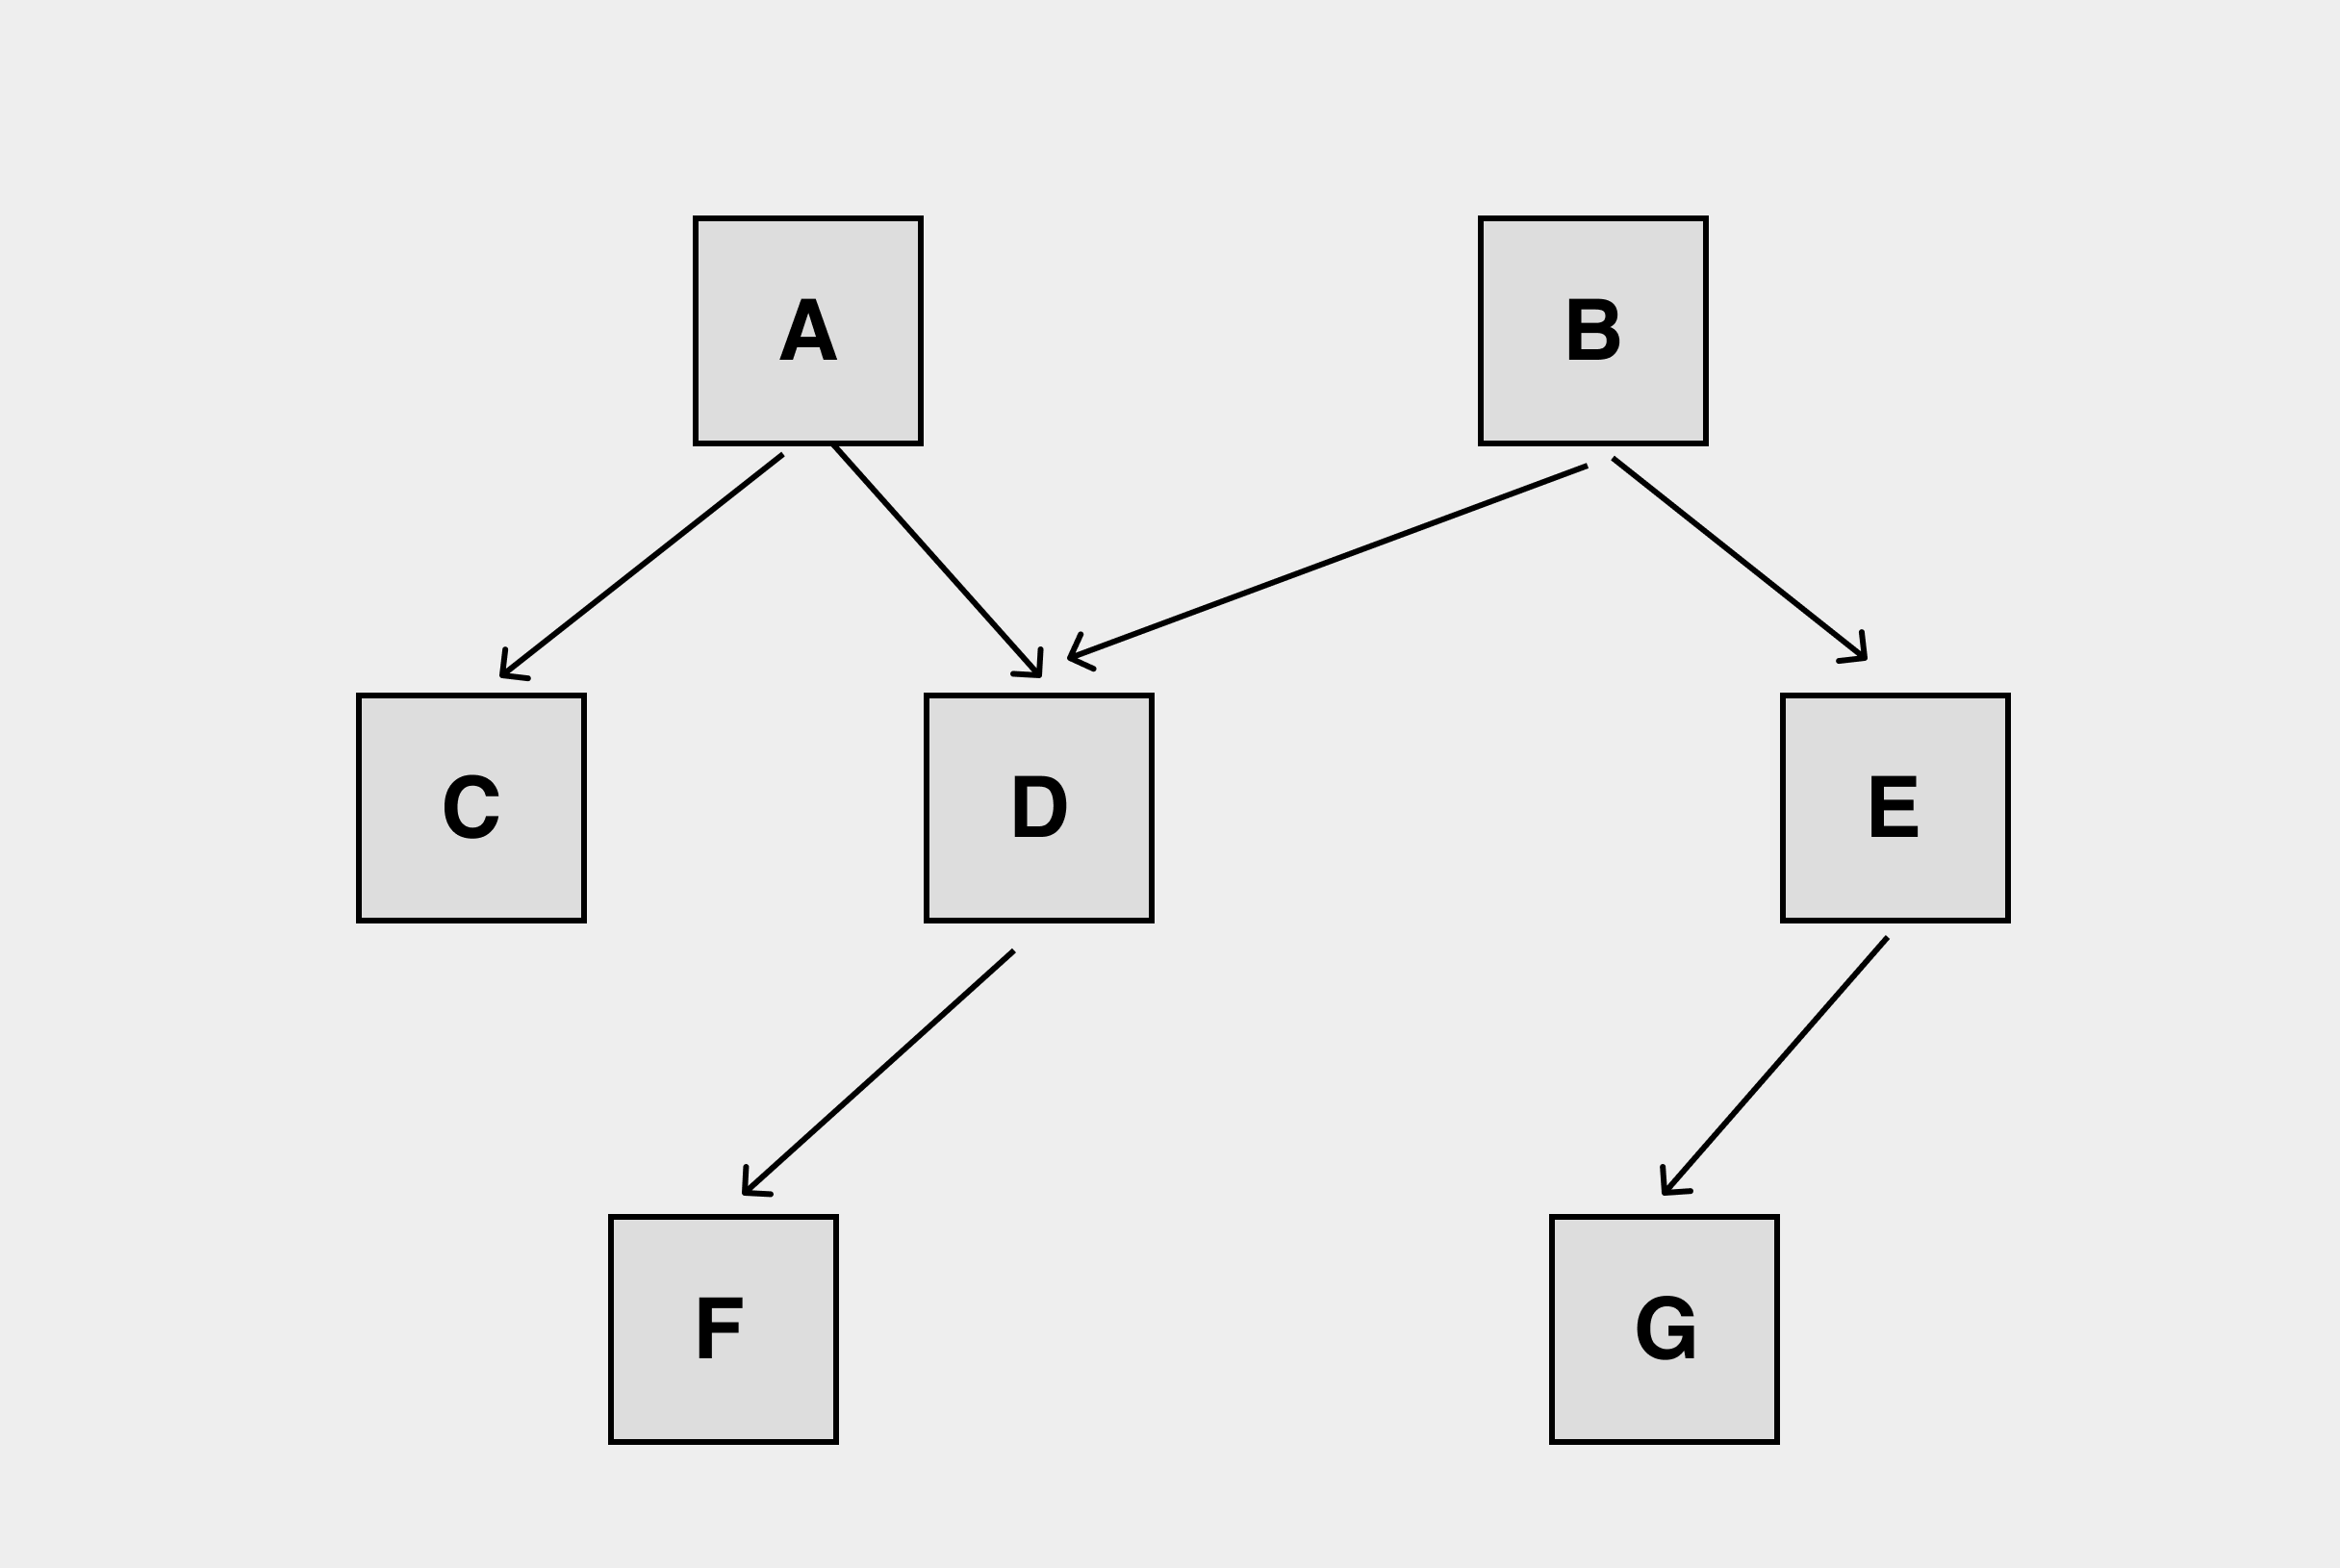
D is a common child of A and B. It will naturally reduce branches during the marking process to prevent wasting computational resources by repeated marking.
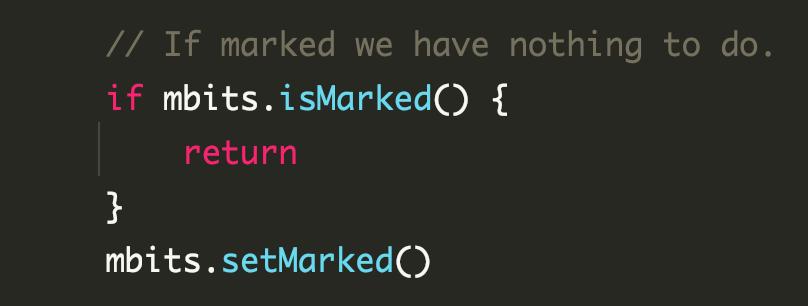
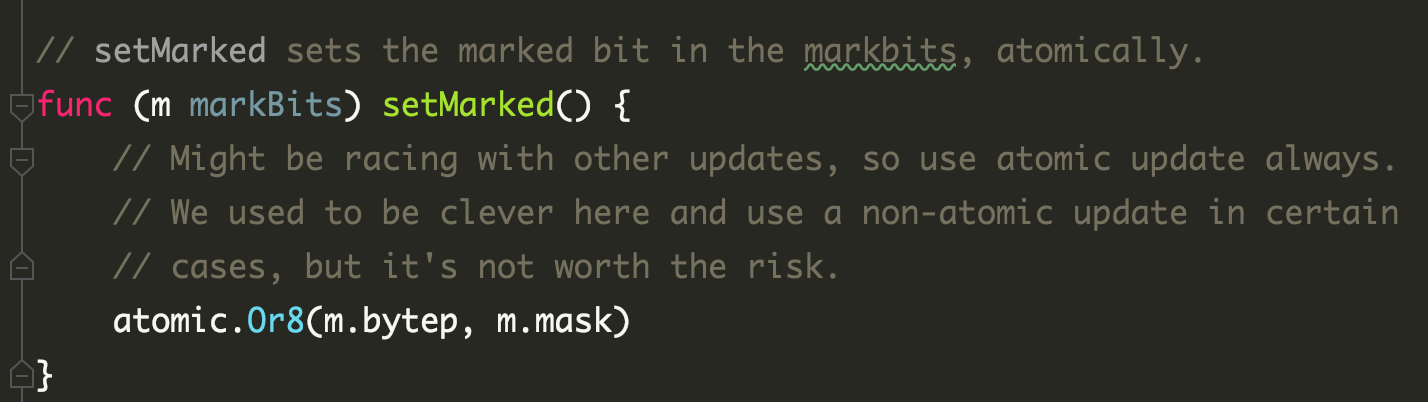
If multiple background mark workers do generate concurrency, the marker uses atomic.Or8, which is also concurrency-safe.
Assist marker
When the application allocates memory too fast, the mark worker in the background cannot finish the marking work in time, and then the application itself needs to do heap memory allocation, it will determine whether it needs to assist the GC marking process appropriately to prevent the application from OOM due to the fast allocation.
When this happens, we will see the corresponding call stack for assisting the marker in the flame chart.
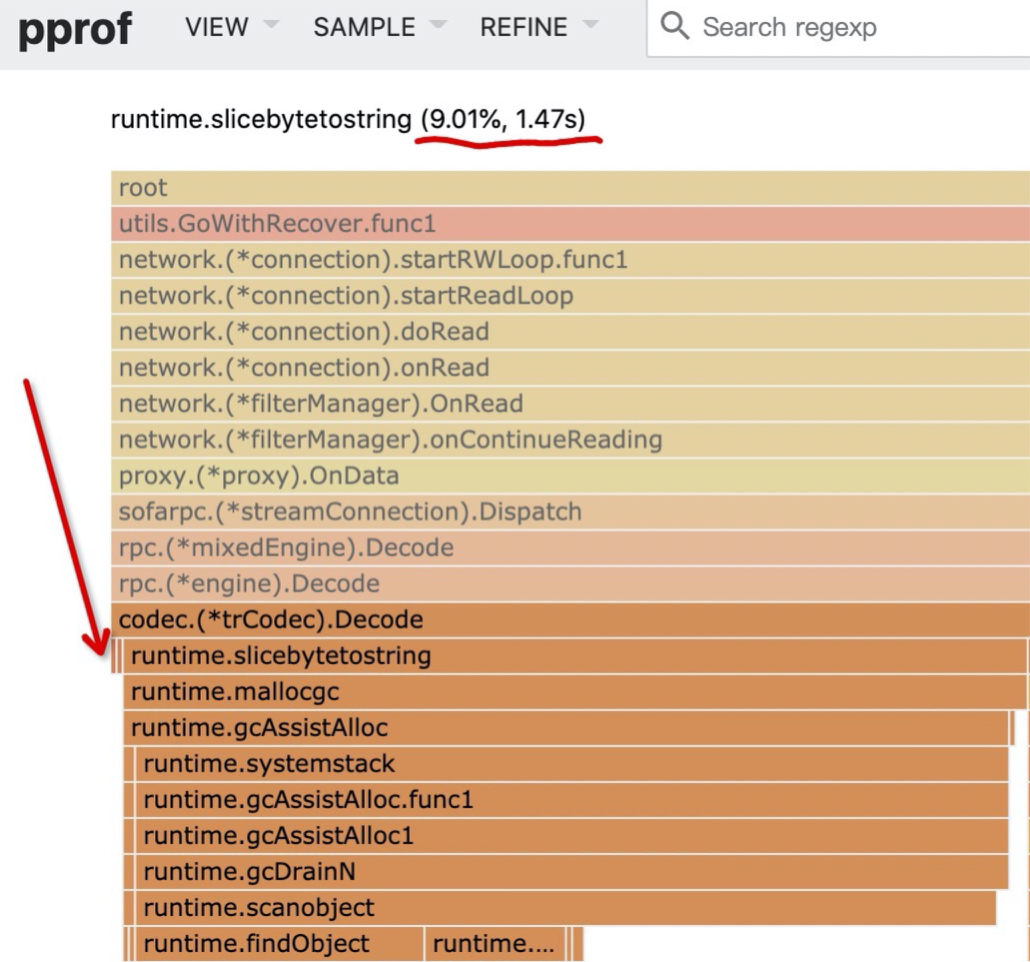
Assisted tagging can have an impact on the response latency of the application and can be optimized by trying to reduce the number of objects allocated to the application.
Go implements the assisted tagging process internally through a bookkeeping repayment system, which is not the focus of this article, so I’ll skip it for now.
Object Loss Problem
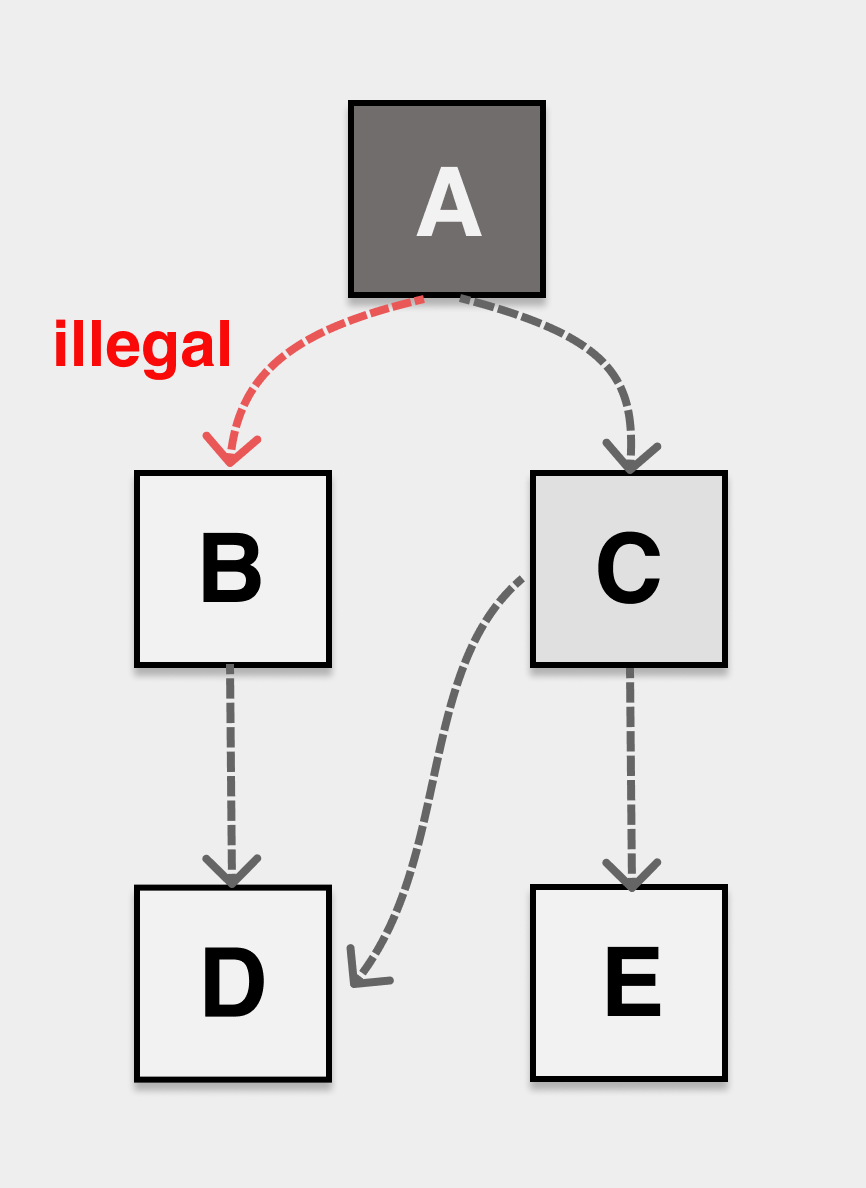
As mentioned earlier, the GC thread/co-process is executed concurrently with the application thread/co-process, and the application will also keep modifying the reference relationship of objects on the heap during the GC tagging worker’s work. The following is a typical case when the application and GC are executed concurrently, and the object is mistakenly reclaimed by GC due to the application’s change of the pointer that causes the object to miss tagging.
As shown in the figure, during the GC tagging process, the application dynamically modifies the pointers of A and C so that the internal pointer of object A points to B and the internal pointer of C points to D. If the tagging process does not sense this change, eventually object B is white after the tagging is completed and will be incorrectly recognized as memory garbage and reclaimed.
In order to solve the problem of missing markers and wrong markers, we first need to define “tricolor invariant”, if the reference relationship of objects on our heap can meet tricolor invariant no matter how to modify, then no object loss problem will occur.
Strong tricolor invariant (strong tricolor invariant), prohibit black objects pointing to white objects.
Weak tricolor invariant (weak tricolor invariant), black objects can point to white objects, but the white objects pointed to must have paths that can be reached from the gray objects.
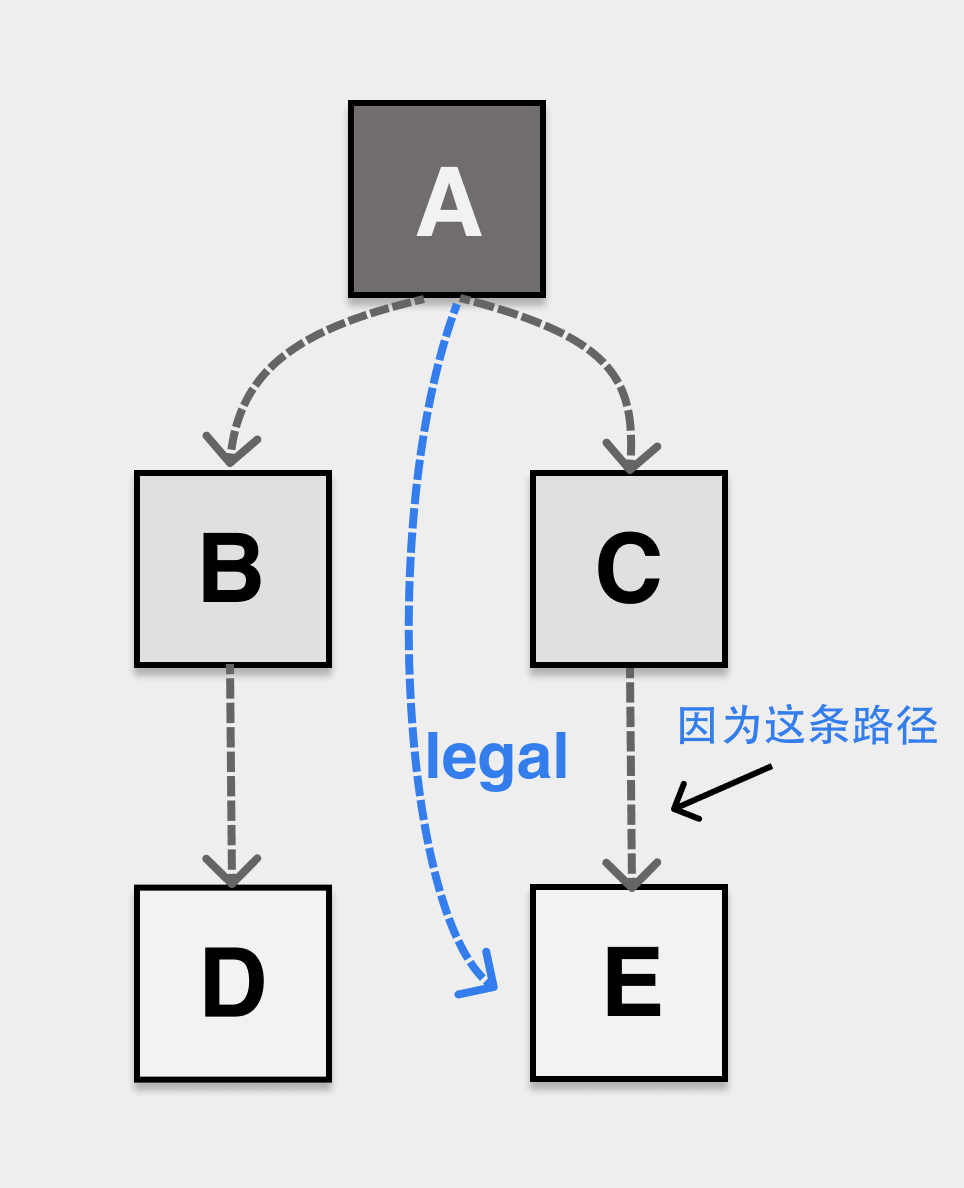
No matter how the application modifies the relationship of objects on the heap during concurrent execution with GC, as long as the objects on the heap can satisfy any one of the invariants after the modification, no object loss problem will occur.
The implementation of strong/weak tricolor invariants requires the introduction of a barrier technique. In Go language, write barrier is used to solve the above problem.
write barrier
barrier is essentially : snippet of code insert before pointer modify.
There is also a memory barrier in the concurrent programming world, but its meaning is completely different from the GC world, so be careful not to get confused when reading the material.
The Go language GC has a write barrier, not a read barrier.
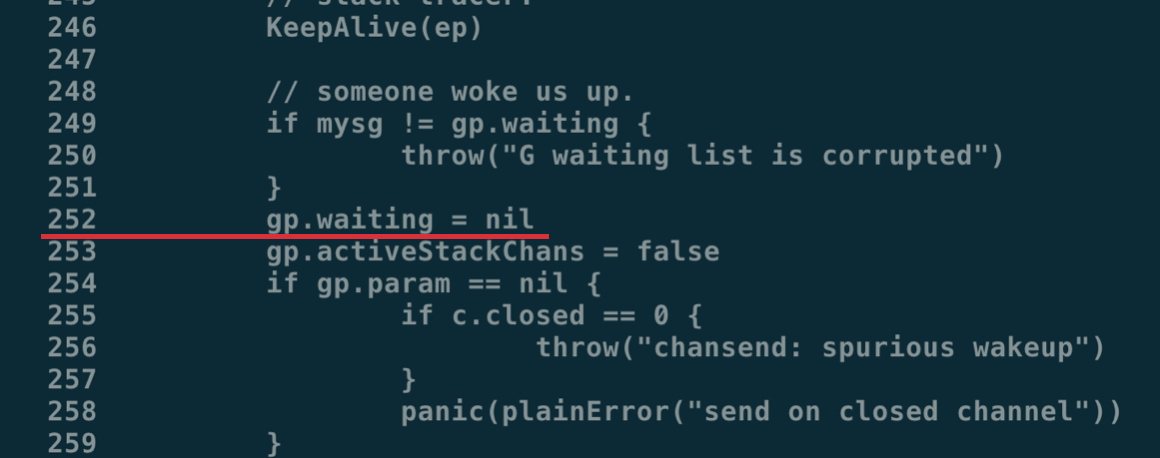
The global variable runtime.writeBarrier.enabled is changed to true during the stw phase before the application enters the GC marking phase, and all heap pointer modification operations are then additionally called to runtime.gcWriteBarrier before they are modified.
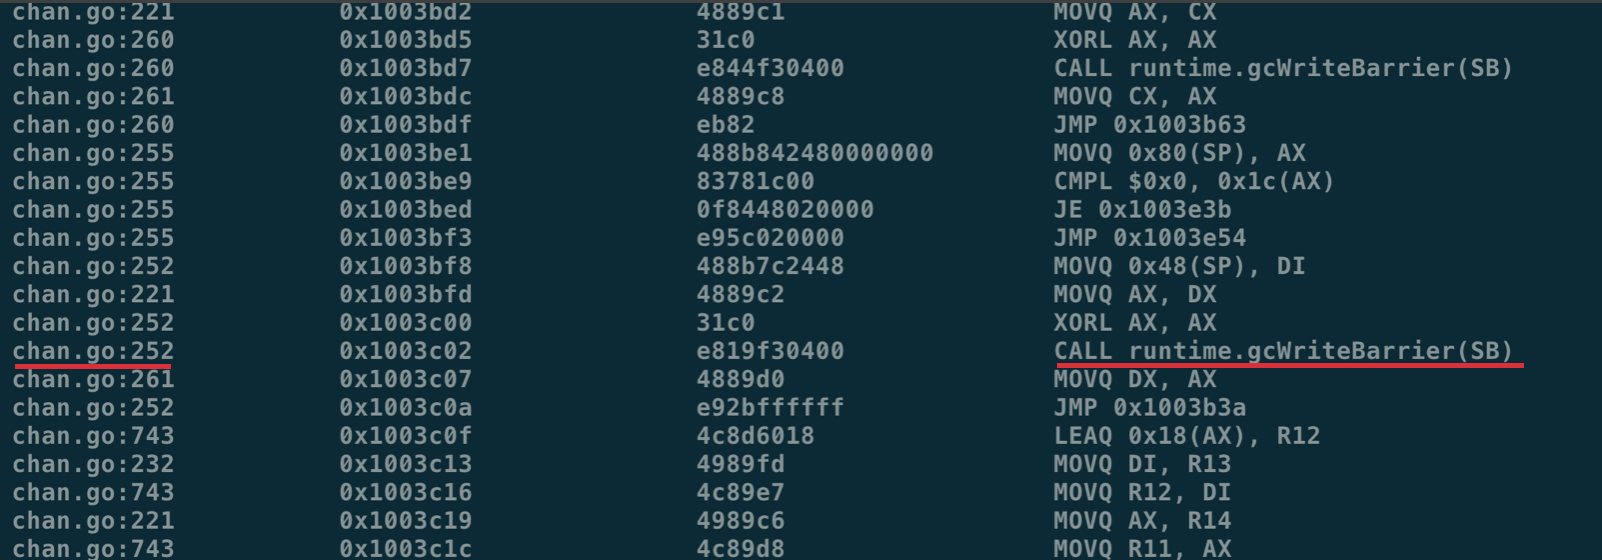
In the disassembly result, we can find the original code location by the number of lines.
There are two common write barriers.
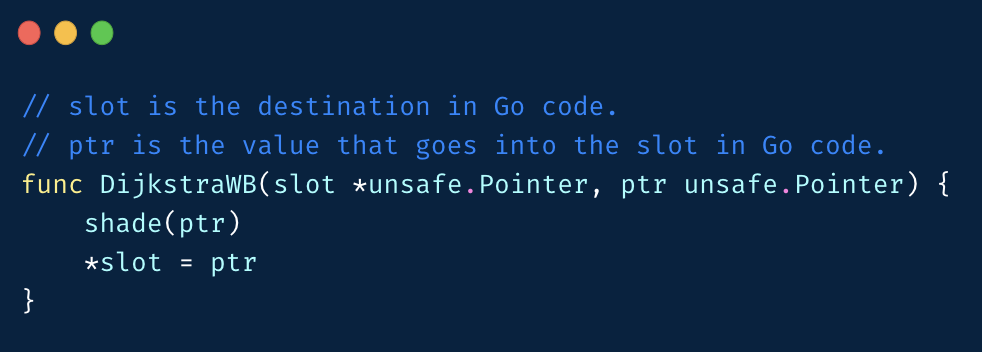
-
Dijistra Insertion Barrier, where the new object pointed to is marked gray when the pointer is modified.
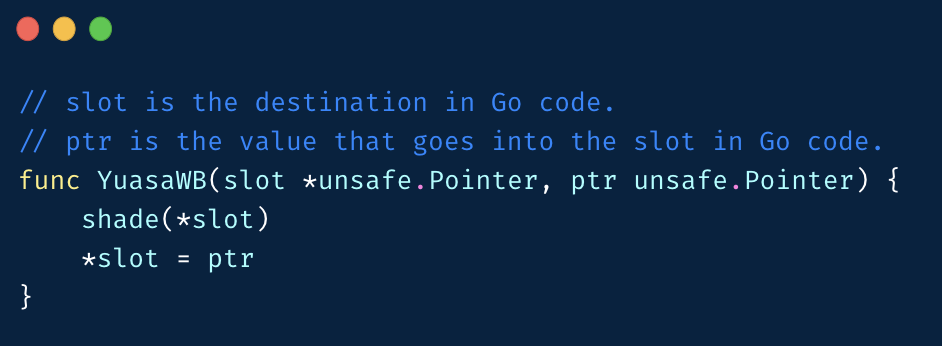
-
Yuasa Deletion Barrier, when the pointer is modified, the object pointed to before the modification is to be grayed out.
Go’s write barrier is a mix of both of these barriers.
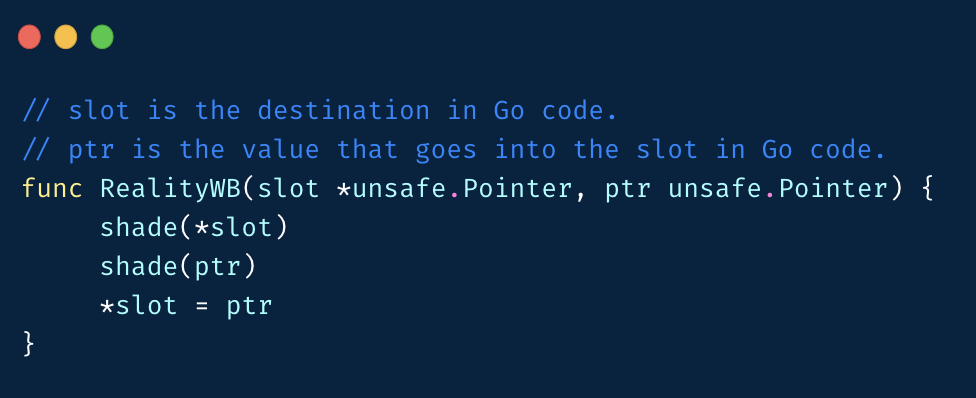
This does not match the Go language’s implementation of the proposal for the hybrid barrier. This is how the proposal was originally written.
But the cost of color determination on the stack is very high, so the official choice is still a simpler implementation, i.e. an implementation where both old and new objects with broken pointers are marked gray.
If all objects in Go are allocated on the heap, theoretically we can achieve strong/weak tricolor invariance by choosing any of Dijistra or Yuasa, why do it so complicated?
Because in Go language, objects on the stack are not turned on the write barrier even during the mark execution phase due to too frequent object operations on the stack. If we use only Dijistra or only Yuasa Barrier, we will have the problem of object loss:.
- Object loss problem of Dijistra Insertion Barrier.
- The object loss problem of Yuasa Deletion Barrier.
Earlier Go used only Dijistra barriers, but because of the aforementioned object loss problem, a stack rescan was required on the second stw cycle. When the number of goroutines is high, this results in a long stw time.
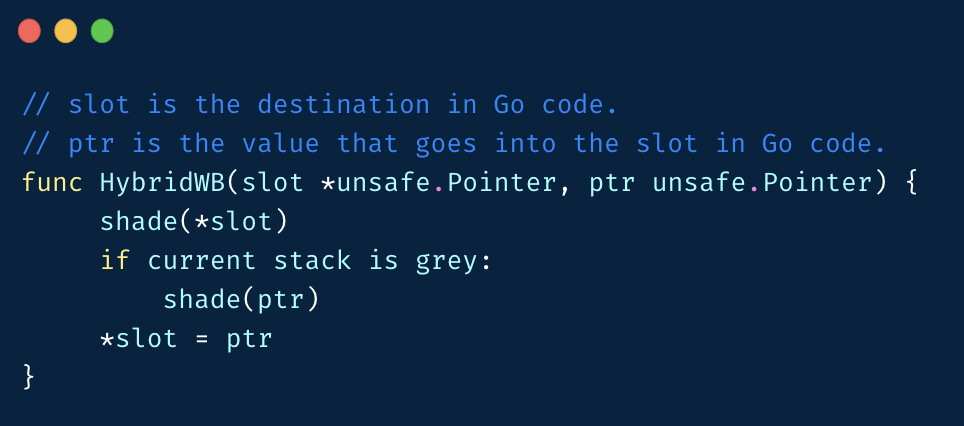
To eliminate stack rescan, but either barrier alone cannot satisfy Go’s requirements, so the latest version of Go’s hybrid barrier is actually Dijistra Insertion Barrier + Yuasa Deletion Barrier.
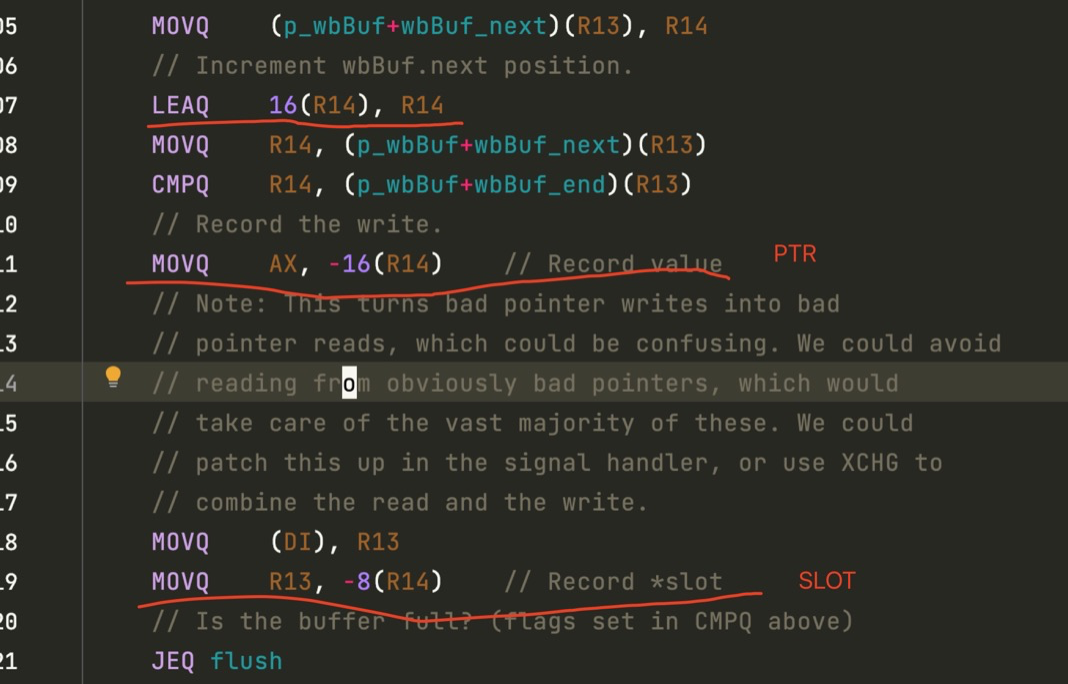
The hybrid write barrier pushes two pointers to the wbBuf structure of p. Let’s take a look at this process.

Now we can see the complete process of the mutator and the mark worker in the background during concurrent execution.
Recycle process
Compared to the complex tagging process, object recycling and memory release is much simpler.
The process starts with two special goroutines.
- One is called sweep.g, which is mainly responsible for cleaning up dead objects and merging related free pages.
- One is called scvg.g, which is mainly responsible for returning memory to the operating system.
|
|
Note the GC sweep wait and GC scavenge wait here, which are the two goroutines.
When the GC marking process is finished, the sweep goroutine is woken up to do the sweeping, which is actually a cycle of sweepone -> sweep. for each mspan, sweep.g does the job of replacing the bitmap used during allocation with the bitmap generated during marking.

The destination of the mspan is then determined based on the slots in the mspan.
- If the number of alive objects in the mspan = 0, i.e. all elements become memory garbage, then execute freeSpan -> return the pages used by the constituent mspan and update the global page allocator summary information
- If there are no empty slots in the mspan, all objects are alive, put them into the fullSwept queue
- If there are empty slots in the mspan, the mspan can still be used for memory allocation, put it in the partialSweep queue
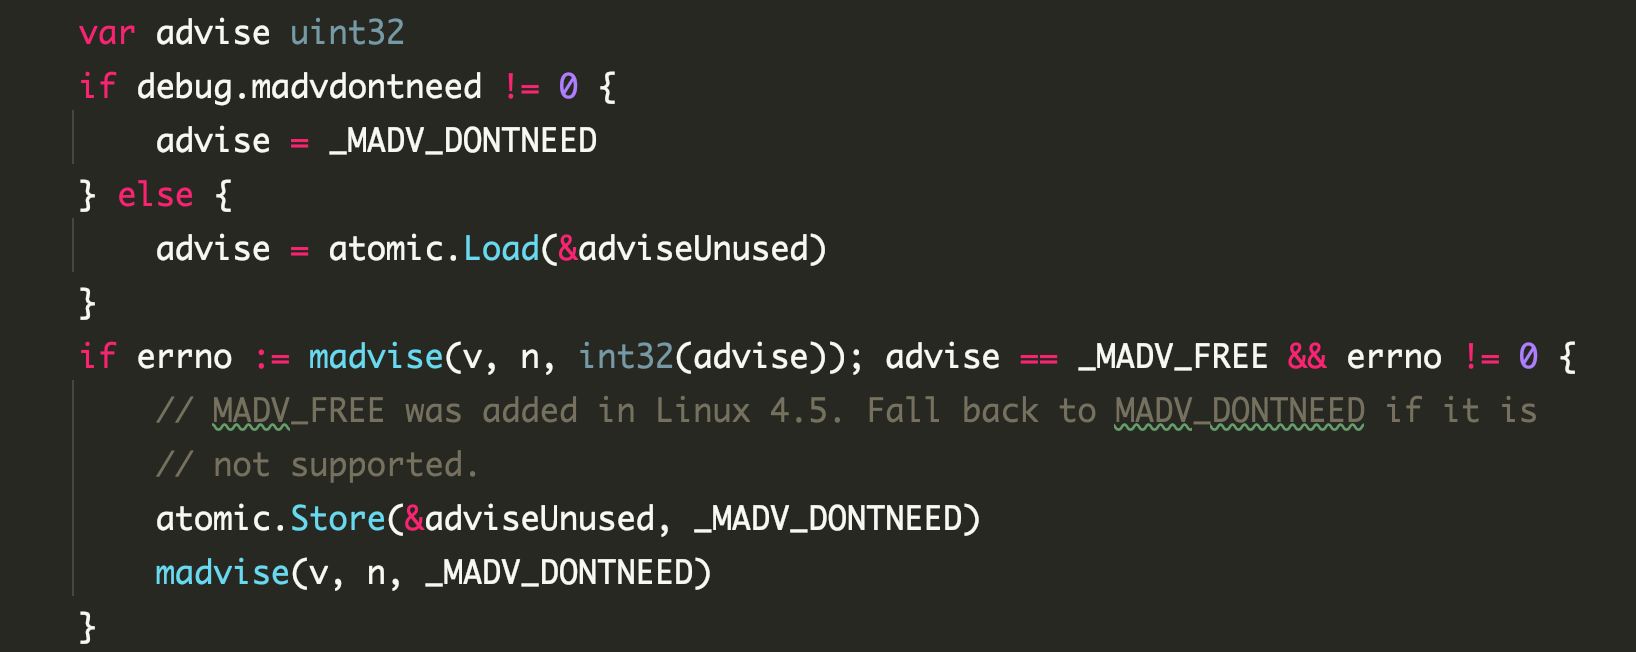
After that the “scavenger” is woken up and executes a linear process that runs all the way to return the page memory to the OS.
- bgscavenge -> pageAlloc.scavenge -> pageAlloc.scavengeOne -> pageAlloc.scavengeRangeLocked -> sysUnused -> madvise
Problem Analysis
From the preceding basics, we can summarize the key points of garbage collection in Go language: the
- no generation separation
- Concurrency with application execution
- Assist in marking processes
- write barrier on concurrent execution
Because there is no generation, we need to find ways to reduce the cost of GC scans when we encounter scenarios where we need to keep tens of millions of kv maps in memory (e.g., machine learning feature systems).
Because of assisted markers, when the application’s GC occupies more than 25% of CPU, it will trigger a large number of assisted markers, which will affect the application’s latency, and it is also necessary to optimize the GC.
Pool can bring a good optimization effect for simple business, but if you encounter some complex business scenarios, you should also consider offheap and other GC cheating solutions, such as dgraph’s solution.
Since this article focuses on memory allocation and GC implementation, it will not be expanded.
All the memory management terms covered in this article can be found at: https://memorymanagement.org.
For the theory of garbage collection, we recommend reading: “gc handbook”, which can answer all your questions.