Thanks to the Go language’s excellent runtime scheduling system, developers can easily develop concurrent programs even if they have no experience in multi-threaded programming.

The core of the scheduling system is the design of the GMP, which should be seen by all readers who want to understand the Go language design in depth. However, when learning through blogs or source code, if you can’t combine it with real code, you may not understand it well enough.

This article introduces a way to visualize the Go runtime scheduling process by using the GODEBUG tool to run the actual code.

Scheduling in a Nutshell

First, let’s start with a brief review of the Go scheduling system by parsing the snapshot state through a schematic of the scheduling snapshot at a point in the program.

go Scheduling

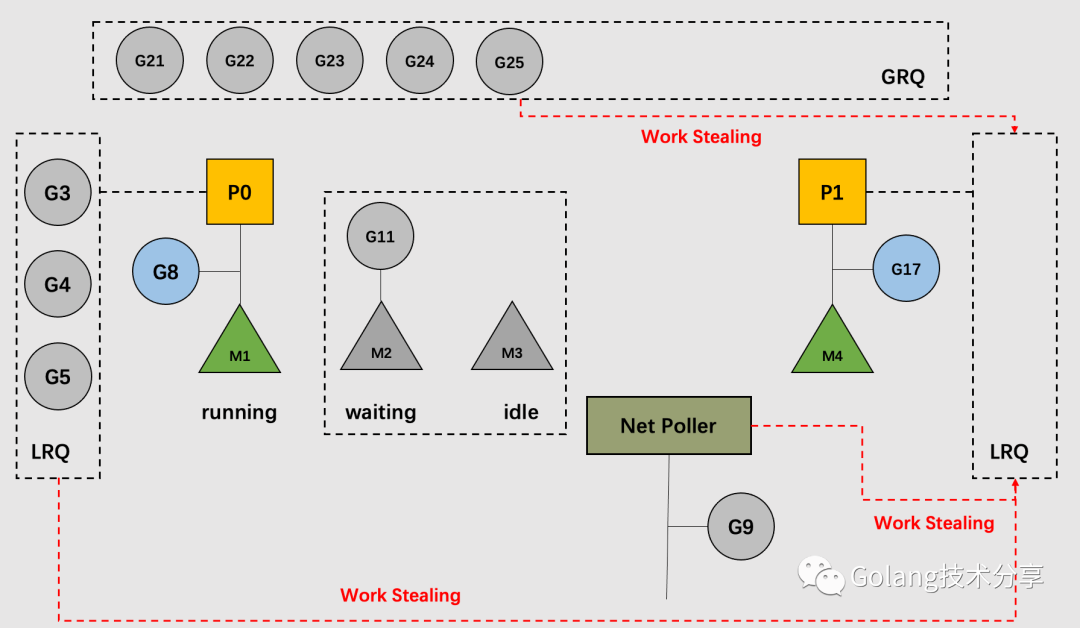
As shown above, we have set GOMAXPROCS=2, i.e. 2 processors.

At the current moment, P0 and P1 are hosting OS threads M1 and M4, which are executing code from G8 and G17, respectively; P0’s LRQ (Local Run Queue) has 3 Gs queued up, while P1’s LRQ has no waiting Gs; GRQ (Global Run Queue) has 5 Gs.

The network poller Net Poller has a G9 caught in an asynchronous network call; M2 is blocking due to some synchronous system call from G11; M3 is idle and ready to be used when M1 or M4 is blocked.

Since P1’s LRQ has no more waiting G, when G17 is scheduled, it will perform Wrok Stealing, with stealing sources from other processors P’s LRQ (in this case P1’s LRQ), GRQ and Net Poller, as specified in the runtime.schedule() function.

GODEBUG Tool

Enabling the GODEBUG utility is as simple as setting the environment variable GODEBUG. It allows Go programs to output debugging information during runtime and to visualize details such as scheduler or garbage collection based on parameter configuration.

A detailed description of GODEBUG can be found in the source runtime/extern.go file.

In this article we are interested in debugging the scheduler, so we will only use the two parameters of GODEBUG, schedtrace and scheddetail.

  • schedtrace=n: sets the runtime to output a line of scheduler summary information every n milliseconds.
  • scheddetail: output more detailed scheduler information.

sample code

The sample code we use is as follows.

 1
 2
 3
 4
 5
 6
 7
 8
 9
10
11
12
13
14
15
16
17
18
19
20
21
22
23
package main

import (
 "sync"
)

var wg sync.WaitGroup

func main() {
 for i := 0; i < 20; i++ {
  wg.Add(1)
  go work(&wg)
 }
 wg.Wait()
}

func work(wg *sync.WaitGroup) {
 var counter int
 for i := 0; i < 1e10; i++ {
  counter++
 }
 wg.Done()
}

The code is relatively simple. We start 20 CPU-intensive G tasks, which are constrained by the WaitGroup. The program will only end execution when all the compute tasks of G have completed their respective accumulation.

schedtrace Scheduling Summary Output

Below, we set GODEBUG=schedtrace=1000, which means that the program’s scheduling summary is output once every 1s.

 1
 2
 3
 4
 5
 6
 7
 8
 9
10
11
12
13
14
15
 $ go build -o demo main.go
 $ GOMAXPROCS=4 GODEBUG=schedtrace=1000 ./demo
SCHED 0ms: gomaxprocs=4 idleprocs=3 threads=2 spinningthreads=0 idlethreads=0 runqueue=0 [0 0 0 0]
SCHED 1003ms: gomaxprocs=4 idleprocs=0 threads=5 spinningthreads=0 idlethreads=0 runqueue=14 [1 0 1 0]
SCHED 2012ms: gomaxprocs=4 idleprocs=0 threads=5 spinningthreads=0 idlethreads=0 runqueue=10 [2 1 2 1]
SCHED 3018ms: gomaxprocs=4 idleprocs=0 threads=5 spinningthreads=0 idlethreads=0 runqueue=12 [0 0 0 4]
SCHED 4029ms: gomaxprocs=4 idleprocs=0 threads=5 spinningthreads=0 idlethreads=0 runqueue=15 [0 0 1 0]
SCHED 5031ms: gomaxprocs=4 idleprocs=0 threads=5 spinningthreads=0 idlethreads=0 runqueue=9 [1 2 2 2]
SCHED 6035ms: gomaxprocs=4 idleprocs=0 threads=5 spinningthreads=0 idlethreads=0 runqueue=15 [0 1 0 0]
SCHED 7044ms: gomaxprocs=4 idleprocs=0 threads=5 spinningthreads=0 idlethreads=0 runqueue=8 [1 2 3 2]
SCHED 8054ms: gomaxprocs=4 idleprocs=0 threads=5 spinningthreads=0 idlethreads=0 runqueue=12 [0 0 4 0]
SCHED 9055ms: gomaxprocs=4 idleprocs=0 threads=5 spinningthreads=0 idlethreads=0 runqueue=6 [3 2 3 2]
SCHED 10063ms: gomaxprocs=4 idleprocs=0 threads=5 spinningthreads=0 idlethreads=0 runqueue=11 [1 2 1 1]
SCHED 11072ms: gomaxprocs=4 idleprocs=0 threads=5 spinningthreads=0 idlethreads=0 runqueue=6 [3 2 3 2]
...
  • SCHED: represents the running time between program start and when the current line is output, this output interval is affected by the schedtrace value.
  • gomaxprocs: the GOMAXPROCS value, here we set it to 4.
  • idleprocs: the number of idle P’s.
  • threads: the number of threads managed at runtime.
  • spinningthreads: spin threads, the number of threads in the “spin” state (to avoid frequent thread creation and destruction).
  • idlethreads: number of idle threads.
  • runqueue: number of G’s in the global queue GRQ.
  • [2 1 2 1]: the number of Gs in the local queue LRQ representing 4 P’s is 2, 1, 2, 1 respectively.

scheddetail scheduling detail output

When we want to see more detailed scheduling information, we need to add the scheddetail parameter.

 1
 2
 3
 4
 5
 6
 7
 8
 9
10
11
12
13
14
15
16
17
18
19
20
21
22
23
24
25
26
27
28
29
30
31
32
33
34
35
36
37
38
39
40
41
42
43
44
45
46
47
$ GOMAXPROCS=4 GODEBUG=schedtrace=1000,scheddetail=1 ./demo
SCHED 0ms: gomaxprocs=4 idleprocs=2 threads=3 spinningthreads=1 idlethreads=0 runqueue=0 gcwaiting=0 nmidlelocked=0 stopwait=0 sysmonwait=0
  P0: status=1 schedtick=0 syscalltick=0 m=0 runqsize=0 gfreecnt=0 timerslen=0
  P1: status=1 schedtick=0 syscalltick=0 m=2 runqsize=0 gfreecnt=0 timerslen=0
  P2: status=0 schedtick=0 syscalltick=0 m=-1 runqsize=0 gfreecnt=0 timerslen=0
  P3: status=0 schedtick=0 syscalltick=0 m=-1 runqsize=0 gfreecnt=0 timerslen=0
  M2: p=1 curg=-1 mallocing=0 throwing=0 preemptoff= locks=2 dying=0 spinning=false blocked=false lockedg=-1
  M1: p=-1 curg=-1 mallocing=0 throwing=0 preemptoff= locks=2 dying=0 spinning=false blocked=false lockedg=-1
  M0: p=0 curg=-1 mallocing=0 throwing=0 preemptoff= locks=1 dying=0 spinning=false blocked=false lockedg=1
  G1: status=1() m=-1 lockedm=0
  G2: status=1() m=-1 lockedm=-1
  G3: status=1() m=-1 lockedm=-1
SCHED 1000ms: gomaxprocs=4 idleprocs=0 threads=5 spinningthreads=0 idlethreads=0 runqueue=15 gcwaiting=0 nmidlelocked=0 stopwait=0 sysmonwait=0
  P0: status=1 schedtick=45 syscalltick=0 m=2 runqsize=0 gfreecnt=0 timerslen=0
  P1: status=1 schedtick=46 syscalltick=0 m=3 runqsize=0 gfreecnt=0 timerslen=0
  P2: status=1 schedtick=45 syscalltick=0 m=4 runqsize=1 gfreecnt=0 timerslen=0
  P3: status=1 schedtick=45 syscalltick=0 m=0 runqsize=0 gfreecnt=0 timerslen=0
  M4: p=2 curg=-1 mallocing=0 throwing=0 preemptoff= locks=1 dying=0 spinning=false blocked=false lockedg=-1
  M3: p=1 curg=-1 mallocing=0 throwing=0 preemptoff= locks=1 dying=0 spinning=false blocked=false lockedg=-1
  M2: p=0 curg=40 mallocing=0 throwing=0 preemptoff= locks=0 dying=0 spinning=false blocked=false lockedg=-1
  M1: p=-1 curg=-1 mallocing=0 throwing=0 preemptoff= locks=2 dying=0 spinning=false blocked=false lockedg=-1
  M0: p=3 curg=-1 mallocing=0 throwing=0 preemptoff= locks=1 dying=0 spinning=false blocked=false lockedg=-1
  G1: status=4(semacquire) m=-1 lockedm=-1
  G2: status=4(force gc (idle)) m=-1 lockedm=-1
  G3: status=4(GC sweep wait) m=-1 lockedm=-1
  G17: status=4(GC scavenge wait) m=-1 lockedm=-1
  G33: status=1() m=-1 lockedm=-1
  G34: status=1() m=-1 lockedm=-1
  G35: status=1() m=-1 lockedm=-1
  G36: status=1() m=-1 lockedm=-1
  G37: status=1() m=-1 lockedm=-1
  G38: status=1() m=-1 lockedm=-1
  G39: status=1() m=-1 lockedm=-1
  G40: status=2() m=2 lockedm=-1
  G41: status=1() m=-1 lockedm=-1
  G42: status=1() m=-1 lockedm=-1
  G43: status=1() m=-1 lockedm=-1
  G44: status=1() m=-1 lockedm=-1
  G45: status=1() m=-1 lockedm=-1
  G46: status=1() m=-1 lockedm=-1
  G47: status=1() m=-1 lockedm=-1
  G48: status=1() m=-1 lockedm=-1
  G49: status=1() m=-1 lockedm=-1
  G50: status=1() m=-1 lockedm=-1
  G51: status=1() m=-1 lockedm=-1
  G52: status=1() m=-1 lockedm=-1
...

When the scheddetail parameter is added, the output message not only contains a one-line overview of SCHED, but also a detailed description of the status of the three GPM entities.

P

  • status: the running status of P. See the source code runtime/runtime2.go for a detailed classification and description.

    runtime/runtime2.go

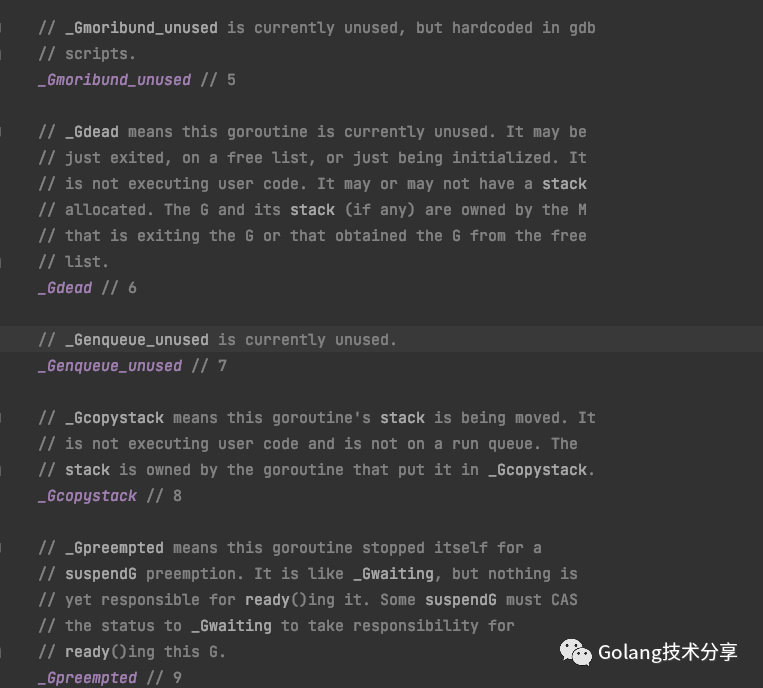
    • schedtick: The number of times P has been scheduled, added up with each scheduling action.
    • syscalltick: Accumulated with each system call behavior, representing the number of system calls of P.
    • m: M number of the binding, e.g. at SCHED 1000ms, m=2 for P0, and p=0 for M2.
    • runqsize: the number of G’s for LRQ.
    • gfreecnt: the number whose status is Gdead, i.e. status = 6.
    • timerslen: the number of timers.

M

  • p: P-number of the binding.
  • curg: the G number of the code currently being executed on M.
  • mallocing: whether there is an allocating memory operation in progress.
  • throwing: if or not an exception is being thrown.
  • preemptoff: if preemptoff ! = “”, then keep curg running on this M.
  • locks: the number of locks for M.
  • dying: the dying value of M, which has four handling cases of 0, 1, 2 and other values.
  • spinning: if or not it is in self-selected state.
  • blocked: if or not it is blocked.
  • lockedg: corresponds to lockedm of G. They are of type uintptr and record M that is not tracked by the garbage collector versus G that bypasses the write barrier.

G

  • status: similar to P’s status, see also the source runtime/runtime2.go for a detailed classification and description; if status==Gwaiting, i.e., if status is 4, it will also output the specific reason for waiting in parentheses.
  • m: the M number of the binding, if its value is -1, it means no binding.
  • lockedm: corresponds to lockedg in M.

Visual Scheduling Snapshot

Once you understand the meaning of the above indicators. To make the plotting simple, we set GOMAXPROCS to 2 and select the first second of the output for visual analysis.

 1
 2
 3
 4
 5
 6
 7
 8
 9
10
11
12
13
14
15
16
17
18
19
20
21
22
23
24
25
26
27
28
29
30
31
32
33
34
$ GOMAXPROCS=2 GODEBUG=schedtrace=1000,scheddetail=1 ./demo
...
SCHED 1004ms: gomaxprocs=2 idleprocs=0 threads=4 spinningthreads=0 idlethreads=1 runqueue=10 gcwaiting=0 nmidlelocked=0 stopwait=0 sysmonwait=0
  P0: status=1 schedtick=45 syscalltick=0 m=3 runqsize=4 gfreecnt=0 timerslen=0
  P1: status=1 schedtick=48 syscalltick=0 m=0 runqsize=4 gfreecnt=0 timerslen=0
  M3: p=0 curg=24 mallocing=0 throwing=0 preemptoff= locks=0 dying=0 spinning=false blocked=false lockedg=-1
  M2: p=-1 curg=-1 mallocing=0 throwing=0 preemptoff= locks=0 dying=0 spinning=false blocked=true lockedg=-1
  M1: p=-1 curg=-1 mallocing=0 throwing=0 preemptoff= locks=2 dying=0 spinning=false blocked=false lockedg=-1
  M0: p=1 curg=34 mallocing=0 throwing=0 preemptoff= locks=0 dying=0 spinning=false blocked=false lockedg=-1
  G1: status=4(semacquire) m=-1 lockedm=-1
  G2: status=4(force gc (idle)) m=-1 lockedm=-1
  G3: status=4(GC sweep wait) m=-1 lockedm=-1
  G4: status=4(GC scavenge wait) m=-1 lockedm=-1
  G17: status=1() m=-1 lockedm=-1
  G18: status=1() m=-1 lockedm=-1
  G19: status=1() m=-1 lockedm=-1
  G20: status=1() m=-1 lockedm=-1
  G21: status=1() m=-1 lockedm=-1
  G22: status=1() m=-1 lockedm=-1
  G23: status=1() m=-1 lockedm=-1
  G24: status=2() m=3 lockedm=-1
  G25: status=1() m=-1 lockedm=-1
  G26: status=1() m=-1 lockedm=-1
  G27: status=1() m=-1 lockedm=-1
  G28: status=1() m=-1 lockedm=-1
  G29: status=1() m=-1 lockedm=-1
  G30: status=1() m=-1 lockedm=-1
  G31: status=1() m=-1 lockedm=-1
  G32: status=1() m=-1 lockedm=-1
  G33: status=1() m=-1 lockedm=-1
  G34: status=2() m=0 lockedm=-1
  G35: status=1() m=-1 lockedm=-1
  G36: status=1() m=-1 lockedm=-1
...

A snapshot of the scheduling situation at that moment is shown below.

snapshot of the scheduling

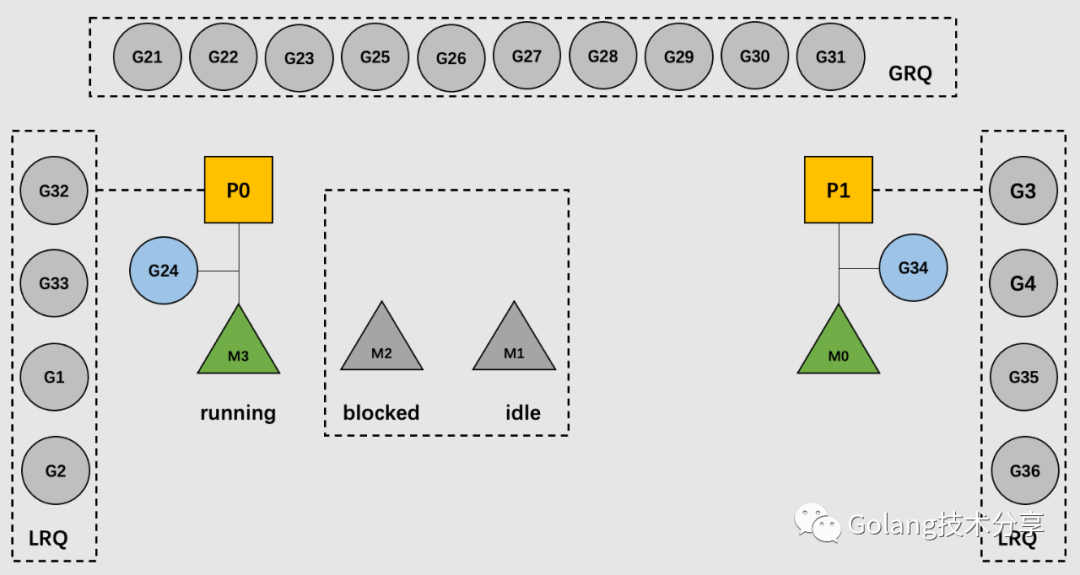
We can get the specific runs of P, M, and G based on the details. Note, however, that one thing we cannot be sure of is which specific Gs are waiting in the queue for each P’s LRQ and GRQ, but this does not affect the big picture (so the LRQs and GRQs in the figure above may not be the actual G numbers).

Summary

This article has shown that by adding the environment variable GODEBUG, we can easily view the scheduling of Go programs without making any code changes or adding additional plugins.

Readers who want to understand Go’s GMP and scheduling system more intuitively may want to give it a try.