gperftools is a very powerful set of performance analysis tools from Google. It has these three main functions:
- Analyze CPU performance, which can count the execution time of each function over a period of time, and help us to find the time-consuming code;
- Analyze memory usage, which can count the amount of memory allocated by each function at a certain time, helping us to find the code with high memory usage, and also help us to locate memory leaks;
- Automatic memory leak checking.
gperftools also includes a high-performance memory allocator, tcmalloc, which we can use instead of glibc’s ptmalloc. tcmalloc comes with its own statistics, so we can rely on it for memory analysis and checking memory leaks.
This article describes some common uses of gperftools on Linux. If you need to use gperftools to analyze Linux (server) programs, this article can be used as a Quick Start.
Compile and Install
Download the stable version from the gperftools release page. If Linux is a 64-bit version, gperftools recommends installing libunwind. This is usually done directly using yum or apt. After unpacking, execute the following command directly.
This installs libraries such as libprofiler.so and libtcmalloc.so, the performance report generator pprof, and a bunch of header files.
CPU performance analysis
In order to use the CPU performance analysis feature, we need to link the shared library libprofiler into the executable. gperftools recommends adding the -lprofiler option to the (compile) link, for example:
|
|
This does not turn on performance collection at runtime, it just inserts profiler code. If it is not turned on, the program will not be affected. Therefore gperftools recommends always adding -lprofiler to the development environment, which is what they do at Google.
Another option is to hook libprofiler.so into the program using the LD_PRELOAD environment variable. This approach does not require recompiling the program, but simply adding the environment variable to the program when it runs, for example.
|
|
This way . /factorio also runs with profiler code.
Turning on performance collection
Simply set the environment variable CPUPROFILE to the path of the performance collection file to enable performance collection. For example.
|
|
This turns on performance collection from the time the program runs until it stops. The results of the performance collection are written to the file specified by CPUPROFILE. If the program calls fork(2) to create a child process, then the child process will also start performance collection. To distinguish it from the parent process, the resulting file name is spelled with the process ID.
In many cases we don’t want to collect performance data for the whole process. In multi-process scenarios, we also want to collect performance data from processes with a specific ID. gperftools supports the use of signals to control performance collection on/off: we can use the environment variable CPUPROFILESIGNAL to specify a switch signal. The first time a program receives the specified signal, it will turn on performance collection, and the second time it receives it, it will turn it off. For example.
|
|
Assuming that the process ID of server is 10191, then just run kill -12 10191 to enable performance collection; running kill -12 10191 again will stop it, and write the collection results to a file.
The default collection rate for gperftools is 100 times per second. We can also use the environment variable CPUPROFILE_FREQUENCY to specify the collection frequency. For example.
|
|
Exporting analysis reports
On Linux servers we usually use pprof to export analysis reports in pdf format. pprof relies on dot and ps2pdf to draw and generate pdfs, so we need to install them first.
|
|
As in the above . /server example, use the following command to export the pdf.
|
|
We can get an analysis report like this:
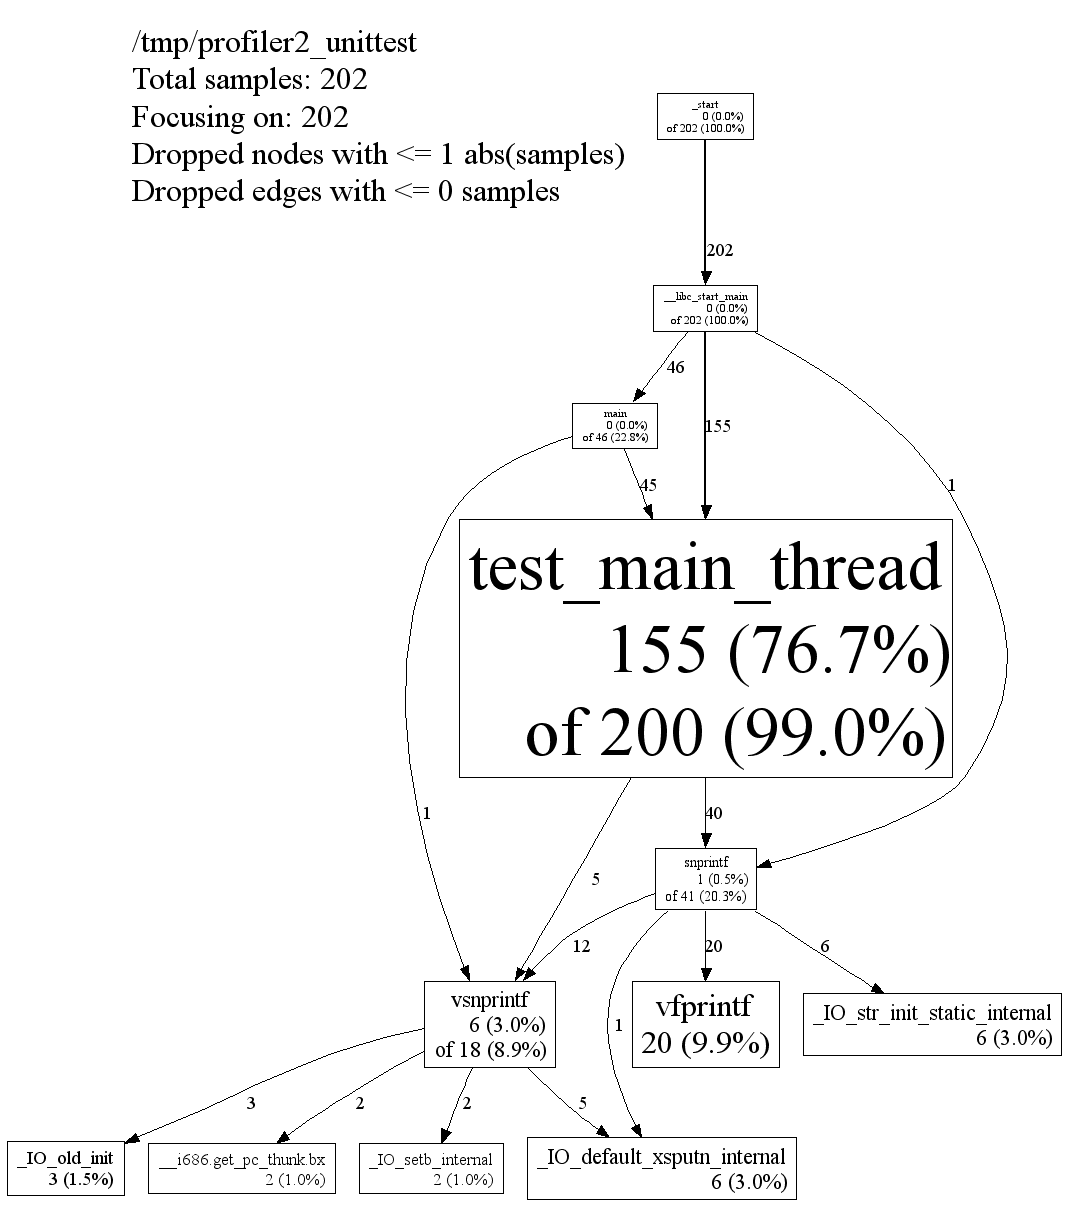
The report shows the call relationships between functions, and the time taken by each function. Each node in the graph represents a function, and each edge represents the call relationship between them. Each node has this format.
where cumulative means the total time taken by the function, that is, the time taken by the function’s own code, plus the time taken by calls to other functions. local is the time taken by the function’s own code. The number on each edge indicates the total time taken by the function to which the call was made. That is, cumulative equals the sum of all the “in degrees” of the node; local plus the sum of all the “out degrees” of the node equals cumulative. The larger the node, the longer the loacl time of the function.
The unit of time depends on the collection frequency. If the default is 100 times per second, then the unit is about 10 milliseconds. In the example above, the total execution time of test_main_thread is about 2000 milliseconds, of which about 1550 milliseconds is taken up by the function’s own code, 400 milliseconds by its call to snprintf, and 50 milliseconds by its call to vsnprintf.
pprof omits some of the smaller nodes and edges when exporting the report. We can also specify the omission threshold with the parameter.
-nodecount=<n>: Only show the firstnnodes that take the most time, the default is 80.-nodefraction=<f>: Only show nodes with a time consumption ratio not less thanf, default is 0.005 (i.e. nodes with a time consumption ratio less than 0.5% will be discarded). If both--nodecountand--nodefractionare set, only nodes that meet both conditions will be retained.--edgefraction=<f>: Only edges with a time consumption ratio not less thanfare displayed, the default is 0.001.
Memory analysis
In order to use the memory analysis feature, we need the shared library libtcmalloc to be linked into the executable. Similar to libprofiler, gperftools recommends using the -ltcmalloc link option to link the shared library into the executable. If you cannot recompile the program, you can also use LD_PRELOAD . Again, linking a shared library just inserts the tcmalloc code and does not turn on memory statistics.
Turning on memory statistics
To enable memory statistics, simply set the environment variable HEAPPROFILE to the path of the memory statistics file. Example.
|
|
Memory statistics are different from performance collection. Performance collection collects the time spent by each function over a period of time, while memory is both allocated and freed. Memory statistics therefore count the amount of memory occupied by each function at a specific time.
gperftools will count the memory usage of the current program every once in a while and generate a result file. As in the example above, the environment variable HEAPPROFILE=server , generates a series of result files like this.
The default statistics rule for gperftools is to count every 1 GB allocated to the program, or every 100 MB occupied. This behavior can also be controlled by environment variables
HEAP_PROFILE_ALLOCATION_INTERVAL: counts every byte of memory allocated. Default is 1073741824 (1 GB).HEAP_PROFILE_INUSE_INTERVAL: A count of how many bytes of memory are occupied. Defaults to 104857600 (100 MB).HEAP_PROFILE_TIME_INTERVAL: How many seconds are counted every time. Defaults to 0.HEAPPROFILESIGNAL: Count every time the specified signal is received.
Exporting the analysis report
We also use pprof to export the memory analysis report. Remember to install dot and ps2pdf .
|
|
This yields an analysis report like this:
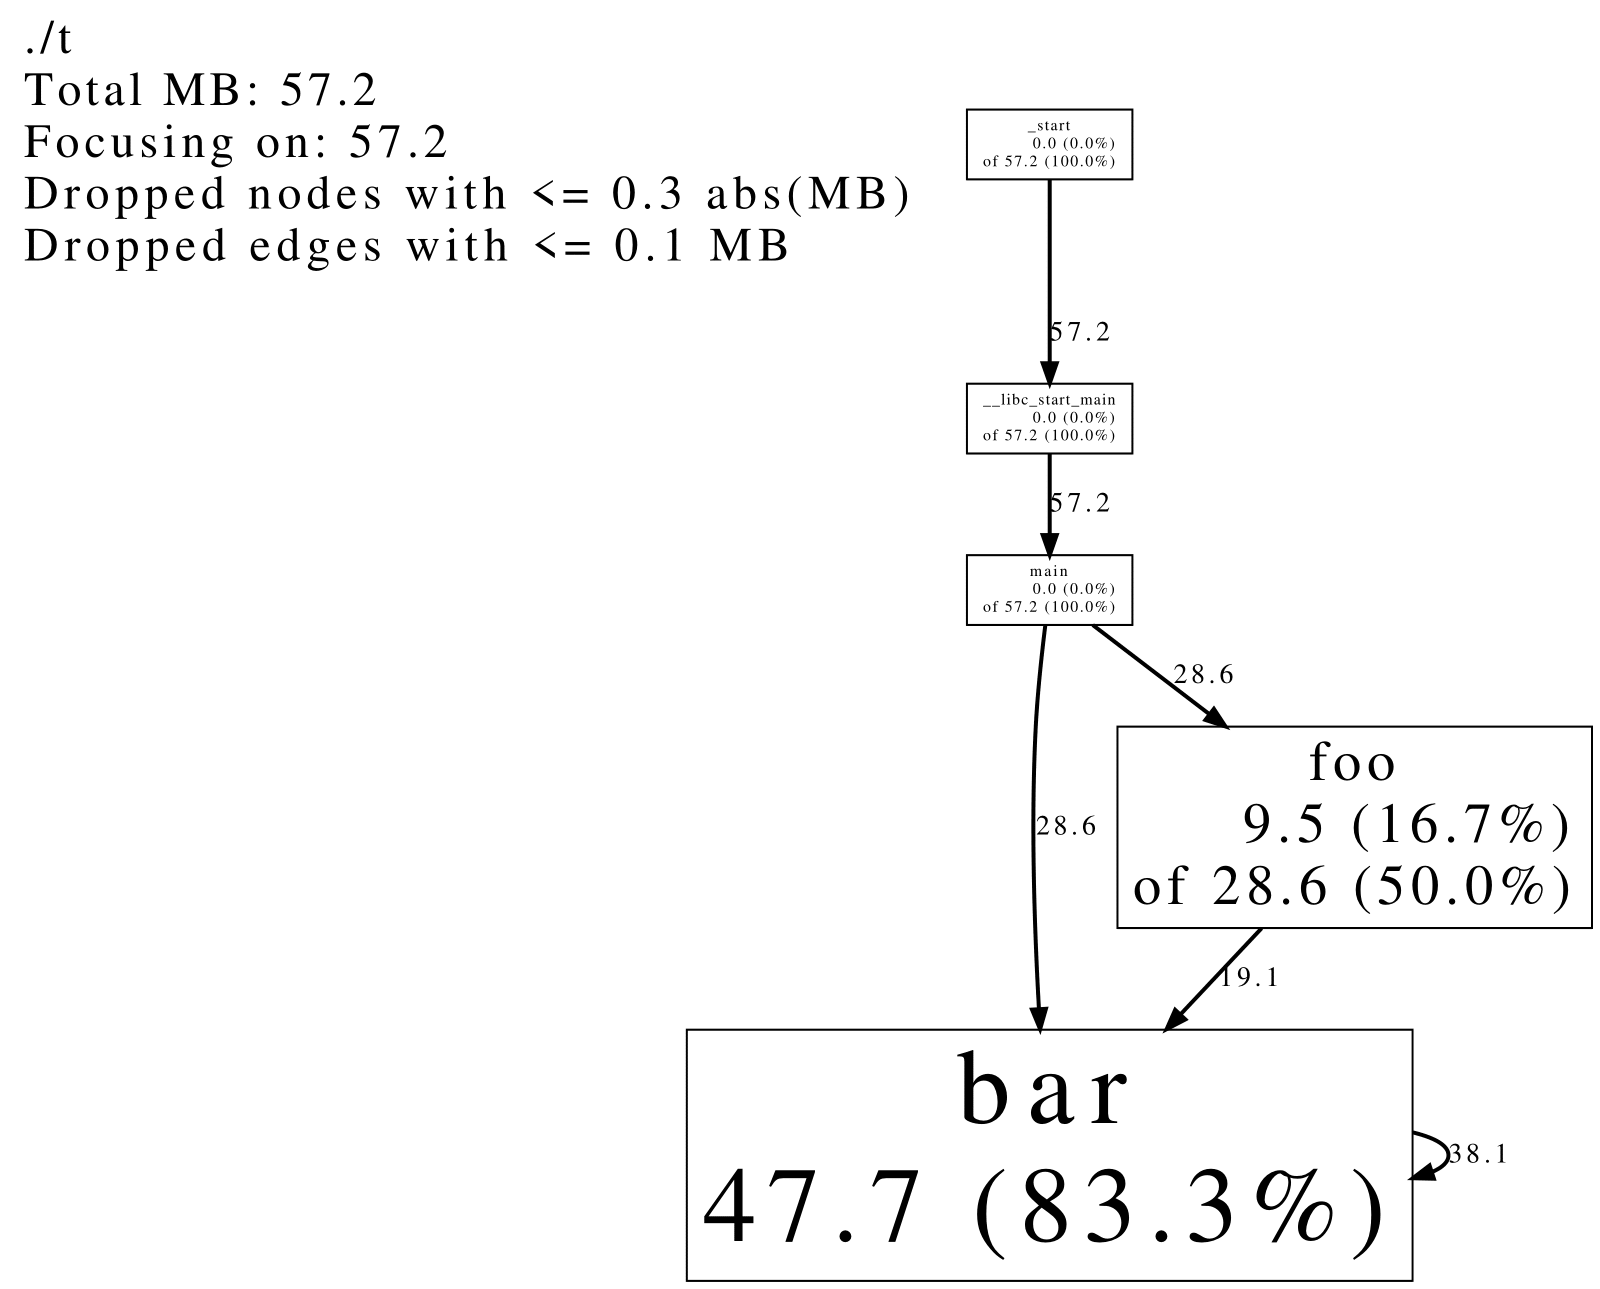
Like the performance report, the memory report also shows the relationship of each function call; the difference is that it shows the memory occupied by each function instead of the time. Each node also has the format local of cumulative, where local is the amount of memory occupied by the function’s own code and cumulative is the amount of memory occupied by the function itself and by calls to other functions. The number on each edge indicates how much memory was allocated as a result of calls to the function pointed to.
The memory analysis report clearly shows how much memory each function occupies, and this data can help us check for memory leaks. For example, by comparing the amount of memory occupied by a function at each point in time, if the memory occupied by a function keeps growing, it means that the function is likely to have a memory leak. pprof provides the --base parameter to help us compare the memory changes at two points in time.
|
|
The memory reported is the memory footprint of the server.0003.heap record minus the memory footprint of the server.0001.heap record.
Memory Leak Checking
In addition to manually checking for memory leaks based on memory analysis reports, gperftools also provides an automated memory leak checking tool. The checker is also integrated into tcmalloc, and we also need to link libtcmalloc into the program. The checker will count the memory allocated and freed at the beginning of the program, and analyze the memory leaks before the program ends. Setting the environment variable HEAPCHECK=normal will enable memory leak checking.
|
|
You can get an output like this:
|
|
The result shows that 6 objects are leaking, and shows the size of each object. Finally, we are prompted to use the -pprof command to get a more detailed report. On the server we can’t use the -gv option, we can use -pdf to export a pdf instead.
|
|
You can get a result like this:
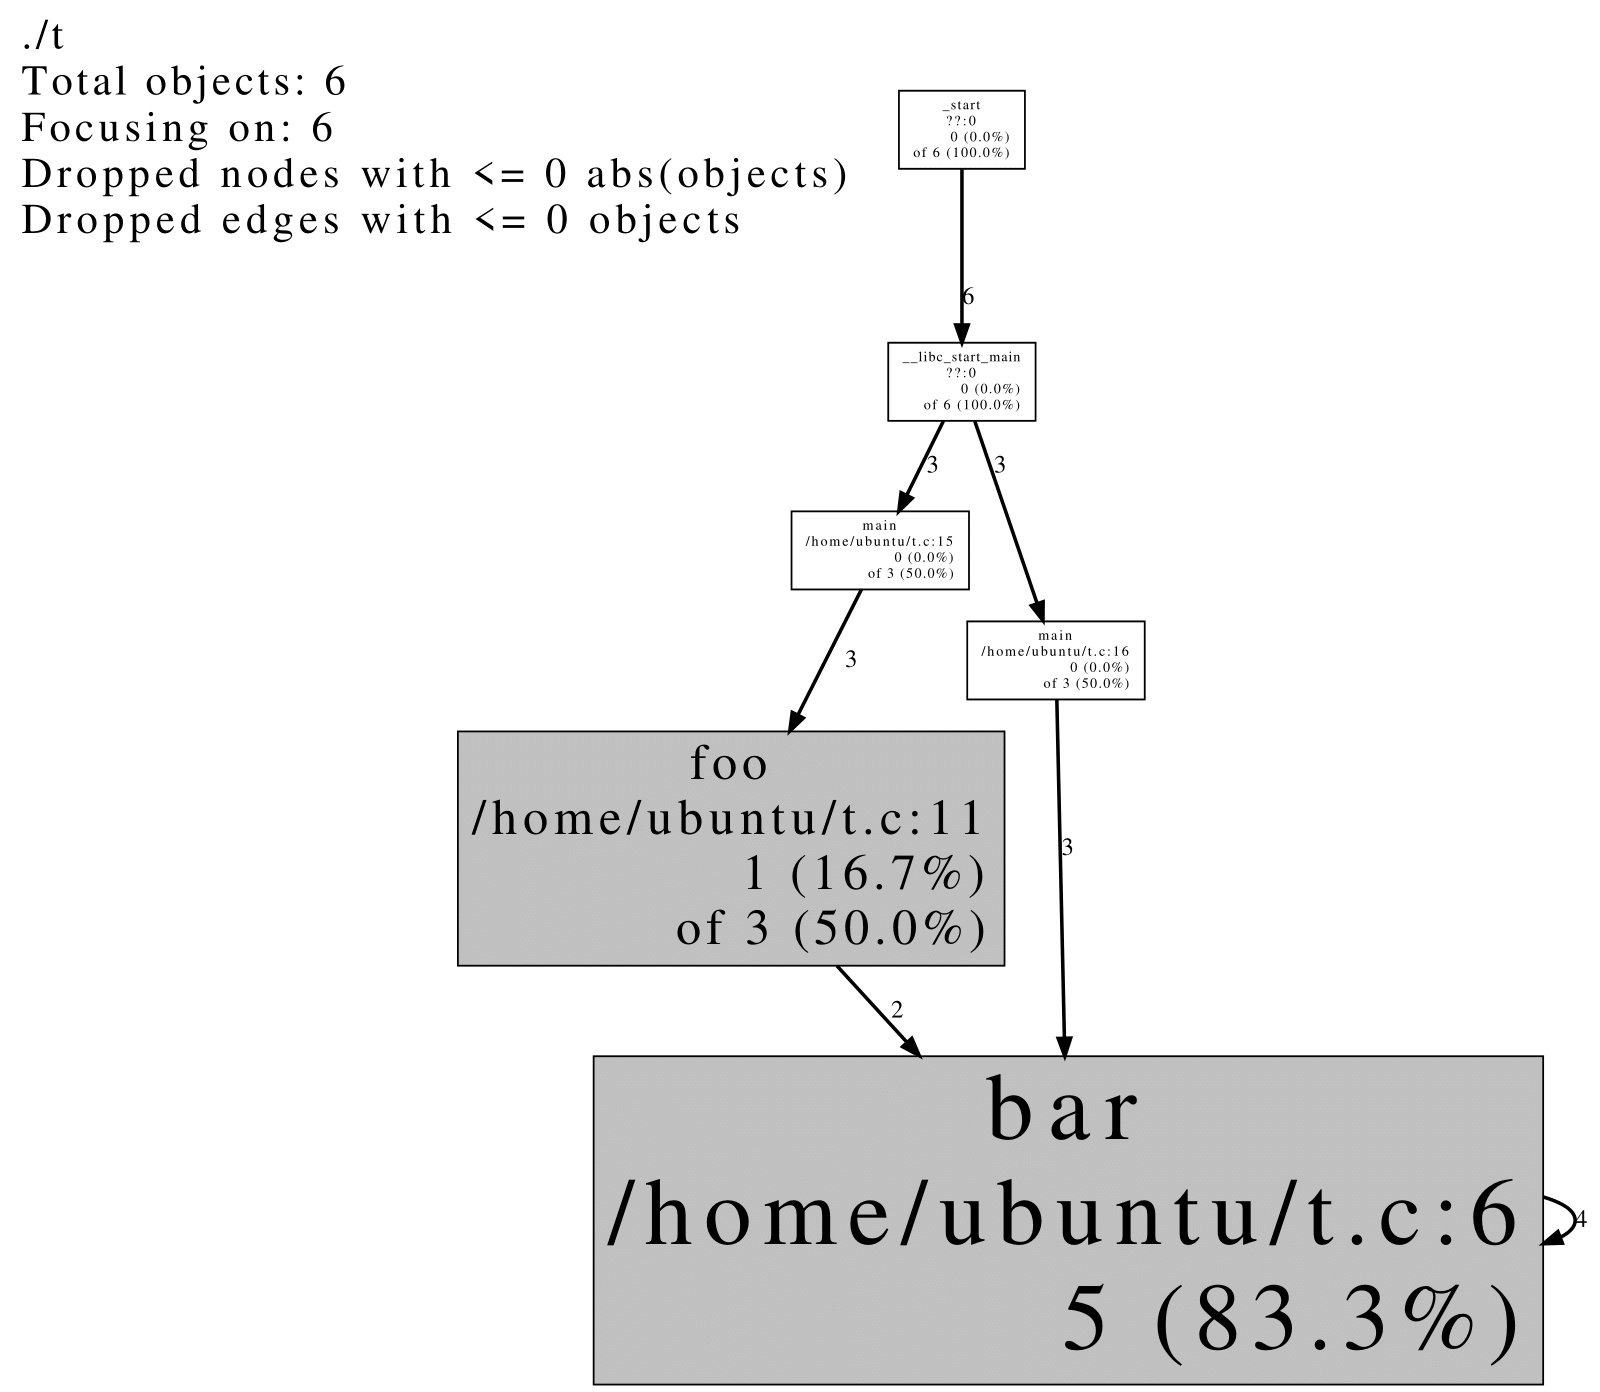
The result is also a function call relationship graph, with local of cumulative on each node indicating how many objects were leaked. local is the number of objects leaked by the function’s own code, and cumulative is the number of objects leaked by local plus calls to other functions. The number on each edge indicates how many objects were leaked by calls to the function pointed to.
How to detect memory leaks
When HEAPCHECK=normal is set, gperftools’ memory checking tool detects leaked objects instead of leaked memory . Memory that is allocated but not freed is not necessarily considered to be leaked, only objects that are not accessible are considered to be leaked. gperftools treats properly aligned sequences of bytes in memory as pointers, and checks that objects allocated in the heap are not pointed to by these “pointers”. If not, then the object is leaking. For example, the following code will not report a memory leak, even though there is unfree memory.
Therefore, memory leak checking cannot be guaranteed to be 100% accurate. In addition, it is possible that some sequence of bytes in memory may have a value equal to an allocated object, and although the probability of this is low, if the object happens to be leaking, gperftools will not detect it.
Although normal is the most common, we can set HEAPCHECK to other values to modify the memory leak detection method.
minimal: Start memory leak statistics as late as possible, meaning that some memory leaks during initialization (such as global object constructors) will not be detected.normal: The most common pattern, with a strictness betweenminimalandstrict.strict: In contrast tominimal, introduces some additional checks to ensure that memory leaks during initialization are detected.draconian: Also ensures that memory leaks at initialization are detected, but instead of using the mechanism described above to detect leaked objects, the leaked memory is detected directly. Any memory that is not freed on exit will be reported as a memory leak.
Extended Reading
There are some more advanced uses of gperftools, for example, we can control when to turn on and off statistics, or ignore memory leaks in certain code, through the programming interface provided by gperftools. This can help us analyze program performance in a more targeted way. When turning on collection and statistics, gperftools also supports some environment variables to control their behavior more precisely. When exporting reports, pprof supports some advanced parameters, such as focusing on specific functions, or ignoring specific functions; exporting reports in different formats, etc. For more information on these uses, see the gperftools documentation, which is available in the gperftools/docs directory.