When we develop software, we will iterate the project schedule and requirements rapidly. The fastest way to solve this problem is to scale vertically, adding CPU and memory first, but this is not a cure.
This article will introduce a set of tools called pyroscope, which allows developers to quickly find the code of performance bottlenecks. Pyroscope currently supports many languages, such as Go, Python, Java, Ruby, Rust, PHP, and . If you want to quickly find performance bottlenecks on the local side, read on to the end of this article. The following will teach you a practical example in Go.
Why adhoc profiling
Pyroscope recently launched adhoc profiling feature, and people want to see why this feature was officially launched. Originally, Pyroscope launched this open source platform to allow developers to quickly find performance bottlenecks from the point in time when the platform is online, but when you move to that point in time, you will see a lot of noise, and to keep detecting, developers need to keep testing, and this way can not be quickly verified on the local side.
The goal of Pyroscope is to introduce adhoc profiling, so that developers can quickly verify and find performance bottlenecks locally with Pyroscope, without running a whole service, just capture the specific process and generate the performance data through Script, and read the data directly through Pyroscope CLI. Pyroscope CLI reads the data directly.
adhoc profiling usage
Using adhoc mode allows developers to monitor all performance bottlenecks while running scripts and quickly see the results through the Pyroscope UI interface. Here’s how to use adhoc mode. Developers can use the pyroscope CLI to do this. Let’s take a look at the Go example.
|
|
Then execute the following command.
|
|
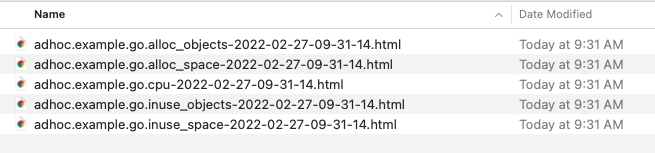
After running, you can see that there are many more HTML files in the same directory, and these files can be shared to other colleagues for reference, which is quite convenient as a team communication tool, so that other colleagues can also compare this data, so as not to miss the correct focus.
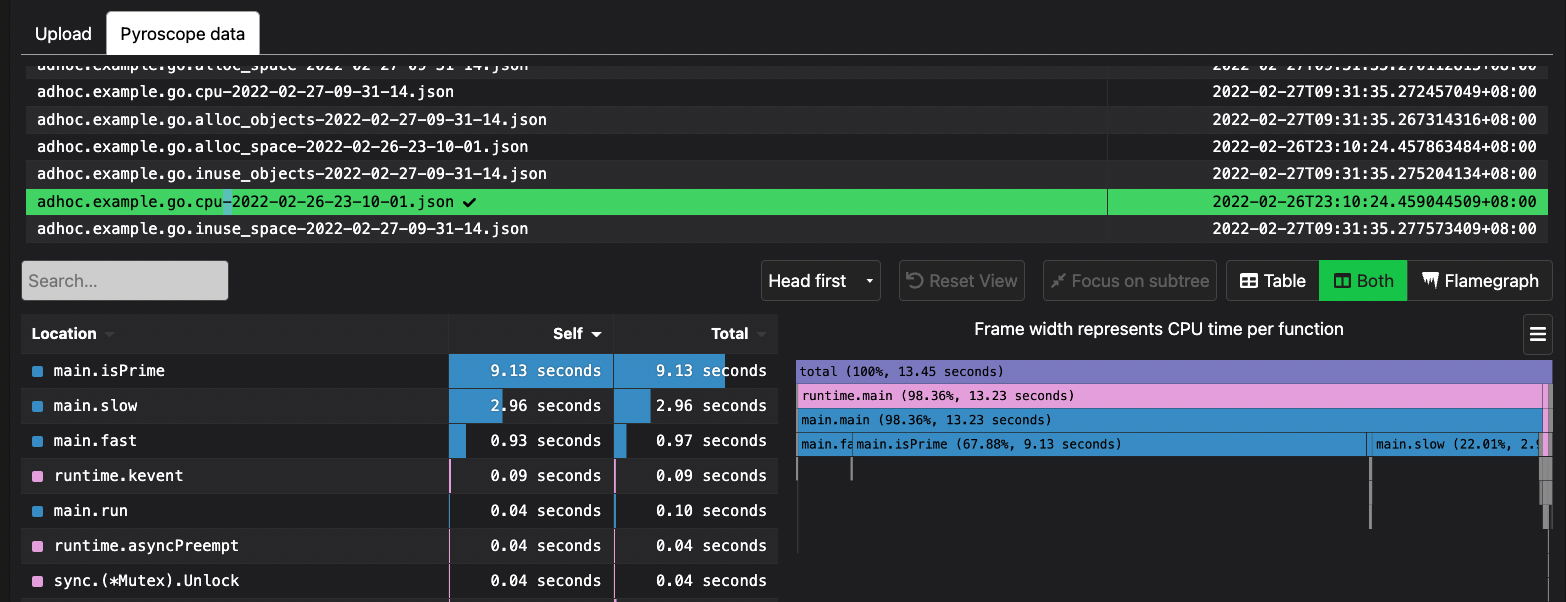
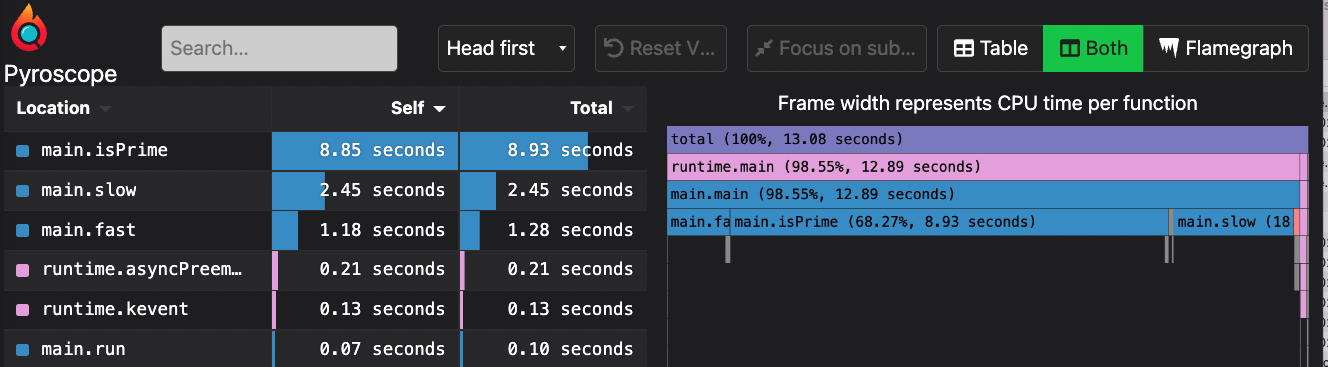
Click on CPU Profiling and you will see the following:
In addition to opening the HTML file, you can also use the pyroscope CLI to open the Server service locally, which will then read the ~/.pyroscope/pyroscope/ location in the home directory, where the developer’s Profiling JSON format data is stored each time. Please open http://localhost:4040.
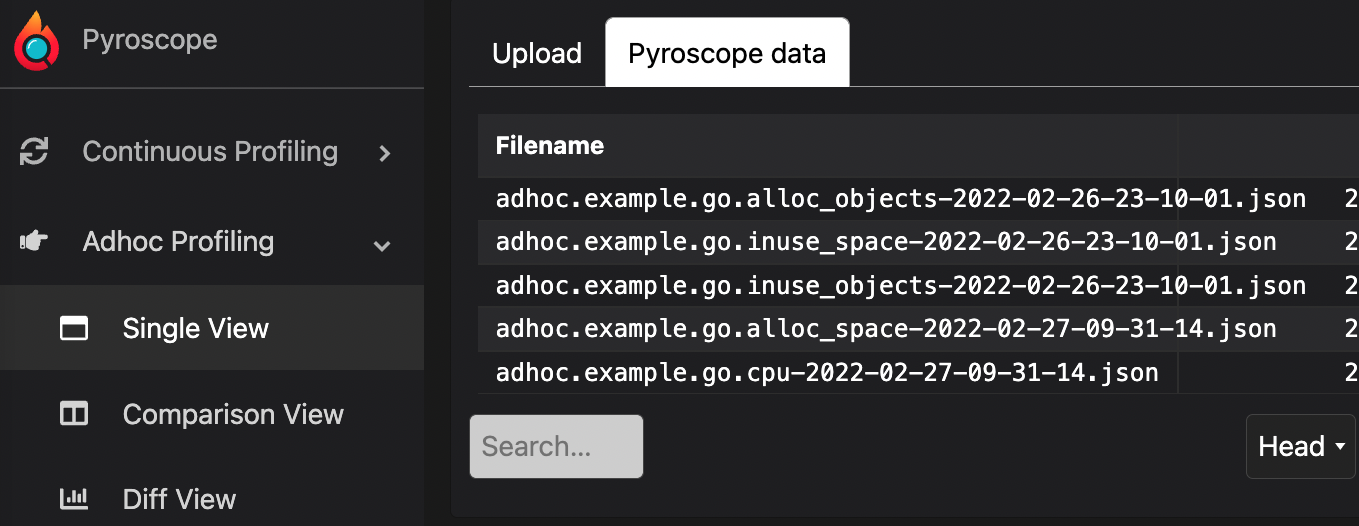
As you can see from the above picture, click Single View on the left, and you can see the tab of pyroscope data appearing on top, which is all the data in the directory, and you can present and compare the data in real time.
Online Profiling Service
If you don’t want to install any environment even on the local side, you can do it through the following two online services.
You can put the code of a functional problem on Playground and share it with other team members, and modify it online to test it directly, which is actually similar to Playground provided by Go.
Summary
This feature is very helpful, especially if you want to do some performance analysis on the local side, although there is pprof can be used, but without a good UI interface, it is still very difficult to shorten the debugging time, and with the adhoc function, you can also share the data with other colleagues to help. After all, the pyroscope function will not be activated after the service is officially launched, so as not to affect the performance of the service, but will be monitored at the test site at any time, with Prometheus + Grafana to find out the performance changes at a specific point in time.
As mentioned in the first paragraph above, there is support for many different languages, so you can quickly test the performance of different writing methods on the local side, instead of having to push the code onto the machine to verify it, which really saves a lot of time. You can also attach the HTML file to the Issue Tracking system while finding the problem.