We all know that distributed systems are very difficult to manage, and one of the big reasons is that if the whole system is to be available, all components (services) need to be working properly. If a small component is not available, the system should be able to detect it, bypass it and fix it, and this should be done automatically. A health check is a simple way for the system to know if an instance of an application (service) is working properly. If an instance is working properly, then other services should not access it or send requests to it, and requests should be sent to the healthy instance. And the system should restore the monitoring state of the application.
When we use Kubernetes to run and manage our applications (services), by default when all containers in a Pod are started, the appropriate traffic is sent to that Pod and the containers are restarted when they crash. In general, this behavior is also acceptable, but k8s also provides a health check mechanism for containers, which allows us to make our deployment more robust.
Before demonstrating how to configure health checks for K8S specifically, let’s take a look at what Health Probe Pattern (Health Probe Pattern)?
Health Probe Model
Resiliency is one of the most important aspects to consider when designing a mission-critical, highly available application. An application is resilient when it can recover quickly from failure. To ensure that applications deployed on k8s are highly available, we need to follow specific design patterns when designing a cluster. One such pattern is health probing, which defines how the application reports its own health status to the system (k8s). The health state here is not only whether the Pod is up and running, but also whether it can handle and respond to requests properly, so that k8s can route traffic and load balance it more rationally.
Health Detection in Kubernetes
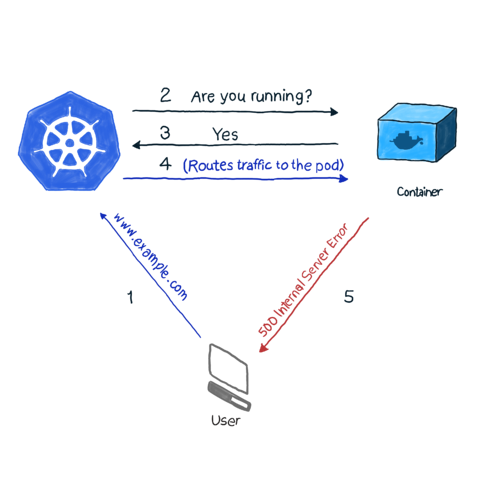
As we all know, k8s monitors the status of Pods through various controller objects (Deployment, StatefulSets, etc.). If a controller detects that a Pod has crashed for some reason, it tries to restart the Pod, or dispatch the Pod to another node for startup. However, a Pod can report its own state. For example, if an application using Nginx as a web server is deployed to a cluster via Deployment and starts normally, the Pod’s state is detected as running, but for some reason the web service does return 500 (internal service error) when accessed, and the service is The service is not available to the requestor.
By default, k8s’ kubelet continues to probe the container’s processes, and when it detects a process exit, it restarts the container’s Pod, and in some cases the restart can bring the container back to normal. However, as in the example above, the container is running normally while the application returns a 500 error, which does not properly detect the health status of the application.
Therefore, k8s provides two types of probes: Liveness Probe and Readiness Probe.
Survival Detection (Liveness Probe)
Many applications run for a long time, or encounter some kind of error and enter a deadlock state that cannot be recovered unless restarted. So k8s provides Liveness Probe to find and recover this state. Of course, when Liveness Probe detects an error, kubelet will take a restart action on the Pod to recover the application.
Readiness Probe
Sometimes the application may temporarily fail to provide network services to the outside world, for example, when the load is relatively high is even, or when the application starts up it may need to load a lot of data or do some initialization actions, and needs some time to prepare to provide services to the outside world. In such cases, when the system detects that the application instance is not available, it should not kill the application restart, but should allocate traffic and not send requests to that instance (by configuring the service load). Therefore, k8s provides readiness detection to find and handle this situation. When the container in the Pod is found to be ready, the service (k8s resource pair line) of the application is set to remove the Endpoint (service endpoint) of the instance, making the traffic flow over the unavailable service instance, and then add its endpoint back to the corresponding service after the readiness is detected. Of course, if the application is started for the first time, it will wait for a successful readiness probe before adding it to the service endpoint.

Kubernetes probing methods
How does the system detect the health status of the container? k8s supports the configuration of three detection methods: Execute Command, TCP, HTTP.
All three methods can be applied to live and ready probes.
Execute Commands
The state of the container is determined by executing commands inside the container. If the command returns a value of 0, the container is considered healthy; if the return value is non-zero, the container is considered unhealthy. This approach is generally used in cases where the container is running an application that does not provide HTTP services and does not have any TCP ports started to provide services, and a command can be run to determine whether the application is healthy.
Here is the command to configure a Pod to use.
The above example uses the command cat /tmp/healthy for inventory detection. If the /tmp/healthy file does not exist in the container, the command returns a non-zero value and k8s considers the container unhealthy, where survival detection is used and therefore restarts the Pod.
TCP
That TCP approach, is to determine if the container is healthy by trying to establish a TCP connection to the port it is listening on, if it can successfully establish a connection, it is considered healthy, otherwise it is not.
The above example shows the survival detection by configuring the TCP method. k8s will check whether the container is healthy by checking Pod port 3000, and there are two parameters in the above configuration.
initialDelaySeconds- how much time to wait for the Pod to start checking (15 seconds), this parameter is used when the application needs a certain amount of time to start, to avoid the failure of the check at the beginning and cause the Pod to restartperiodSeconds- the period of time to perform port checks, that is, every 20 seconds when the Pod is running
HTTP
If the application is an HTTP service (or implements an HTTP service API to report health status), the probing can be done by configuring HTTP.
The HTTP method sends an http request to the container’s port and specified path. If the request returns a value between 200 - 300, it is considered successful, and if it returns some other value, such as 500, it is considered a failure.
Health probes can also be configured with more parameters to make determinations, for more information refer to Kubernetes documentation.
Summary
Before cloud-native applications, the health of the application was mainly monitored and analyzed through application logs, however there was little way to automatically recover the application when it was unavailable. Of course logs are still very useful, and log aggregation systems should be needed to collect logs from all applications to observe and analyze application behavior.
For distributed systems, and container-based microservice architecture cloud-native applications, we need to recover applications from failure more quickly to ensure system robustness. Therefore, when designing the application, we should consider the appropriate health detection mode, and when orchestrating the application through Kubernetes, we should also detect the health status of the container as much as possible, and yes, k8s takes the operation to ensure the high availability of the system when the application instance is found to be unavailable.