The Operator, as we know, is a great tool for Kubernetes, greatly simplifying the installation, configuration and management of applications, and for VictoriaMetrics there is an official counterpart to the Operator for management - vm-operator, which is inspired by prometheus-operator and is a great tool for managing application monitoring configurations.

The vm-operator defines some CRDs as follows.
VMCluster: defines VM clustersVMAgent : defines vmagent instancesVMServiceScrape: defines the metrics configuration for grabbing from Service supported PodsVMPodScrape : Defines the metrics configuration to be grabbed from PodsVMRule : Define alarm and logging rulesVMProbe : Define probe configuration for target using blackbox exporter
The Operator also recognizes the ServiceMonitor, PodMonitor, PrometheusRule and Probe objects in the prometheus-operator by default, and allows you to use CRD objects to manage VM applications within a Kubernetes cluster.
Install
The Helm Charts package is provided with vm-operator, so you can use Helm to do a one-click installation.
1
2
|
☸ ➜ helm repo add vm https://victoriametrics.github.io/helm-charts/
☸ ➜ helm repo update
|
Customize the values to suit your needs. The default values.yaml can be obtained with the following command.
1
|
☸ ➜ helm show values vm/victoria-metrics-operator > values.yaml
|
We have made only the following changes here.
 1
 2
 3
 4
 5
 6
 7
 8
 9
10
11
12
13
14
15
16
17
18
19
20
21
22
23
24
25
26
27
28
29
30
|
# values.yaml
rbac:
  create: true
  pspEnabled: false # 不创建psp

operator:
  # -- 默认情况下,vm-operator会转换prometheus-operator对象
  disable_prometheus_converter: false
  # -- 默认情况下,vm-operator会为它的对象创建psp
  psp_auto_creation_enabled: false
  # -- 启用转换后的 prometheus-operator 对象的所有权引用,如果删除 prometheus 对象,它将删除相应的 victoria-metrics 对象。
  enable_converter_ownership: false
  # -- Enables custom config-reloader, bundled with operator.
  # It should reduce  vmagent and vmauth config sync-time and make it predictable.
  useCustomConfigReloader: true
# -- 是否开启资源校验的准入控制器(生产环境建议开启)
# admissionWebhooks:
#   # -- Enables validation webhook.
#   enabled: false
#   # -- What to do in case, when operator not available to validate request.
#   policy: Fail
#   # -- Enables custom ca bundle, if you are not using cert-manager.
#   # -- in case of custom ca, you have to create secret - {{chart-name}}-validation
#   # -- with keys: tls.key, tls.crt, ca.crt
#   caBundle: ""
#   certManager:
#     # -- Enables cert creation and injection by cert-manager.
#     enabled: false
#     # --If needed, provide own issuer. Operator will create self-signed if empty.
#     issuer: {}
|
The vm-operator can then be installed with one click using the following command.
 1
 2
 3
 4
 5
 6
 7
 8
 9
10
11
12
13
|
☸ ➜ helm upgrade --install victoria-metrics-operator vm/victoria-metrics-operator -f values.yaml -n vm-operator --create-namespace
NAME: victoria-metrics-operator
LAST DEPLOYED: Tue May 17 15:51:40 2022
NAMESPACE: vm-operator
STATUS: deployed
REVISION: 1
TEST SUITE: None
NOTES:
victoria-metrics-operator has been installed. Check its status by running:
  kubectl --namespace vm-operator get pods -l "app.kubernetes.io/instance=victoria-metrics-operator"

Get more information on https://github.com/VictoriaMetrics/helm-charts/tree/master/charts/victoria-metrics-operator.
See "Getting started guide for VM Operator" on https://docs.victoriametrics.com/guides/getting-started-with-vm-operator.html .
|
You can check the status of vm-operator after the installation is complete to verify that the installation was successful.
1
2
3
4
5
6
|
☸ ➜ helm ls -n vm-operator
NAME                            NAMESPACE       REVISION        UPDATED                                 STATUS       CHART                           APP VERSION
victoria-metrics-operator       vm-operator     1               2022-05-17 15:53:14.60667 +0800 CST     deployed     victoria-metrics-operator-0.9.0 0.24.0
☸ ➜ kubectl --namespace vm-operator get pods -l "app.kubernetes.io/instance=victoria-metrics-operator"
NAME                                        READY   STATUS    RESTARTS   AGE
victoria-metrics-operator-d467cf69c-glh6v   1/1     Running   0          2m58s
|
Deploy a VM cluster
The Operator installation will contain a number of CRDs as shown below.
 1
 2
 3
 4
 5
 6
 7
 8
 9
10
11
12
13
14
15
|
☸ ➜ kubectl get crd |grep victoriametrics
vmagents.operator.victoriametrics.com                2022-05-17T07:51:42Z
vmalertmanagerconfigs.operator.victoriametrics.com   2022-05-17T07:51:42Z
vmalertmanagers.operator.victoriametrics.com         2022-05-17T07:51:42Z
vmalerts.operator.victoriametrics.com                2022-05-17T07:51:42Z
vmauths.operator.victoriametrics.com                 2022-05-17T07:51:42Z
vmclusters.operator.victoriametrics.com              2022-05-17T07:51:42Z
vmnodescrapes.operator.victoriametrics.com           2022-05-17T07:51:42Z
vmpodscrapes.operator.victoriametrics.com            2022-05-17T07:51:42Z
vmprobes.operator.victoriametrics.com                2022-05-17T07:51:42Z
vmrules.operator.victoriametrics.com                 2022-05-17T07:51:42Z
vmservicescrapes.operator.victoriametrics.com        2022-05-17T07:51:42Z
vmsingles.operator.victoriametrics.com               2022-05-17T07:51:42Z
vmstaticscrapes.operator.victoriametrics.com         2022-05-17T07:51:42Z
vmusers.operator.victoriametrics.com                 2022-05-17T07:51:42Z
|
For example, if we want to deploy VMs in single node mode, we can use the VMSingle object. If we want to deploy a cluster of VMs, we can just use VMCluster to define an object. We don’t need to create the components manually, Operator will pull up a cluster for us based on our definition.
For example, here we define a VMCluster object as shown below.
 1
 2
 3
 4
 5
 6
 7
 8
 9
10
11
12
13
14
15
16
17
18
19
20
21
22
23
24
25
26
27
28
29
30
31
32
33
34
|
# vmcluster-demo.yaml
apiVersion: operator.victoriametrics.com/v1beta1
kind: VMCluster
metadata:
  name: vmcluster-demo
spec:
  replicationFactor: 1
  retentionPeriod: "1w"
  vmstorage:
    replicaCount: 2
    storage:
      volumeClaimTemplate:
        spec:
          accessModes:
            - ReadWriteOnce
          resources:
            requests:
              storage: 10G
          storageClassName: nfs-client
    storageDataPath: /vm-data
  vmselect:
    replicaCount: 2
    cacheMountPath: /cache
    storage:
      volumeClaimTemplate:
        spec:
          storageClassName: nfs-client
          accessModes:
            - ReadWriteOnce
          resources:
            requests:
              storage: 1G
  vminsert:
    replicaCount: 2
|
Here we specify the length of data retention as 1 week via spec.retentionPeriod, replicaCount to specify the number of copies for each component as 2, and the PVC template for data persistence via storage.volumeClaimTemplate. can be obtained via kubectl explain.
 1
 2
 3
 4
 5
 6
 7
 8
 9
10
11
12
13
14
15
16
17
18
19
20
21
22
23
24
25
26
27
28
29
30
31
32
33
34
35
36
37
38
39
40
41
42
43
|
☸ ➜ kubectl explain VMCluster.spec
KIND:     VMCluster
VERSION:  operator.victoriametrics.com/v1beta1

RESOURCE: spec <Object>

DESCRIPTION:
     VMClusterSpec defines the desired state of VMCluster

FIELDS:
   clusterVersion       <string>
     ClusterVersion defines default images tag for all components. it can be
     overwritten with component specific image.tag value.

   imagePullSecrets     <[]Object>
     ImagePullSecrets An optional list of references to secrets in the same
     namespace to use for pulling images from registries see
     http://kubernetes.io/docs/user-guide/images#specifying-imagepullsecrets-on-a-pod

   podSecurityPolicyName        <string>
     PodSecurityPolicyName - defines name for podSecurityPolicy in case of empty
     value, prefixedName will be used.

   replicationFactor    <integer>
     ReplicationFactor defines how many copies of data make among distinct
     storage nodes

   retentionPeriod      <string> -required-
     RetentionPeriod for the stored metrics Note VictoriaMetrics has data/ and
     indexdb/ folders metrics from data/ removed eventually as soon as partition
     leaves retention period reverse index data at indexdb rotates once at the
     half of configured retention period
     https://docs.victoriametrics.com/Single-server-VictoriaMetrics.html#retention

   serviceAccountName   <string>
     ServiceAccountName is the name of the ServiceAccount to use to run the
     VMSelect Pods.

   vminsert     <Object>

   vmselect     <Object>

   vmstorage    <Object>
|
Similarly to get the properties that can be defined by the component you can also get them in this way. For example, to see the properties that can be configured for the vmstorage object.
  1
  2
  3
  4
  5
  6
  7
  8
  9
 10
 11
 12
 13
 14
 15
 16
 17
 18
 19
 20
 21
 22
 23
 24
 25
 26
 27
 28
 29
 30
 31
 32
 33
 34
 35
 36
 37
 38
 39
 40
 41
 42
 43
 44
 45
 46
 47
 48
 49
 50
 51
 52
 53
 54
 55
 56
 57
 58
 59
 60
 61
 62
 63
 64
 65
 66
 67
 68
 69
 70
 71
 72
 73
 74
 75
 76
 77
 78
 79
 80
 81
 82
 83
 84
 85
 86
 87
 88
 89
 90
 91
 92
 93
 94
 95
 96
 97
 98
 99
100
101
102
103
104
105
106
107
108
109
110
111
112
113
114
115
116
117
118
119
120
121
122
123
124
125
126
127
128
129
130
131
132
133
134
135
136
137
138
139
140
141
142
143
144
145
146
147
148
149
150
151
152
153
154
155
156
157
158
159
160
161
162
163
164
165
166
167
168
169
|
☸ ➜ kubectl explain VMCluster.spec.vmstorage
KIND:     VMCluster
VERSION:  operator.victoriametrics.com/v1beta1

RESOURCE: vmstorage <Object>

DESCRIPTION:
     <empty>

FIELDS:
   affinity     <>
     Affinity If specified, the pod's scheduling constraints.

   configMaps   <[]string>
     ConfigMaps is a list of ConfigMaps in the same namespace as the VMSelect
     object, which shall be mounted into the VMSelect Pods. The ConfigMaps are
     mounted into /etc/vm/configs/<configmap-name>.

   containers   <[]>
     Containers property allows to inject additions sidecars or to patch
     existing containers. It can be useful for proxies, backup, etc.

   dnsConfig    <Object>
     Specifies the DNS parameters of a pod. Parameters specified here will be
     merged to the generated DNS configuration based on DNSPolicy.

   dnsPolicy    <string>
     DNSPolicy sets DNS policy for the pod

   extraArgs    <map[string]string>

   extraEnvs    <[]>
     ExtraEnvs that will be added to VMSelect pod

   hostNetwork  <boolean>
     HostNetwork controls whether the pod may use the node network namespace

   image        <Object>
     Image - docker image settings for VMStorage

   initContainers       <[]>
     InitContainers allows adding initContainers to the pod definition. Those
     can be used to e.g. fetch secrets for injection into the VMSelect
     configuration from external sources. Any errors during the execution of an
     initContainer will lead to a restart of the Pod. More info:
     https://kubernetes.io/docs/concepts/workloads/pods/init-containers/ Using
     initContainers for any use case other then secret fetching is entirely
     outside the scope of what the maintainers will support and by doing so, you
     accept that this behaviour may break at any time without notice.

   livenessProbe        <>
     LivenessProbe that will be added CRD pod

   logFormat    <string>
     LogFormat for VMSelect to be configured with. default or json

   logLevel     <string>
     LogLevel for VMSelect to be configured with.

   maintenanceInsertNodeIDs     <[]integer>
     MaintenanceInsertNodeIDs - excludes given node ids from insert requests
     routing, must contain pod suffixes - for pod-0, id will be 0 and etc. lets
     say, you have pod-0, pod-1, pod-2, pod-3. to exclude pod-0 and pod-3 from
     insert routing, define nodeIDs: [0,3]. Useful at storage expanding, when
     you want to rebalance some data at cluster.

   maintenanceSelectNodeIDs     <[]integer>
     MaintenanceInsertNodeIDs - excludes given node ids from select requests
     routing, must contain pod suffixes - for pod-0, id will be 0 and etc.

   name <string>
     Name is deprecated and will be removed at 0.22.0 release

   nodeSelector <map[string]string>
     NodeSelector Define which Nodes the Pods are scheduled on.

   podDisruptionBudget  <Object>
     PodDisruptionBudget created by operator

   podMetadata  <Object>
     PodMetadata configures Labels and Annotations which are propagated to the
     VMSelect pods.

   port <string>
     Port for health check connetions

   priorityClassName    <string>
     Priority class assigned to the Pods

   readinessProbe       <>
     ReadinessProbe that will be added CRD pod

   replicaCount <integer> -required-
     ReplicaCount is the expected size of the VMStorage cluster. The controller
     will eventually make the size of the running cluster equal to the expected
     size.

   resources    <Object>
     Resources container resource request and limits,
     https://kubernetes.io/docs/concepts/configuration/manage-resources-containers/

   rollingUpdateStrategy        <string>
     RollingUpdateStrategy defines strategy for application updates Default is
     OnDelete, in this case operator handles update process Can be changed for
     RollingUpdate

   runtimeClassName     <string>
     RuntimeClassName - defines runtime class for kubernetes pod.
     https://kubernetes.io/docs/concepts/containers/runtime-class/

   schedulerName        <string>
     SchedulerName - defines kubernetes scheduler name

   secrets      <[]string>
     Secrets is a list of Secrets in the same namespace as the VMSelect object,
     which shall be mounted into the VMSelect Pods. The Secrets are mounted into
     /etc/vm/secrets/<secret-name>.

   securityContext      <>
     SecurityContext holds pod-level security attributes and common container
     settings. This defaults to the default PodSecurityContext.

   serviceScrapeSpec    <>
     ServiceScrapeSpec that will be added to vmselect VMServiceScrape spec

   serviceSpec  <Object>
     ServiceSpec that will be create additional service for vmstorage

   startupProbe <>
     StartupProbe that will be added to CRD pod

   storage      <Object>
     Storage - add persistent volume for StorageDataPath its useful for
     persistent cache

   storageDataPath      <string>
     StorageDataPath - path to storage data

   terminationGracePeriodSeconds        <integer>
     TerminationGracePeriodSeconds period for container graceful termination

   tolerations  <[]Object>
     Tolerations If specified, the pod's tolerations.

   topologySpreadConstraints    <[]>
     TopologySpreadConstraints embedded kubernetes pod configuration option,
     controls how pods are spread across your cluster among failure-domains such
     as regions, zones, nodes, and other user-defined topology domains
     https://kubernetes.io/docs/concepts/workloads/pods/pod-topology-spread-constraints/

   vmBackup     <Object>
     VMBackup configuration for backup

   vmInsertPort <string>
     VMInsertPort for VMInsert connections

   vmSelectPort <string>
     VMSelectPort for VMSelect connections

   volumeMounts <[]Object>
     VolumeMounts allows configuration of additional VolumeMounts on the output
     Deployment definition. VolumeMounts specified will be appended to other
     VolumeMounts in the VMSelect container, that are generated as a result of
     StorageSpec objects.

   volumes      <[]>
     Volumes allows configuration of additional volumes on the output Deployment
     definition. Volumes specified will be appended to other volumes that are
     generated as a result of StorageSpec objects.
|
Directly apply the object defined above.
1
2
3
4
|
☸ ➜ kubectl apply -f vmcluster-demo.yaml
☸ ➜ kubectl get vmcluster
NAME             INSERT COUNT   STORAGE COUNT   SELECT COUNT   AGE     STATUS
vmcluster-demo   2              2               2              7m21s   expanding
|
After application, vm-operator will watch that we have created the CRD object and will automatically create the corresponding VM clusters according to our definition, which are the component services mentioned earlier.
 1
 2
 3
 4
 5
 6
 7
 8
 9
10
11
12
13
|
☸ ➜ kubectl get pods
NAME                                       READY   STATUS    RESTARTS      AGE
vminsert-vmcluster-demo-84956d98b5-5ckft   1/1     Running   0             93s
vminsert-vmcluster-demo-84956d98b5-kpcj6   1/1     Running   0             93s
vmselect-vmcluster-demo-0                  1/1     Running   0             3m7s
vmselect-vmcluster-demo-1                  1/1     Running   0             3m7s
vmstorage-vmcluster-demo-0                 1/1     Running   0             4m54s
vmstorage-vmcluster-demo-1                 1/1     Running   0             4m54s
☸ ➜ kubectl get svc
NAME                       TYPE        CLUSTER-IP      EXTERNAL-IP   PORT(S)                      AGE
vminsert-vmcluster-demo    ClusterIP   10.102.145.24   <none>        8480/TCP                     4m57s
vmselect-vmcluster-demo    ClusterIP   None            <none>        8481/TCP                     6m31s
vmstorage-vmcluster-demo   ClusterIP   None            <none>        8482/TCP,8400/TCP,8401/TCP   8m18s
|
We can manage the VM cluster by defining a simple VMCluster object, which is very convenient, especially when you have a large number of component copies and don’t need to manually configure the -storageNode parameter.
Now the VM cluster is installed successfully, but there is no data yet, so we still need to configure the monitoring metrics capture, here we can just go ahead and create a VMAgent object, create an object as shown below.
 1
 2
 3
 4
 5
 6
 7
 8
 9
10
11
12
13
14
15
16
17
|
# vmagent-demo.yaml
apiVersion: operator.victoriametrics.com/v1beta1
kind: VMAgent
metadata:
  name: vmagent-demo
spec:
  serviceScrapeNamespaceSelector: {}
  podScrapeNamespaceSelector: {}
  podScrapeSelector: {}
  serviceScrapeSelector: {}
  nodeScrapeSelector: {}
  nodeScrapeNamespaceSelector: {}
  staticScrapeSelector: {}
  staticScrapeNamespaceSelector: {}
  replicaCount: 1
  remoteWrite:
    - url: "http://vminsert-vmcluster-demo.default.svc.cluster.local:8480/insert/0/prometheus/api/v1/write"
|
Again to get all the configurable properties of VMAgent you can use kubectl explain VMAgent.spec to get them, the main configuration here is to specify the URL address of the remote write via remoteWrite.url, which is the service address of the vminsert component. Several other properties can be used to filter on the metrics to be fetched.
Apply the above VMAgent object directly to start capturing the monitoring data.
1
2
3
4
|
☸ ➜ kubectl apply -f vmagent-demo.yaml
☸ ➜ kubectl get vmagent
NAME           AGE
vmagent-demo   6s
|
After creation, vm-operator will create a corresponding vmagent instance based on the corresponding description.
1
2
3
|
☸ ➜ kubectl get pods -l app.kubernetes.io/name=vmagent
NAME                                    READY   STATUS    RESTARTS   AGE
vmagent-vmagent-demo-6dcc7f9dfd-hxsff   2/2     Running   0          4m24s
|
You can see that vmagent has two containers, one is the vmagent application container and the other is the config-reloader container used to mount the Secret object, which watches for configuration changes and sends a signal to vmagent to reload the configuration. In this Secret object is the configuration content of the defined vmagent crawl metric.
We can run the following command to make the port of vmagent accessible from the local machine.
1
2
3
|
☸ ➜ kubectl port-forward svc/vmagent-vmagent-demo 8429:8429
Forwarding from 127.0.0.1:8429 -> 8429
Forwarding from [::1]:8429 -> 8429
|
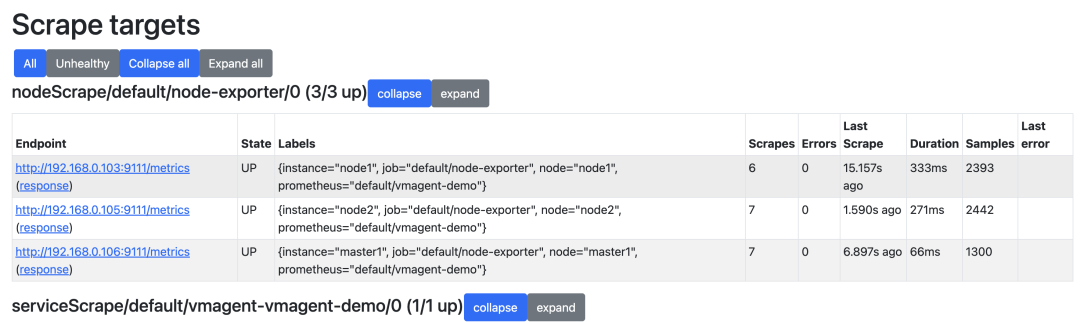
We can check the cluster metrics collected by vmagent by visiting http://127.0.0.1:8429/targets in the browser.
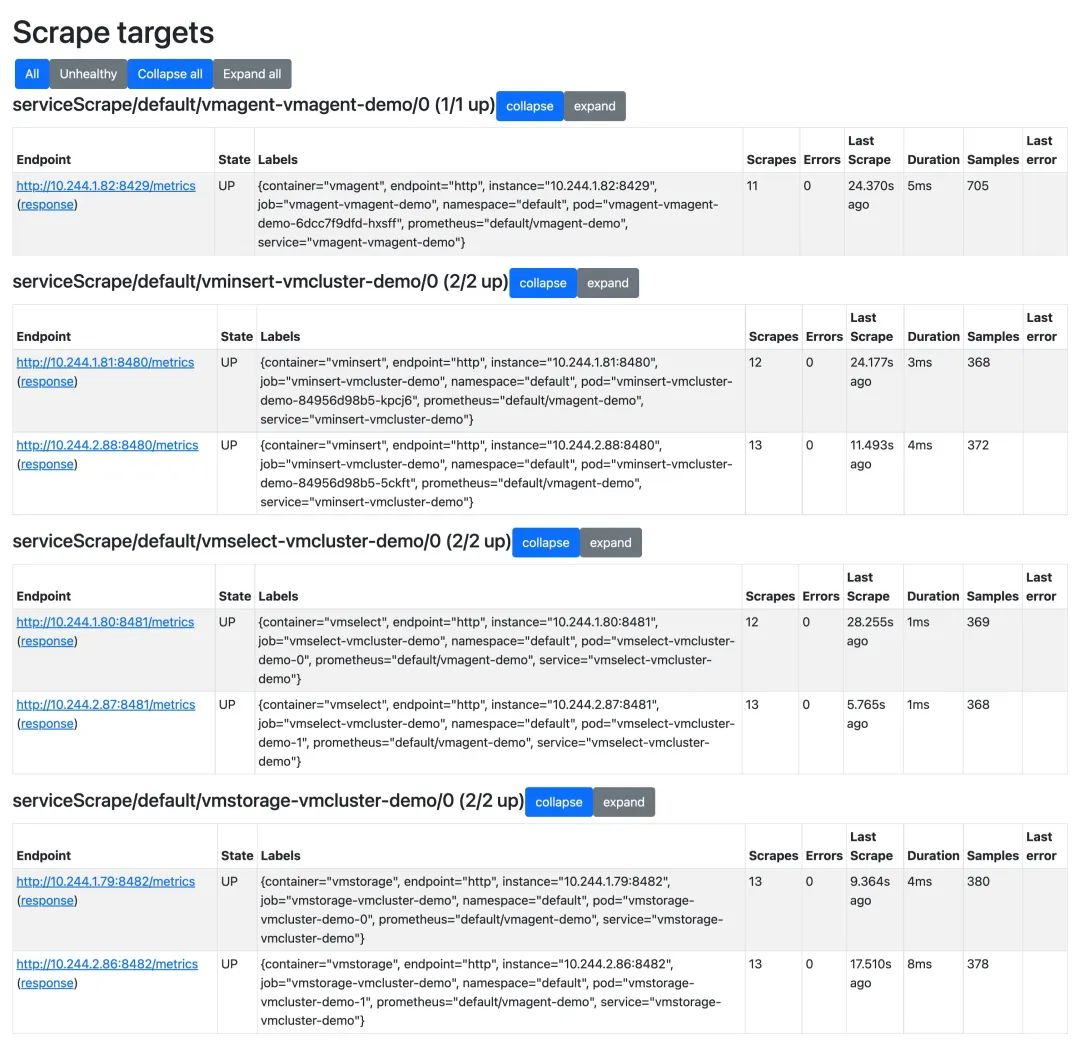
The vmagent will go through the Kubernetes service discovery to get the target to be crawled, which is controlled by the vm-operator.
Verifying VM Clustering
Next we install Grafana to validate the VM cluster, here we will just use Helm Chart for simplicity.
1
2
|
☸ ➜ helm repo add grafana https://grafana.github.io/helm-charts
☸ ➜ helm repo update
|
We can define the data source and some built-in dashboard in values in advance, as follows.
 1
 2
 3
 4
 5
 6
 7
 8
 9
10
11
12
13
14
15
16
17
18
19
20
21
22
23
24
25
26
27
28
29
30
31
32
33
34
35
36
37
38
39
40
41
42
43
44
45
46
47
48
49
50
51
52
53
54
55
56
57
58
59
60
61
62
63
64
65
66
|
cat <<EOF | helm install grafana grafana/grafana -f -
  datasources:
    datasources.yaml:
      apiVersion: 1
      datasources:
        - name: victoriametrics
          type: prometheus
          orgId: 1
          url: http://vmselect-vmcluster-demo.default.svc.cluster.local:8481/select/0/prometheus/
          access: proxy
          isDefault: true
          updateIntervalSeconds: 10
          editable: true

  dashboardProviders:
   dashboardproviders.yaml:
     apiVersion: 1
     providers:
     - name: 'default'
       orgId: 1
       folder: ''
       type: file
       disableDeletion: true
       editable: true
       options:
         path: /var/lib/grafana/dashboards/default

  dashboards:
    default:
      victoriametrics:
        gnetId: 11176
        revision: 18
        datasource: victoriametrics
      vmagent:
        gnetId: 12683
        revision: 7
        datasource: victoriametrics
      kubernetes:
        gnetId: 14205
        revision: 1
        datasource: victoriametrics
EOF
NAME: grafana
LAST DEPLOYED: Tue May 17 17:13:14 2022
NAMESPACE: default
STATUS: deployed
REVISION: 1
NOTES:
1. Get your 'admin' user password by running:

   kubectl get secret --namespace default grafana -o jsonpath="{.data.admin-password}" | base64 --decode ; echo

2. The Grafana server can be accessed via port 80 on the following DNS name from within your cluster:

   grafana.default.svc.cluster.local

   Get the Grafana URL to visit by running these commands in the same shell:

     export POD_NAME=$(kubectl get pods --namespace default -l "app.kubernetes.io/name=grafana,app.kubernetes.io/instance=grafana" -o jsonpath="{.items[0].metadata.name}")
     kubectl --namespace default port-forward $POD_NAME 3000

3. Login with the password from step 1 and the username: admin
#################################################################################
######   WARNING: Persistence is disabled!!! You will lose your data when   #####
######            the Grafana pod is terminated.                            #####
#################################################################################
|
Once the installation is complete, you can expose the Grafana service locally using the command prompted above.
1
2
3
4
|
☸ ➜ export POD_NAME=$(kubectl get pods --namespace default -l "app.kubernetes.io/name=grafana,app.kubernetes.io/instance=grafana" -o jsonpath="{.items[0].metadata.name}")
     kubectl --namespace default port-forward $POD_NAME 3000
Forwarding from 127.0.0.1:3000 -> 3000
Forwarding from [::1]:3000 -> 3000
|
The login user name is admin and the password can be obtained with the following command.
1
|
☸ ➜ kubectl get secret --namespace default grafana -o jsonpath="{.data.admin-password}" | base64 --decode ; echo
|
We can check the dashboard of the victoriametrics cluster.
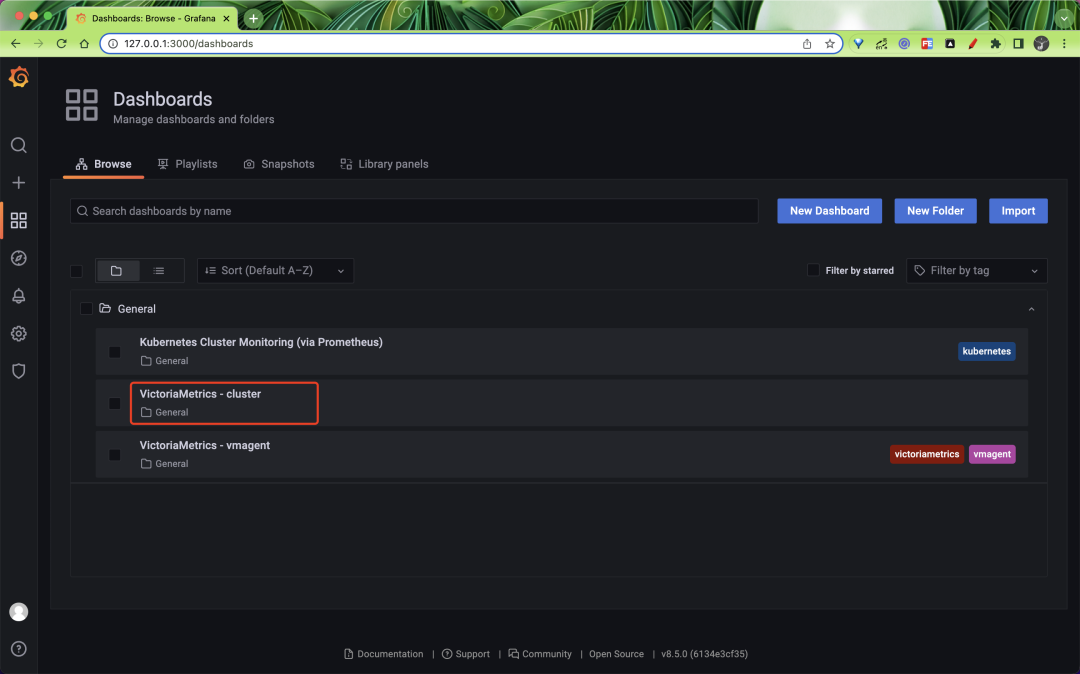
The normal page can be seen as shown below.
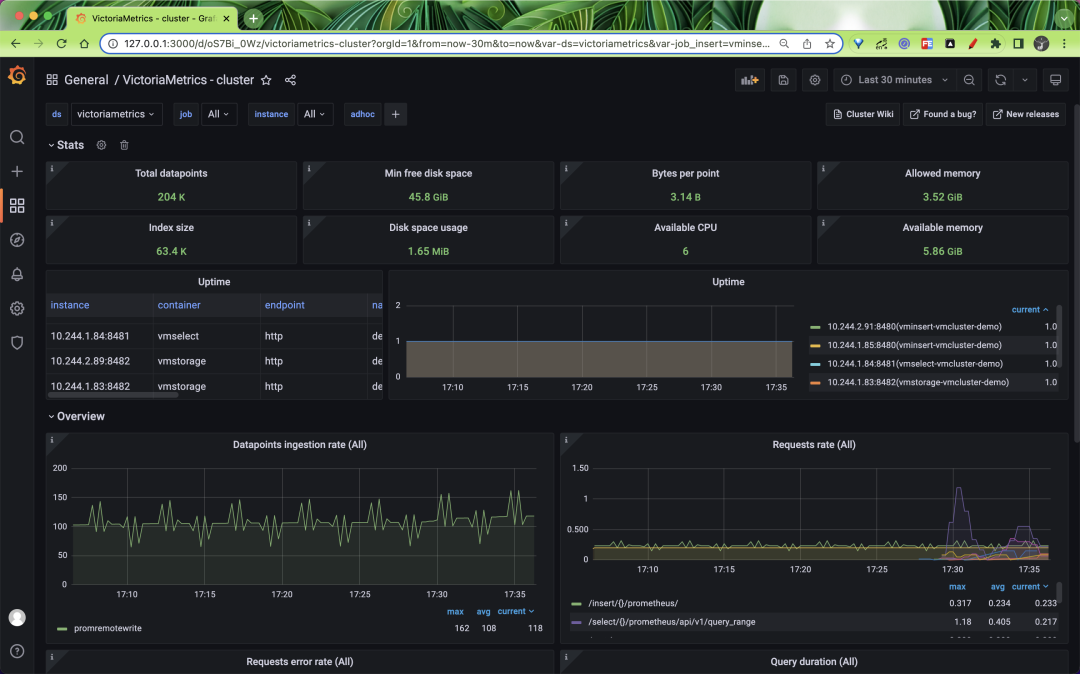
This is because by default VMAgent collects metrics from VM cluster related components, including vmagent itself, so we can see the VM cluster Dashboard normally, but not other metrics such as node-exporter, we can import the dashboard 16098 in Grafana.
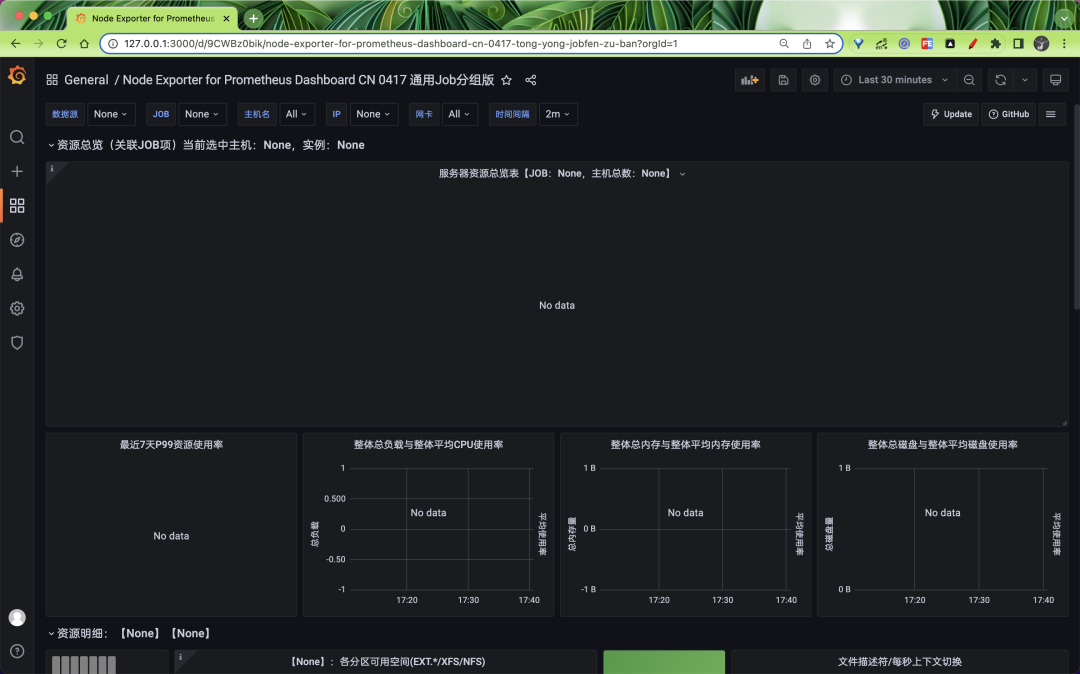
This time we can define it through the VMNodeScrape CRD object. The VMNodeScrape object can be used to automatically discover Kubernetes nodes, creating the resource object shown below to capture node-exporter metrics.
 1
 2
 3
 4
 5
 6
 7
 8
 9
10
11
|
# vmnode-exporter-scrape.yaml
apiVersion: operator.victoriametrics.com/v1beta1
kind: VMNodeScrape
metadata:
  name: node-exporter
spec:
  path: /metrics
  port: "9111" # 指定 node-exporter 的端口
  scrape_interval: 15s
#   relabelConfigs:  # relabel配置
#   selector:  # 过滤节点
|
It is sufficient to apply the above objects directly.
1
2
3
4
|
☸ ➜ kubectl apply -f vmnode-exporter-scrape.yaml
☸ ➜ kubectl get vmnodescrape
NAME            AGE
node-exporter   19s
|
Once created, the vmagent will automatically recognize the object to crawl the node-exporter.
At this point, the node-exporter dashboard will be fine.
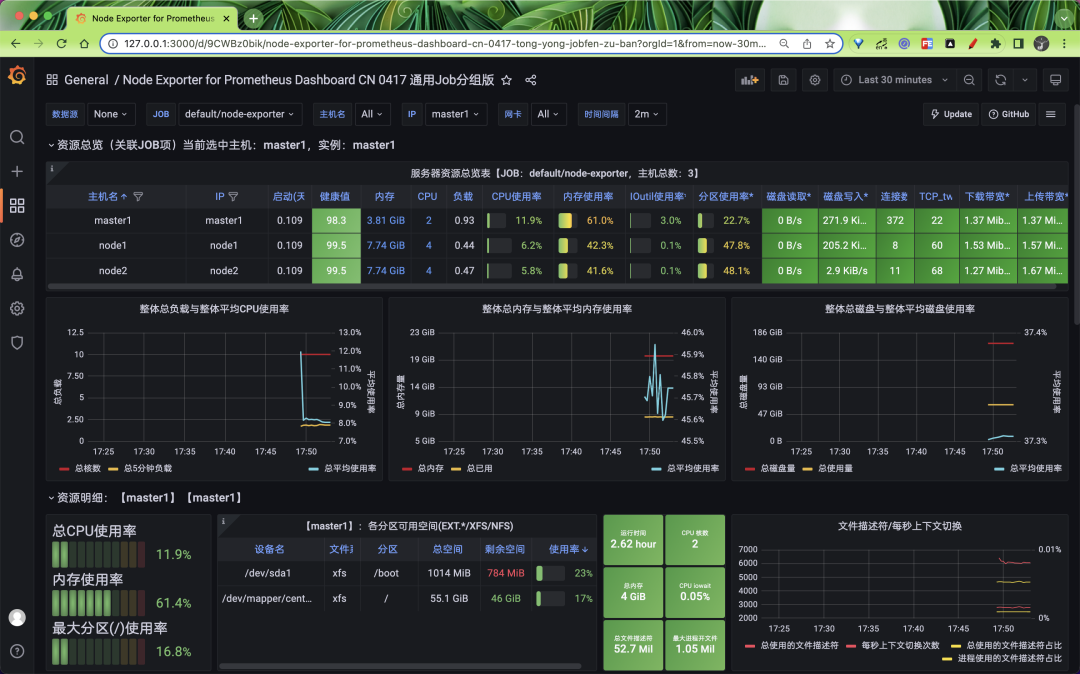
In addition, you can define the service services (Endpoints) to be crawled through VMServiceScrape, which generates the crawl configuration for vmagent based on the selector, and if you want to crawl the metrics of Pods without Service defined, you can define them through VMPodScrape, and there are also alarms and related CRDs to manage. vm-operator greatly reduces the management of VM clusters and is highly recommended.