Concepts
Process switching, soft interrupts, kernel state user state switching, CPU hyperthreading switching
Kernel state user state switch: still in a thread, just from the user state into the kernel state for safety and other factors need more instructions, system calls specific more what to do see: https://github.com/torvalds/linux/blob/v5.2/arch/x86/entry/entry_64.S#L145
Soft interrupts: such as network packet arrival, triggering ksoftirqd (one per core) process to handle, is a kind of process switching
Process switching is the heaviest inside, less context switching, and the cost of process blocking wake-up call scheduling. In addition, process switching has the initiative to give up the CPU switch, there are also time slices are switched after running out
CPU hyperthreading switch: the lightest, occurs inside the CPU, OS, applications can not sense
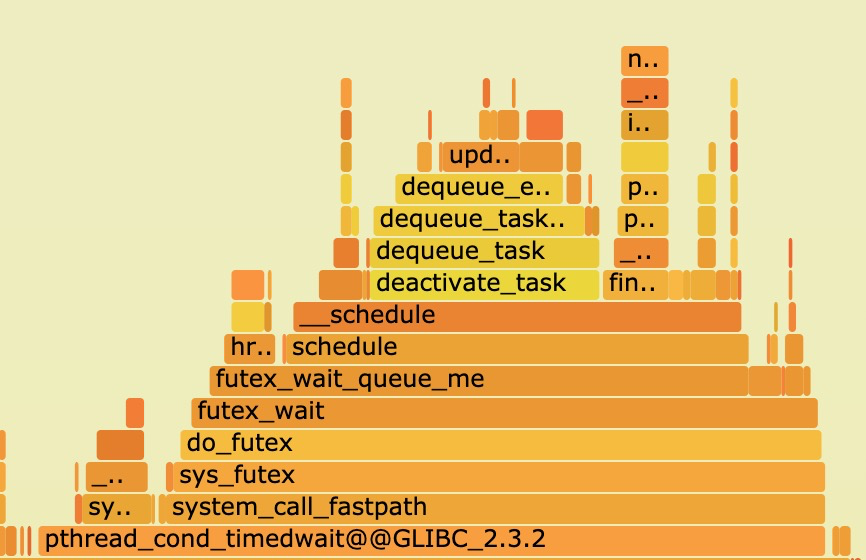
Hot flame diagram under multi-thread scheduling.
Context switching will also cause threads to lag longer because of scheduling.
Linux kernel process scheduling time slice is generally the inverse of HZ, HZ is generally set to 1000 when compiling, the inverse is 1ms, that is, the time slice of each process is 1ms (in the early years is 10ms - when HZ is 100), if process 1 blocks to let out the CPU into the scheduling queue, at this time there are two more in front of the scheduling queue Processes 2/3 are in the queue, which means that at worst it will be 2ms before 1 is scheduled for execution. The load determines the length of the queue, if the process whose turn to be scheduled is ready then there is no performance waste, on the other hand if the process whose turn to be scheduled is not ready (e.g. network packet not arrived) it is a waste of a scheduling.
sched_min_granularity_ns is the most prominent setting. In the original sched-design-CFS.txt this was described as the only “tunable” setting, “to tune the scheduler from ‘desktop’ (low latencies) to ‘server’ (good batching) workloads.”
In other words, we can change this setting to reduce overheads from context-switching, and therefore improve throughput at the cost of responsiveness (“latency”).
The CFS setting as mimicking the previous build-time setting, CONFIG_HZ. In the first version of the CFS code, the default value was 1 ms, equivalent to 1000 Hz for “desktop” usage. Other supported values of CONFIG_HZ were 250 Hz (the default), and 100 Hz for the “server” end. 100 Hz was also useful when running Linux on very slow CPUs, this was one of the reasons given when CONFIG_HZ was first added as an build setting on X86.
Or parameter adjustment.
 1
 2
 3
 4
 5
 6
 7
 8
 9
10
11
12
13
14
15
16
|
#sysctl -a |grep -i sched_ |grep -v cpu
kernel.sched_autogroup_enabled = 0
kernel.sched_cfs_bandwidth_slice_us = 5000
kernel.sched_cfs_bw_burst_enabled = 1
kernel.sched_cfs_bw_burst_onset_percent = 0
kernel.sched_child_runs_first = 0
kernel.sched_latency_ns = 24000000
kernel.sched_migration_cost_ns = 500000
kernel.sched_min_granularity_ns = 3000000
kernel.sched_nr_migrate = 32
kernel.sched_rr_timeslice_ms = 100
kernel.sched_rt_period_us = 1000000
kernel.sched_rt_runtime_us = 950000
kernel.sched_schedstats = 1
kernel.sched_tunable_scaling = 1
kernel.sched_wakeup_granularity_ns = 4000000
|
Testing
How long does it take to make a context switch??
 1
 2
 3
 4
 5
 6
 7
 8
 9
10
11
12
13
14
15
16
17
18
19
20
21
22
23
24
25
26
27
28
29
30
31
32
33
34
35
36
37
38
39
40
41
42
43
44
45
46
47
48
49
50
51
52
53
54
55
56
57
58
59
60
61
62
63
64
65
66
67
68
69
70
71
72
73
74
75
76
77
78
79
80
81
82
83
84
85
86
87
88
|
model name : Intel(R) Xeon(R) Platinum 8269CY CPU @ 2.50GHz
2 physical CPUs, 26 cores/CPU, 2 hardware threads/core = 104 hw threads total
-- No CPU affinity --
10000000 system calls in 1144720626ns (114.5ns/syscall)
2000000 process context switches in 6280519812ns (3140.3ns/ctxsw)
2000000  thread context switches in 6417846724ns (3208.9ns/ctxsw)
2000000  thread context switches in 147035970ns (73.5ns/ctxsw)
-- With CPU affinity --
10000000 system calls in 1109675081ns (111.0ns/syscall)
2000000 process context switches in 4204573541ns (2102.3ns/ctxsw)
2000000  thread context switches in 2740739815ns (1370.4ns/ctxsw)
2000000  thread context switches in 474815006ns (237.4ns/ctxsw)
-- With CPU affinity to CPU 0 --
10000000 system calls in 1039827099ns (104.0ns/syscall)
2000000 process context switches in 5622932975ns (2811.5ns/ctxsw)
2000000  thread context switches in 5697704164ns (2848.9ns/ctxsw)
2000000  thread context switches in 143474146ns (71.7ns/ctxsw)
----------
model name : Intel(R) Xeon(R) CPU E5-2682 v4 @ 2.50GHz
2 physical CPUs, 16 cores/CPU, 2 hardware threads/core = 64 hw threads total
-- No CPU affinity --
10000000 system calls in 772827735ns (77.3ns/syscall)
2000000 process context switches in 4009838007ns (2004.9ns/ctxsw)
2000000  thread context switches in 5234823470ns (2617.4ns/ctxsw)
2000000  thread context switches in 193276269ns (96.6ns/ctxsw)
-- With CPU affinity --
10000000 system calls in 746578449ns (74.7ns/syscall)
2000000 process context switches in 3598569493ns (1799.3ns/ctxsw)
2000000  thread context switches in 2475733882ns (1237.9ns/ctxsw)
2000000  thread context switches in 381484302ns (190.7ns/ctxsw)
-- With CPU affinity to CPU 0 --
10000000 system calls in 746674401ns (74.7ns/syscall)
2000000 process context switches in 4129856807ns (2064.9ns/ctxsw)
2000000  thread context switches in 4226458450ns (2113.2ns/ctxsw)
2000000  thread context switches in 193047255ns (96.5ns/ctxsw)
---------
model name : Intel(R) Xeon(R) Platinum 8163 CPU @ 2.50GHz
2 physical CPUs, 24 cores/CPU, 2 hardware threads/core = 96 hw threads total
-- No CPU affinity --
10000000 system calls in 765013680ns (76.5ns/syscall)
2000000 process context switches in 5906908170ns (2953.5ns/ctxsw)
2000000  thread context switches in 6741875538ns (3370.9ns/ctxsw)
2000000  thread context switches in 173271254ns (86.6ns/ctxsw)
-- With CPU affinity --
10000000 system calls in 764139687ns (76.4ns/syscall)
2000000 process context switches in 4040915457ns (2020.5ns/ctxsw)
2000000  thread context switches in 2327904634ns (1164.0ns/ctxsw)
2000000  thread context switches in 378847082ns (189.4ns/ctxsw)
-- With CPU affinity to CPU 0 --
10000000 system calls in 762375921ns (76.2ns/syscall)
2000000 process context switches in 5827318932ns (2913.7ns/ctxsw)
2000000  thread context switches in 6360562477ns (3180.3ns/ctxsw)
2000000  thread context switches in 173019064ns (86.5ns/ctxsw)
--------ECS
model name : Intel(R) Xeon(R) Platinum 8269CY CPU @ 2.50GHz
1 physical CPUs, 2 cores/CPU, 2 hardware threads/core = 4 hw threads total
-- No CPU affinity --
10000000 system calls in 561242906ns (56.1ns/syscall)
2000000 process context switches in 3025706345ns (1512.9ns/ctxsw)
2000000  thread context switches in 3333843503ns (1666.9ns/ctxsw)
2000000  thread context switches in 145410372ns (72.7ns/ctxsw)
-- With CPU affinity --
10000000 system calls in 586742944ns (58.7ns/syscall)
2000000 process context switches in 2369203084ns (1184.6ns/ctxsw)
2000000  thread context switches in 1929627973ns (964.8ns/ctxsw)
2000000  thread context switches in 335827569ns (167.9ns/ctxsw)
-- With CPU affinity to CPU 0 --
10000000 system calls in 630259940ns (63.0ns/syscall)
2000000 process context switches in 3027444795ns (1513.7ns/ctxsw)
2000000  thread context switches in 3172677638ns (1586.3ns/ctxsw)
2000000  thread context switches in 144168251ns (72.1ns/ctxsw)
---------kupeng 920
2 physical CPUs, 96 cores/CPU, 1 hardware threads/core = 192 hw threads total
-- No CPU affinity --
10000000 system calls in 1216730780ns (121.7ns/syscall)
2000000 process context switches in 4653366132ns (2326.7ns/ctxsw)
2000000  thread context switches in 4689966324ns (2345.0ns/ctxsw)
2000000  thread context switches in 167871167ns (83.9ns/ctxsw)
-- With CPU affinity --
10000000 system calls in 1220106854ns (122.0ns/syscall)
2000000 process context switches in 3420506934ns (1710.3ns/ctxsw)
2000000  thread context switches in 2962106029ns (1481.1ns/ctxsw)
2000000  thread context switches in 543325133ns (271.7ns/ctxsw)
-- With CPU affinity to CPU 0 --
10000000 system calls in 1216466158ns (121.6ns/syscall)
2000000 process context switches in 2797948549ns (1399.0ns/ctxsw)
2000000  thread context switches in 3119316050ns (1559.7ns/ctxsw)
2000000  thread context switches in 167728516ns (83.9ns/ctxsw)
|
Test code repository: https://github.com/tsuna/contextswitch
Source code: timectxsw.c Results:
- Intel 5150: ~4300ns/context switch
- Intel E5440: ~3600ns/context switch
- Intel E5520: ~4500ns/context switch
- Intel X5550: ~3000ns/context switch
- Intel L5630: ~3000ns/context switch
- Intel E5-2620: ~3000ns/context switch
Context switching can speed up between 66-45% if tied to a core.
System call cost.
Source code: timesyscall.c Results:
- Intel 5150: 105ns/syscall
- Intel E5440: 87ns/syscall
- Intel E5520: 58ns/syscall
- Intel X5550: 52ns/syscall
- Intel L5630: 58ns/syscall
- Intel E5-2620: 67ns/syscall
How much overhead does a process/thread switch actually require?
 1
 2
 3
 4
 5
 6
 7
 8
 9
10
11
12
13
14
15
16
17
18
19
20
21
22
23
24
25
26
27
28
29
30
31
32
33
34
35
36
37
38
39
40
41
42
43
44
|
/*
Create two processes and pass a token between them. One of the processes causes blocking when it reads the token. The other process sends the token and waits for its return while also blocking. This is done a certain number of times and then their average single switchover time overhead is counted.
*/
#include <stdio.h>
#include <stdlib.h>
#include <sys/time.h>
#include <time.h>
#include <sched.h>
#include <sys/types.h>
#include <unistd.h> //pipe()
int main()
{
int x, i, fd[2], p[2];
char send = 's';
char receive;
pipe(fd);
pipe(p);
struct timeval tv;
struct sched_param param;
param.sched_priority = 0;
while ((x = fork()) == -1);
if (x==0) {
sched_setscheduler(getpid(), SCHED_FIFO, ¶m);
gettimeofday(&tv, NULL);
printf("Before Context Switch Time%u s, %u us\n", tv.tv_sec, tv.tv_usec);
for (i = 0; i < 10000; i++) {
read(fd[0], &receive, 1);
write(p[1], &send, 1);
}
exit(0);
}
else {
sched_setscheduler(getpid(), SCHED_FIFO, ¶m);
for (i = 0; i < 10000; i++) {
write(fd[1], &send, 1);
read(p[0], &receive, 1);
}
gettimeofday(&tv, NULL);
printf("After Context SWitch Time%u s, %u us\n", tv.tv_sec, tv.tv_usec);
}
return 0;
}
|
Each context switch takes about 3.5us on average
Soft interrupt overhead calculation
The following calculation is rather brown, for reference only. The higher the pressure, the more network packets a soft interrupt needs to handle, the longer the time consumed. If the number of packets is too small then the test interference is too severe and the data is not accurate.
The tester sets the send/receive queue to 1, so that all soft interrupts are given to a single core to handle.
Interrupt is about 4000 when there is no pressure, then deliberately run pressure, CPU run to 80%, and check by vmstat and top.
1
2
3
4
5
6
7
|
$vmstat 1
procs -----------memory---------- ---swap-- -----io---- -system-- ------cpu-----
 r  b   swpd   free   buff  cache   si   so    bi    bo   in   cs us sy id wa st
19  0      0 174980 151840 3882800    0    0     0    11    1    1  1  0 99  0  0
11  0      0 174820 151844 3883668    0    0     0     0 30640 113918 59 22 20  0  0
 9  0      0 175952 151852 3884576    0    0     0   224 29611 108549 57 22 21  0  0
11  0      0 171752 151852 3885636    0    0     0  3452 30682 113874 57 22 21  0  0
|
top sees that si% is roughly 20%, which means that 25000 interrupts for a core consume 20% of the CPU, indicating that these soft interrupts consume 200 milliseconds.
200*1000 microseconds/25000 = 200/25 = 8 microseconds, 8000 nanoseconds - on the high side.
Reducing the pressure on the CPU runs to 55% si consumes 12%.
1
2
3
4
5
|
procs -----------memory---------- ---swap-- -----io---- -system-- ------cpu-----
 r  b   swpd   free   buff  cache   si   so    bi    bo   in   cs us sy id wa st
 6  0      0 174180 152076 3884360    0    0     0     0 25314 119681 40 17 43  0  0
 1  0      0 172600 152080 3884308    0    0     0   252 24971 116407 40 17 43  0  0
 4  0      0 174664 152080 3884540    0    0     0  3536 25164 118175 39 18 42  0  0
|
120*1000 microseconds/(21000) = 5.7 microseconds, 5700 nanoseconds - on the high side.
Reduced pressure (4 core CPU only pressed to 15%)
1
2
3
4
5
6
7
8
|
procs -----------memory---------- ---swap-- -----io---- -system-- ------cpu-----
 r  b   swpd   free   buff  cache   si   so    bi    bo   in   cs us sy id wa st
 0  0      0 183228 151788 3876288    0    0     0     0 15603 42460  6  3 91  0  0
 0  0      0 181312 151788 3876032    0    0     0     0 15943 43129  7  2 91  0  0
 1  0      0 181728 151788 3876544    0    0     0  3232 15790 42409  7  3 90  0  0
 0  0      0 181584 151788 3875956    0    0     0     0 15728 42641  7  3 90  0  0
 1  0      0 179276 151792 3876848    0    0     0   192 15862 42875  6  3 91  0  0
 0  0      0 179508 151796 3876424    0    0     0     0 15404 41899  7  2 91  0  0
|
Single core 11000 interrupt, corresponding to si CPU 2.2%
22*1000/11000= 2 microseconds 2000 nanoseconds Slightly more reliable
Hyperthreading switching overhead
Minimal, basically negligible, within 1ns
lmbench’s lat_ctx, etc., in microseconds, the context of a process is 1540 nanoseconds when the pressure is low
 1
 2
 3
 4
 5
 6
 7
 8
 9
10
11
12
13
14
15
16
|
[root@plantegg 13:19 /root/lmbench3]
#taskset -c 4 ./bin/lat_ctx -P 2 -W warmup -s 64 2  //CPU 打满
"size=64k ovr=3.47
2 7.88
#taskset -c 4 ./bin/lat_ctx -P 1 -W warmup -s 64 2
"size=64k ovr=3.46
2 1.54
#taskset -c 4-5 ./bin/lat_ctx  -W warmup -s 64 2
"size=64k ovr=3.44
2 3.11
#taskset -c 4-7 ./bin/lat_ctx -P 2 -W warmup -s 64 2  //CPU 打到50%
"size=64k ovr=3.48
2 3.14
#taskset -c 4-15 ./bin/lat_ctx -P 3 -W warmup -s 64 2
"size=64k ovr=3.46
2 3.18
|
After changing the WEB service to coroutine scheduling, the TPS increased by 50% (30,000 to 45,000), while the number of contextswitch decreased from 110,000 to 8,000 (and 4,500 for stress-free cs)
 1
 2
 3
 4
 5
 6
 7
 8
 9
10
11
12
13
14
15
16
17
18
19
20
21
|
procs -----------memory---------- ---swap-- -----io---- -system-- ------cpu-----
 r  b   swpd   free   buff  cache   si   so    bi    bo   in   cs us sy id wa st
 5  0      0 3831480 153136 3819244    0    0     0     0 23599 6065 79 19  2  0  0
 4  0      0 3829208 153136 3818824    0    0     0   160 23324 7349 80 18  2  0  0
 4  0      0 3833320 153140 3818672    0    0     0     0 24567 8213 80 19  2  0  0
 4  0      0 3831880 153140 3818532    0    0     0     0 24339 8350 78 20  2  0  0

[  99s] threads: 60, tps: 0.00, reads/s: 44609.77, writes/s: 0.00, response time: 2.05ms (95%)
[ 100s] threads: 60, tps: 0.00, reads/s: 46538.27, writes/s: 0.00, response time: 1.99ms (95%)
[ 101s] threads: 60, tps: 0.00, reads/s: 46061.84, writes/s: 0.00, response time: 2.01ms (95%)
[ 102s] threads: 60, tps: 0.00, reads/s: 46961.05, writes/s: 0.00, response time: 1.94ms (95%)
[ 103s] threads: 60, tps: 0.00, reads/s: 46224.15, writes/s: 0.00, response time: 2.00ms (95%)
[ 104s] threads: 60, tps: 0.00, reads/s: 46556.93, writes/s: 0.00, response time: 1.98ms (95%)
[ 105s] threads: 60, tps: 0.00, reads/s: 45965.12, writes/s: 0.00, response time: 1.97ms (95%)
[ 106s] threads: 60, tps: 0.00, reads/s: 46369.96, writes/s: 0.00, response time: 2.01ms (95%)
//4core
 PID USER      PR  NI    VIRT    RES    SHR S %CPU %MEM     TIME+ COMMAND
 11588 admin     20   0   12.9g   6.9g  22976 R 95.7 45.6   0:33.07 Root-Worke //Four coroutines to run the CPU basically full
 11586 admin     20   0   12.9g   6.9g  22976 R 93.7 45.6   0:34.29 Root-Worke
 11587 admin     20   0   12.9g   6.9g  22976 R 93.7 45.6   0:32.58 Root-Worke
 11585 admin     20   0   12.9g   6.9g  22976 R 92.0 45.6   0:33.25 Root-Worke
|
Without coroutine, the CPU was 20% idle and could not be hit, after using coroutine, the CPU ran to 95%.
Conclusion
- Process context switch takes several thousand nanoseconds (varies by CPU model)
- If you do taskset then context switching will reduce the time by 50% (avoiding L1, L2 Miss, etc.)
- Threads are slightly faster than process context switching by about 10%
- Test data and the actual operation of the scene is very relevant, it is difficult to control, CPU competition is too fierce to wait for the scheduling time; if the CPU is relatively idle to reflect the cache miss, etc., resulting in increased latency
- System calls are very light compared to process context switching, about 100ns or less
- function calls are even lighter, about a few ns, stack jumping
- CPU’s hyperthreading scheduling and function calls are similar, both can be done in a few ns
After looking at these data and thinking about what coroutine is doing and why it is efficient, it is natural.